The Midterm BRETT Trend Appears To Be Bearish!⚠️ Note: To enter a position, you should get confirmations on minute or hourly timeframes before entering. This is a mid-term view, as this coin is volatile and high-risk.
From the point marked as Strat on the chart, it appears that the BRETT correction has begun.
Currently, wave F seems to have completed, and the price has entered wave G, which is a bearish wave.
As long as the red zone holds, the mid-term BRETT trend is expected to remain bullish.
As indicated on the chart, the price is tr
Brettbtc
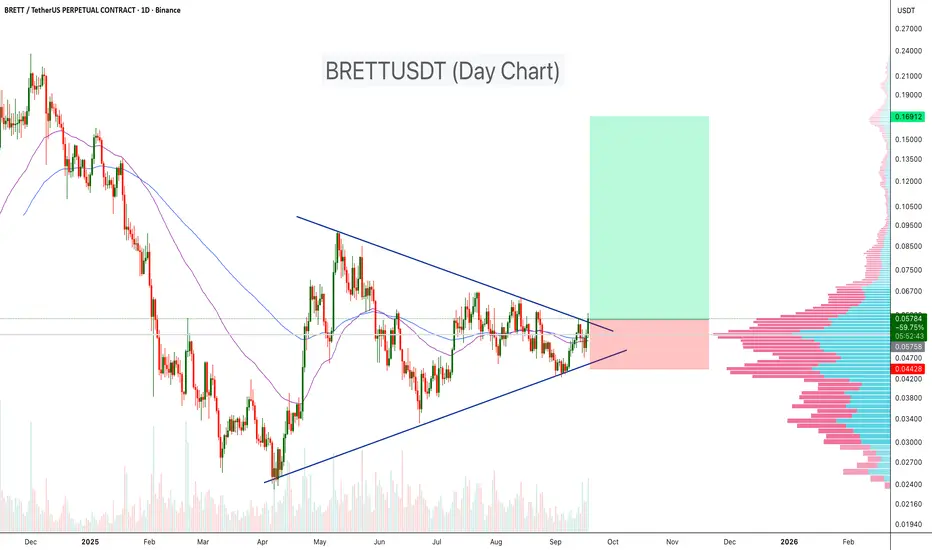
BRETTUSDT – Symmetrical Triangle Breakout!BRETTUSDT has been consolidating within a symmetrical triangle for several months, showing strong compression between ascending support and descending resistance. Recently, price action has started to break above the resistance trendline, signaling a possible bullish continuation. With moving averages turning supportive and volume profile showing a low-resistance zone above, this breakout could trigger a strong move higher.
Key Points:
- Pattern: Symmetrical triangle consolidation since Apr
BRETT - all time high and moon soon!?Brett - funny meme coin that retail likes to gamble on.
Brett is near all time high and a huge explosion is possible. If you don't already have a Brett position, it may be time to prepare for one. I see a pull back to 0.14 as healthy and a good entry before Brett picks up new power. Right now Retail is rushing into the market and it is not certain that there will be a pull back to the 0.5 fib level.
BRETT is risky with high volatility but with great potential.
Meme Magic on BRETT: Don’t Miss This Bullish Trend!THIS IS A MUST BUY! 🚀 As most memes are currently flipping bullish, this one just fired a bullish signal right off the lows.
What’s to like? This is just the beginning of the weekly trend. Sure, it might seem a bit late, but if everything aligns, the swing is safe to take.
I can’t see a chart more bullish than this at weekly prices. Price targets are indicated by the boxes, so adjust your risk and go long now! 📈
Grab It Now, Cash In by November!💰📈
Brett (BRETT/USDT) TECHNICAL ANALYSIS + PRICE PREDICTIONTechnical Analysis by Blaž Fabjan
Price Movement:
The asset shows a clear downtrend, followed by a short period of consolidation, and it is now breaking through a resistance level.
There is a marked bullish pattern, indicated by the breakout from a flag/pennant formation (shown by the blue upward line). This is often a continuation pattern signaling that the prior trend may resume after the consolidation.
Resistance Level:
There is a horizontal resistance line that has been marked. The price