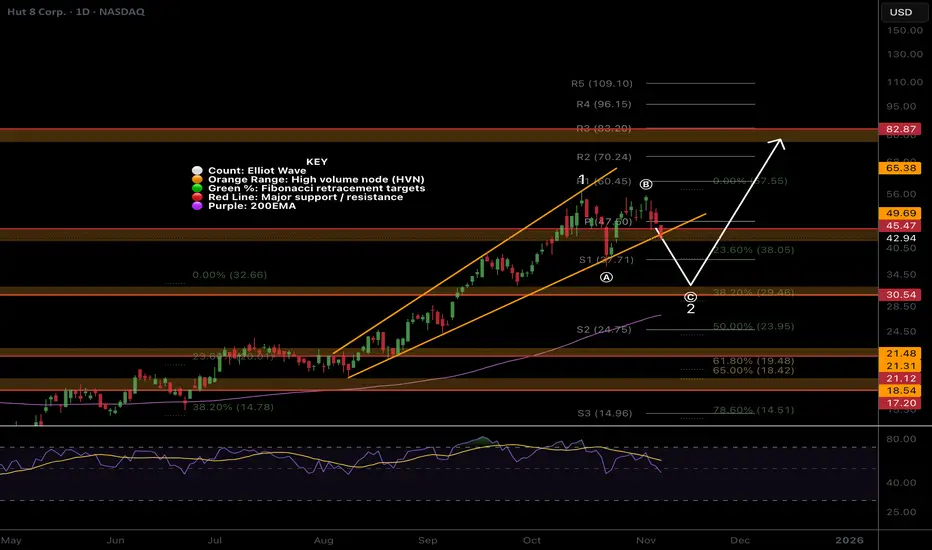
HUT Within channel boundary, all fine locallyNASDAQ:HUT Wave 1 appears complete at the channel upper boundary on bearish divergence.
For now the probability is to the upside and the trend is in tact. However, wave (B) of 2 looks complete. Wave C is expected to be strong and scary, capitulating many. Price is expected to terminate at the 0.382 Fibonacci retracement, High Volume Node support and rising daily 200EMA.
Daily RSI has printed bearish divergence from overbought but also bullish divergence at the EQ. This is ambigous.
Continued upside has a target os the $82 High Volume Node resistance.
BTC-D
Coinbase wave C underway NASDAQ:COIN Price appears to be completing wave C of IV, a corrective pattern to the downside expected to be shallow.
Wave IV are often shallow ending no further than the 0.5 Fibonacci retracement. This is just below the S2 pivot and High Volume Node support. 0.382 is the higher probability target for the end of the downwards move aligning with a swing below the daily 200EMA and S1 pivot.
Daily RSI has room to fall.
Breaking wave B would suggest a new bull move is underway.

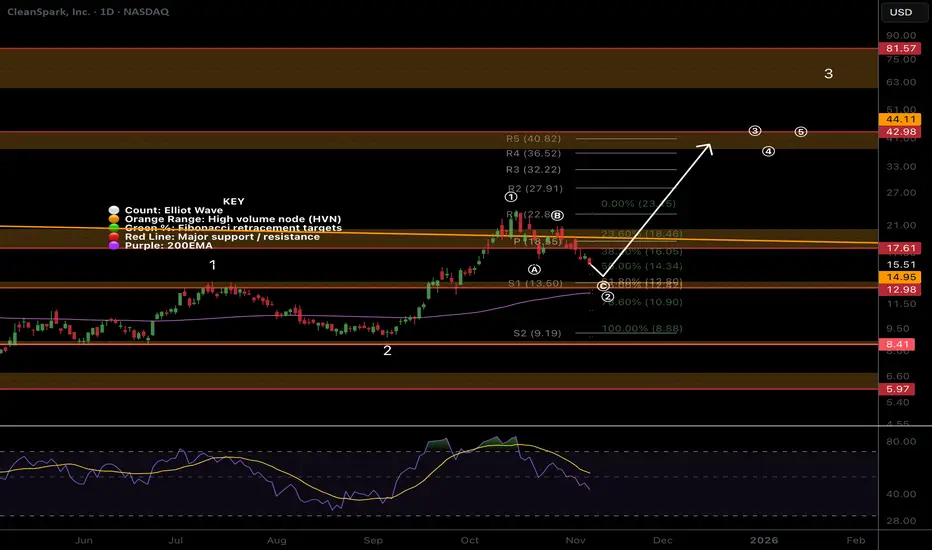
CLSK Local analysis, pullback does not violate larger trendNASDAQ:CLSK Price is pulling after a failed breakout falling back into the macro triangle. Behaviour appears to be a textbook corrective ABC which should end with one more thrust down to the S1 pivot before continuation to the upside.
Wave © can be strong and powerful, often where investors capitulate. The target is the High Volume Node support, rising daily 200EMA, Fibonacci golden pocket and S1 pivot.
Daily RSI has room to fall.
Breaking above wave (B) would suggest the correction is over.
CIFR Pullback time?NASDAQ:CIFR Locally, price continues into price discovery with big jumps suggesting wave 3 is still going Wave (5) of 3 appears to be underway which could end at any moment. I am still expecting a retracement to test the previous all time high and punish late investors who are chasing prices up, trapping them into capitulation later.
Wave 4 has a downside target of the 0.236 Fibonacci retracement, High Volume Node support + the trend-line retest, $14. This may also meet the ascending daily 200EMA.
Daily RSI has a series of bearish divergence from overbought which a strong signal for a reversal.
Continued upside could run the daily pivots to $38.

BTDR Consolidation below support often leads to a breakoutNASDAQ:BTDR Locally, price is struggling at the expected High Volume Node resistance but without a major rejection. Consolidation below resistance often leads to a breakout
Wave (3) characteristics are being followed with shallow pullbacks so far. The target for a stronger downwards move is the golden pocket and S1 pivot at $17 which would meet the rising daily 200EMA, adding confluence to a local bottom. This would be normal and should be expected.
Daily RSI has printed unconfirmed bullish divergence at the EQ.
Continued upside would flip $25 resistance into support.

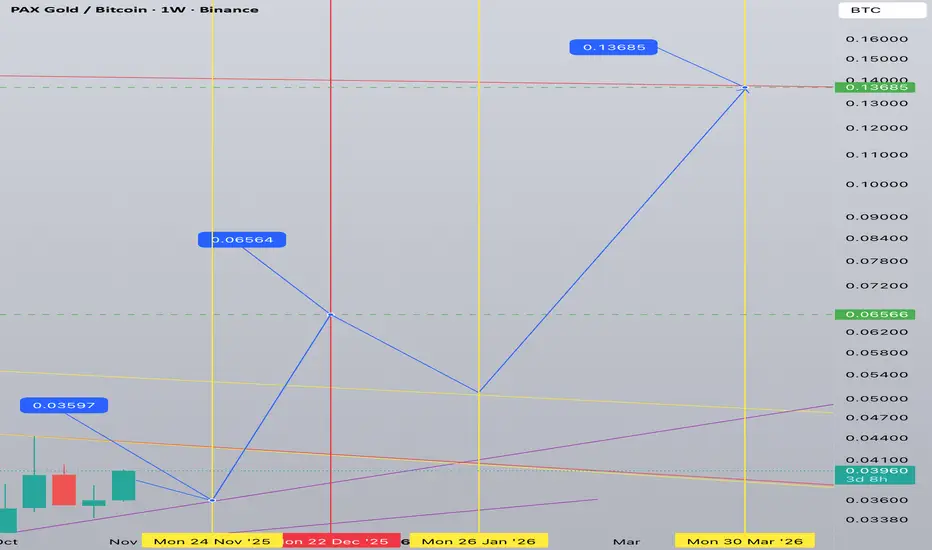
PAXG/BTC (Gold vs Bitcoin) 1W tf till March 2026Indeed BTC is in bear trend vs Gold until the end of March 2026. Gold will appreciate and this means falling crypto market in general.
Currently we are on the brink of a short correction - gold will go down/sideways in BTC terms.
After the correction we will see a rapid appreciation of gold vs bitcoin with one more correction between end of December 2025 and end of January 2026.
End of March 2026 will show us local top of PAXG/BTC.
Bitcoin - Will History Repeat Itself Again?📈Bitcoin continues to follow a remarkably similar path to its previous market cycles. Each major bullish impulse has been followed by a controlled correction, a fakeout towards the lower trendline, and then a strong rebound toward new highs.
Looking closely at the current structure, BTC seems to be retesting the lower bound of its long-term rising channel, a pattern that played out multiple times before every major leg up.
⚔️If history repeats itself, this fakeout could mark the final shakeout before the next macro rally, with a potential reversal forming between late November and early January.
🏹From there, the next impulsive wave could push price toward the upper boundary of the channel, around the $150,000–$160,000 zone, aligning perfectly with Bitcoin’s long-term cyclical rhythm.
The big question remains: will history rhyme once again, or is this time different?
⚠️ Disclaimer: This is not financial advice. Always do your own research and manage risk properly.
📊All Strategies Are Good; If Managed Properly!
~Richard Nasr

SOL to $4500?Internet Capital Markets
I believe Solana is going to take over the entire financial system.

SUI Approaching Major Support – Long Spot OpportunitySUI has entered a key support zone between $1.82 – $1.96, a level that has historically shown strong demand. Price is consolidating near the upper end of this zone, which could indicate potential accumulation. If this level holds, it presents a solid opportunity for a long spot entry.
🔹 Entry Zone: $1.82 – $1.96
🔹 Stop Loss: Below $1.75
🔹 Take Profit Targets:
• TP1: $2.40 – $2.80
• TP2: $3.10 – $3.55
This setup offers a favorable risk-to-reward ratio, especially if volume and market momentum align with the bounce. Watch for bullish confirmation signals—such as strong candle closes or rising volume—within the support zone before entering. Always respect the stop loss to protect capital.

ETH/USDT | ETH Under Pressure – Watching Major Demand at $2,500!By analyzing the Ethereum chart on the weekly timeframe, we can see that Ethereum, similar to Bitcoin, has started a correction — dropping as low as $3,050 earlier today and now trading around $3,300.
Key demand zones to watch are at $2,900, $2,700, and especially $2,500, which is a major support area. If price dips into this zone, I expect a strong bullish reaction from buyers. This analysis will be updated once confirmation appears on the chart.
Please support me with your likes and comments to motivate me to share more analysis with you and share your opinion about the possible trend of this chart with me !
Best Regards , Arman Shaban

BITCOIN's PUMPs are Getting LARGER this Bull Market...However, it may take a bit longer to realize those expansionary moves.
If Bitcoin adheres to the established cycle pattern, we can anticipate a minimum surge of 103% that should carry us into the fourth quarter of this year.
Consolidation ----> Fake breakdown ----> then expansion.
Are you ready?

BTC.D and altseason until the end of 2025BTC.D will refuse to show a significant fall in 2025. First week of 2026 is the beginning of altseason preview. It will end in March.
Currently BTC.D is #overbought and relief bounce in alts is imminent lasting for a couple of weeks with suddent reversal.

Be careful with bitcoin !!!As you can see, the price has dropped significantly after breaking the head and shoulders pattern, and now,with some price stabilization—it could potentially return to its previous highs

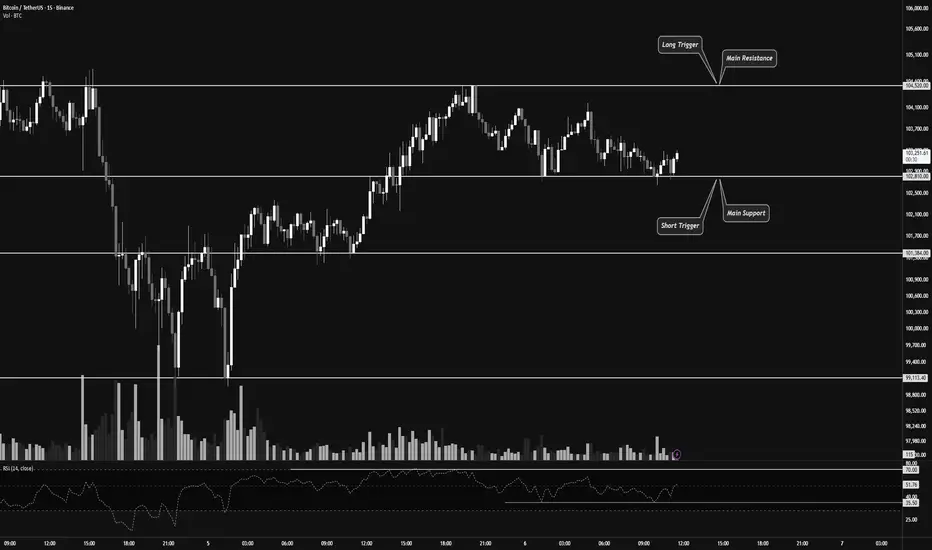
Wider Range or Early Trend Reversal in Multi-Timeframe?👋🏻 Hey everyone! Hope you’re doing great! Welcome to SatoshiFrame channel.
✨ Today we’re diving into the 15-Mimutes Bitcoin analysis. Stay tuned and follow along!
👀 On the 15-minute timeframe of Bitcoin, we can see that after recent declines, BTC has entered a 15-minute trading range. The top and bottom of this range act as our long and short triggers. Keep in mind that Bitcoin’s next move could potentially develop into a long-term directional move.
🧮 Looking at the RSI oscillator, the 70 level serves as confirmation for a long trigger, while the 35.5 level confirms a short trigger. Note that RSI confirmation based on its momentum swings can provide higher-quality trade setups.
🕯 Selling volume has increased slightly as Bitcoin approaches its resistance zone at $104,520, and we’ve seen a similar reaction when price hits resistance from below. This indicates buyer hesitation and stronger seller activity.
Meanwhile, buying volume has risen as price nears the support zone around $102,810. If this buying pressure continues, it could confirm an extended range formation in this area.
✍️ As in previous setups, Bitcoin’s potential scenarios remain straightforward. With proper RSI confirmation, we can look for entry opportunities.
🟢 Long Scenario : A breakout above the $104,520 resistance zone, accompanied by increasing buying volume and RSI exceeding the 70 level on the 15-minute multi-timeframe, could signal a long trade.
🟥 Short Scenario : A breakdown below the $102,810 support zone, with rising selling volume and RSI dropping below the 35.5 level, could trigger a short trade.
❤️ Disclaimer : This analysis is purely based on my personal opinion and I only trade if the stated triggers are activated .
BTCUSDT Daily Chart Analysis. BTCUSDT Daily Chart Analysis.
Support Zone: BTC is testing the major green demand region ($100,000–$104,000), which has triggered strong rallies in previous months.
Pattern & Projection: Price is holding near support with a bullish reversal scenario outlined—if buyers step in here, the chart suggests a possible uptrend toward $123,000–$124,700, and a technical rally of 46% (mirroring past moves).
Caution: If BTC loses this region, downside risk opens up, but as long as the zone holds, upside potential is favorable.
DYOR | NFA

TradeCityPro | Bitcoin Daily Analysis #212👋 Welcome to TradeCity Pro!
Let’s dive into the Bitcoin analysis. The market has entered a corrective phase and is preparing for the next wave of movement.
⏳ 1-Hour Timeframe
On the 1-hour timeframe, Bitcoin started correcting after reaching the support at 100,308 and has now retraced to the 0.382 Fibonacci level.
📊 Market volume significantly increased around the 100,308 support, indicating that this zone is very sensitive and important, with price reacting to it.
✨ Currently, volume has decreased slightly, and the price is in a corrective phase. If this correction continues, the next resistance zones will be at the 0.5 and 0.618 Fibonacci levels.
⭐ However, if the price continues its downward movement, we can open a position with a candlestick setup when the volume increases towards 100,308, or wait for the break of the 100,308 support to open a position.
✅ For a long position, if buying volume increases, the break of the 0.382 Fibonacci level would be a good trigger for a long entry.
❌ Disclaimer ❌
Trading futures is highly risky and dangerous. If you're not an expert, these triggers may not be suitable for you. You should first learn risk and capital management. You can also use the educational content from this channel.
Finally, these triggers reflect my personal opinions on price action, and the market may move completely against this analysis. So, do your own research before opening any position.

BITCOIN → The hunt for liquidity before the decline BINANCE:BTCUSDT is testing the 100K area and updating its local minimum to 98,900 as part of another liquidation. The market is weak, and bulls are trying to wait out the panic...
Bitcoin looks weak. After a sharp decline, a pullback is forming, during which the price may test the break-even and interest zones — previously broken support areas. Buyers are not yet showing themselves in the market...
There is an intermediate bottom at 98,900, as well as the upper limit of the local range at 105,200. The range of 105,200 - 107,200 - 108,200 is important because it hides a pool of liquidity for a downward movement. MM may reach these zones and bring the price back into the trading range.
Resistance levels: 105,182, 107,271
Support levels: 101130, 98900
A retest of resistance at 105182 and the lack of potential for continued growth may confirm the fact of a false breakout, which in turn may provoke a fall to local targets. I do not rule out the possibility that the price may go even higher, for example, to 107270 - 108200. I do not see any point in waiting for a trend reversal yet...
Best regards, R. Linda!

106K Then 94K BTCMorning folks,
So, our suggestions were not in vain. As usual on a ruins of H&S we've got the butterfly and 105K lows has been broken. BTC could drop more, but now it is technically oversold.
We suggest upside bounce, at least to 106K resistance area where we consider another short entry attempt. Downside potential targets are 94-96K and then 80K if situation turns on worst scenario. But we will know it only by November close.

ETHUSDT → Breakdown of the global trend. Distribution to 3360BINANCE:ETHUSDT is entering a distribution phase after breakdown of a consolidation formed against the backdrop of a bearish trend (correction). Sentiment, like the fundamental background, is changing...
Bitcoin is falling, which is putting pressure on the market. The reasons are weak fundamentals, index correction, and the rise of the dollar (outflow of funds from the market). On the daily ETH timeframe, we see a break in the uptrend. Monday's candle closed below the trend line, and since the opening of the session, the price has rallied (panic???)
Ethereum is coming out of consolidation (breakthrough of 3671). A distribution phase is forming, directed towards 3366 (liquidity pool). Technically, a false breakdown of support could trigger a pullback to 3600 (retest of the previously broken upward support line).
Support levels: 3366, 3150, 3000
Resistance levels: 3600, 3670, 3916
Despite the breakdown of the trend structure, we have strong support ahead. If the bulls hold 3366, the market may form a wider trading range. But if the overall background does not change, the decline may continue after the correction...
Best regards, R. Linda!

BTC Price Prediction – Key Support at 98900 Before Next Big MoveBitcoin is currently trading around $105,700, showing a short-term correction after a strong sell-off.
Trendline: A clear descending resistance line continues to hold, capping all recovery attempts.
Break of Structure: The BOS from 109,800 → 103,000 confirms bearish control.
Order Blocks:
🔴 Supply zones: $107,800 → $109,800 and $111,400 → $115,900 — strong resistance where sellers are likely to react.
🔵 Demand zones: $103,000 → $100,000 and a deeper block near $98,900, aligning with a trendline support — potential rebound area.
Volume: Buyer interest weakened after the recent bounce — showing limited demand at current levels.
Bias: Still bearish until BTC breaks above EMA trendline / $107,800 zone.
Next supports are $103,000 and $98,900; resistance levels remain at $107,800 and $111,400.

BTCUSD H1 | Bearish Drop OffBitcoin (BTC/USD) has rejected the sell entry at 104,504.68, which is a pullback resistance that lines up with the 59% Fibonacci retracement and could drop from this level to the downside.
Stop loss is at 105,308.55, which is a pullback resistance that lines up with the 61.8% Fibonacci retracemnt.
Take profit is at 98,945.84, which is a pullback support.
Stratos Markets Limited (tradu.com ):
CFDs are complex instruments and come with a high risk of losing money rapidly due to leverage. 68% of retail investor accounts lose money when trading CFDs with this provider. You should consider whether you understand how CFDs work and whether you can afford to take the high risk of losing your money.
Stratos Europe Ltd (tradu.com ):
CFDs are complex instruments and come with a high risk of losing money rapidly due to leverage. 70% of retail investor accounts lose money when trading CFDs with this provider. You should consider whether you understand how CFDs work and whether you can afford to take the high risk of losing your money.

Bitcoin Bounce Underway, But Bears May Not Be Done YetMy initial 100k downside target has been reached. While we’re seeing the almost obligatory bounce from a key level, Bitcoin could still head towards 90k. I take a fresh look at Bitcoin futures and their correlation with Wall Street.
Matt Simpson, Market Analyst at City Index

BTCUDST.P - November 5, 2025BTCUSDT is currently consolidating within a tight range; a scalp setup is identified with a long entry above 101,859 targeting 104,420, and a short entry below 98,888 targeting 97,056, depending on which breakout confirms first.
