Chart analysis for Bitcoin. !!Chart analysis for Bitcoin.
A view of Bitcoin, focusing on key technical levels and market structure:
Trend and Price Activity
Downtrend Confirmation:
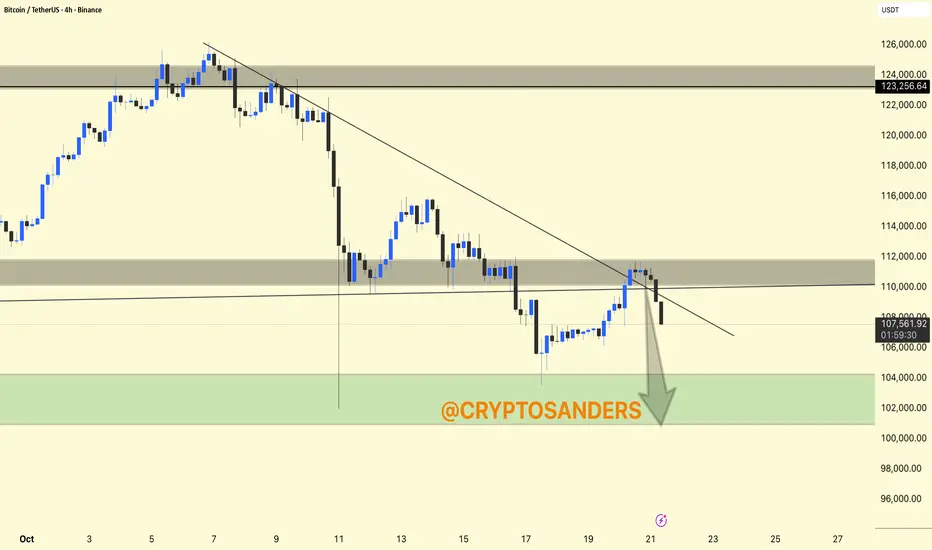
The price is clearly following a descending trendline. Attempts to break this line near the $111,000-$112,000 resistance level have failed.
Resistance Zone:
The gray area around $111,000-$112,000 represents a supply zone where the price struggled and faced selling pressure.
A very high resistance band exists near $123,000-$124,000 (upper chart), but the price is still well below this level.
Support Zone:
The large green box at $102,000-$106,000 marks a key demand zone, indicating where buyers could step in for a potential reversal or bounce.
DYOR | NFA
BTC-D
Bullish rise?Bitcoin (BTC/USD) is reacting off the pivot and could bounce to the pullback resistance.
Pivot: 109,846.88
1st Support: 104,701.40
1st Resistance: 115,813.42
Disclaimer:
The above opinions given constitute general market commentary, and do not constitute the opinion or advice of IC Markets or any form of personal or investment advice.
Any opinions, news, research, analyses, prices, other information, or links to third-party sites contained on this website are provided on an "as-is" basis, are intended only to be informative, is not an advice nor a recommendation, nor research, or a record of our trading prices, or an offer of, or solicitation for a transaction in any financial instrument and thus should not be treated as such. The information provided does not involve any specific investment objectives, financial situation and needs of any specific person who may receive it. Please be aware, that past performance is not a reliable indicator of future performance and/or results. Past Performance or Forward-looking scenarios based upon the reasonable beliefs of the third-party provider are not a guarantee of future performance. Actual results may differ materially from those anticipated in forward-looking or past performance statements. IC Markets makes no representation or warranty and assumes no liability as to the accuracy or completeness of the information provided, nor any loss arising from any investment based on a recommendation, forecast or any information supplied by any third-party.

gold\btcI don't understand this...
If gold protects against inflation, why is it losing so much value against Bitcoin?
Conspiracy theorists, the stage is yours 👀

BITCOIN SIGNAL: HUGE WHALE GETTING READY TO DO THIS NOW!!(scary)Yello Paradisers, enjoy the video!
And Paradisers! Keep in mind to trade only with a proper professional trading strategy. Wait for confirmations. Play with tactics. This is the only way you can be long-term profitable.
Remember, don’t trade without confirmations. Wait for them before creating a trade. Be disciplined, patient, and emotionally controlled. Only trade the highest probability setups with the greatest risk to reward ratio. This will ensure that you become a long-term profitable professional trader.
Don't be a gambler. Don't try to get rich quick. Make sure that your trading is professionally based on proper strategies and trade tactics.

$BTC Bulls Fight Back With Weekly CloseNot sure how I continue to amaze myself, but I do 🤓
Notice how those MMs respected my DANGER ZONE POI to the dollar?
Thankfully CRYPTOCAP:BTC did not close the Week outside the DZ.
The battle between Bulls and Bears is FIERCE 🔥
Bulls cannot afford another blue weekly close.
If so, the 50WMA retest ~102k will be inevitable.
Bulls need to reclaim and close this upcoming week above the 20WMA and .236 Fib
A close ~$116k would be super bullish.
That should be enough ammo to spark the long awaited parabola that UpTober has historically brought us.

The foundations of the next Altseason are quietly being built. OTHERS / BTC ratio one of the most important indicators for altcoins market strength has just touched the bottom of its falling wedge structure after a major drop, exactly 1743 days since the last similar event.
This point coincides precisely with December 2020, the starting zone of the previous major altcoin bull run.
The current setup mirrors that historical structure strikingly.
Historically, such levels have marked the early phases of massive altcoin rallies.

TradeCityPro | Bitcoin Daily Analysis #201👋 Welcome to TradeCity Pro!
Let’s dive into Bitcoin analysis—its bullish trend seems to have started again, so it’s very important to analyze it well for the new week.
⏳ 1-Hour Timeframe
Yesterday, Bitcoin formed a range box between 106319 and 107301, and by breaking the top of this box, it began an upward move.
📊 After breaking this box, buying volume increased sharply, and after a pullback to this area, the move continued up to 111645.
✔️ Now the price has returned above the 109000 zone, but it still hasn’t managed to hold above this area.
⭐ With a break of 111645, we can confirm that price has stabilized above the 109000 zone.
🔍 In that case, we can enter a long position on the break of 111645; and at the same time, we’ll confirm that the break of 109000 was a fake-out.
💥 The trigger on the RSI is the 74.53 level. With RSI entering Overbought and breaking 74.53, the next bullish leg can begin.
❌ Disclaimer ❌
Trading futures is highly risky and dangerous. If you're not an expert, these triggers may not be suitable for you. You should first learn risk and capital management. You can also use the educational content from this channel.
Finally, these triggers reflect my personal opinions on price action, and the market may move completely against this analysis. So, do your own research before opening any position.

Ethereum Setup: Watching for a Breakout Above the ChannelTime to take another look at Ethereum (ETHUSD). The crypto has spent the past couple of months correcting off its all-time high, with a drop to multi-month lows just a few weeks back. That said, ETH held strong support in the $3,300–$3,400 zone, which continues to act as a solid base.
Now we’re back trading in the $4,000–$4,200 area, which remains near-term resistance. The more ETH tests this zone, the more likely we are to see a breakout. Despite the recent pattern of lower highs and lower lows, bulls are defending the August 3rd low at $3,355—a level we consider pivotal going forward.
From a technical perspective, Ethereum is forming a descending price channel, which typically acts as a continuation pattern. A confirmed breakout above the upper trendline could trigger momentum toward the $5,700–$5,800 zone. A close above that trendline would be the signal to watch.

Ethereum’s Hidden Fractal Points to $33K by November 2026Most of the space seems to think that the bull market is officially over, that the four-year cycle has come to a close. For most of the cycle, I have thought that way too. 1,064 days is up, and that’s the longest a Bitcoin cycle has ever gone for. So, the idea that the same thing will play out again is very valid, and it’s entirely possible that it is indeed the end. However, my stance is very different — I still think we have one year left in the tank, and I will present a lot of evidence to support why I believe this and why I’m sticking to it.
If you’ve been following me for a while, you know that we’ve found some very interesting bar patterns in history that keep on repeating, and this will be the primary source of evidence used in my thesis.
Bar Pattern Fractals
I have tested hundreds of indicators over the last six years and bought thousands of dollars’ worth of indicators, and in the end, the highest success rate has come from simply following bar pattern fractals. They repeat over and over. They are hard to find, but once you do, you can ride them for months.
ETH 2017 Fractal
What you see above is a fractal I have been following for months now. It has been mirroring the 2017 cycle, with some parts nearly identical in movement and timing, with only a few small deviations here and there. The macro pattern continues to play out like clockwork.
Take a look at this TA from March 2025. We caught near the bottom, called for max pain, and discussed this fractal that could be playing out. The ETH call was under 2000 back then.
I also published TAs on Chainlink and its repeating bar patterns. It was straightforward for catching big macro moves for LINK.
As you can see, these are just two examples of many fractals I’m following. The main one is ETH because it’s been a 1:1 mirror for the most part. The last spike down was a deviation for sure — well, at first I thought it was on the Bitstamp chart because it has the most historical data for ETH, but when I switched to the Binance chart, I found something very interesting.
A view of the bar pattern fractal is telling us where we are.
When switching to the Binance chart, we see a very interesting wick of 26% that nuked the market during that time — very similar to what Binance has done this time around. You cannot make this stuff up. So at first, I thought it was a small deviation, but in fact, after looking at this chart, it’s still a mirror, even including that huge scam wick of 27%. Amazing.
So as you can see, in terms of the bar pattern fractal, I simply cannot ignore the fact that this keeps mirroring, and if it continues, it’s possible that we have one more year left in this bull market, and that this four-year cycle thesis is, in fact, a massive bear trap.
If we take a look at the monthly candle that shook a lot of players out last cycle before the run-up, we can see that we printed a candle with wicks on both ends — very similar to what we are forming right now.
If we zoom into that moment on a smaller timeframe, you can now see the moves are similar — a big drop into a double bottom followed by a slow grind up. This is how ETH normally puts in bottoms.
Looking at ETH’s RSI levels on the monthly chart — during the first cycle, when it broke the all-time high, RSI was extremely overbought at 87. On the last cycle, it was 82. This cycle, ETH is at an all-time high and the RSI is only 59. We’re not even in the overbought range yet — there’s so much room for ETH to expand, it’s crazy.
Since its inception, ETH has always pulled off the same move: one very aggressive wave with an aggressive pullback, followed by one smaller wave that creates a higher high to finish off the cycle. It’s done this every time.
Which means that if the bar pattern fractal continues to mirror, then wave 1 tops in the first week of January 2026, followed by a massive correction that will again fool everyone into thinking the four-year cycle is 100% over. But what if ETH puts in a bottom in February 2026 and rallies back up to all-time highs? Nobody would believe it — the disbelief would be strong because everyone would have sold the top in Q4 2025 due to the four-year cycle theory.
The second major piece of evidence I’m leaning on is the Russell 2000. Since its inception, the Russell 2000 has done the exact same thing before expansion comes:
Double top
Second drop bear trap
V-shaped recovery back to all-time high
Expansion breakout
Same thing every time. Look at the chart and tell me we’re not going into expansion — there’s a very high chance. The last two times, we got that massive monthly candle breakout in November.
Which brings me to the main point — every time the Russell goes into expansion, Bitcoin has started its most aggressive run. The last three times, Bitcoin went on to break its all-time high and put in a cycle top within an average of 355 days.
Gold, shown above, is so close to the 4.236 extension right now that it would be crazy to buy here. There’s a high chance of a major top coming in, and we’re about to see a major rotation back into Bitcoin with those gains.
Just take a look at the Power of Law model for Bitcoin — the bull market hasn’t even started yet.
It’s crazy that people are calling the cycle top with the Mayer Multiple sitting at 1.19.
Conclusion
My view is that there is one more year left in this uptrend in crypto. Bitcoin has turned into a different beast. It has completely detached itself from the rest of crypto for the most part, but the first expansion is coming in 2026. If the bar pattern does not deviate, then greatness lies ahead.

Btc is STILL following this Eth fractalIf Btc continues to follow this Eth fractal, one might anticipate a Btc bottom no less than 102K.
What are your thoughts?
May the trends be with you.

BTCUSDT: Short Setup Active Below $110,700Hello everyone, here is my breakdown of the current Bitcoin setup.
Market Analysis
On the 1H timeframe, Bitcoin continues to move inside a descending channel, maintaining a clear bearish structure.
After multiple tests and breakouts, the price is still unable to break through the Resistance Area around $110,700, which remains a strong supply zone.
Recently, we saw a fake breakout, followed by a return below the resistance area — confirming that buyers are losing strength. Currently, the price is forming a range near the Support Zone ($104,500–$105,000), which indicates a short-term consolidation phase before a possible next move.
My Scenario & Strategy
I expect that after the range is broken to the downside, BTC will continue its decline toward the Support Zone ($104,500). If this level fails to hold, the next potential target will be the lower boundary of the descending channel around $102,300.
However, a breakout and close above $110,700 would invalidate the bearish scenario and could indicate a shift in market structure.
That's the setup I'm tracking. Thank you for your attention, and always manage your risk.

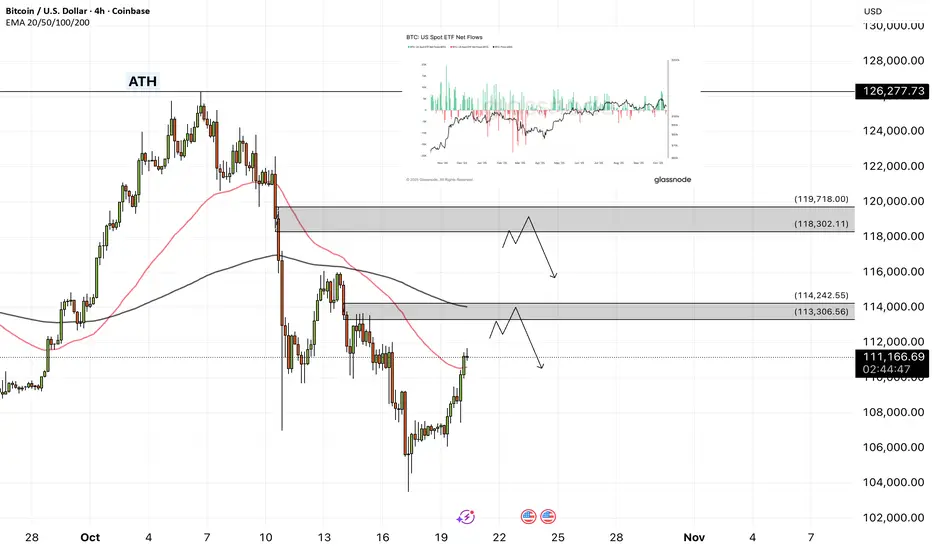
$255 Million Insider Buys BTC Demand Zone with 200SMA ConfluenceOn-chain data from HyperDash confirms that an insider with a 100% win rate has entered large long positions totaling $255 million in BTC and ETH. The entries occurred directly inside a strong daily demand zone between 103,623–108,000, supported by the 200SMA and lower channel trendline.
The chart highlights this setup clearly:
Demand Zone (Entry Area): 103,623
Partial Take-Profit Zone: 114,640–116,662 (supply zone and 20SMA resistance)
Major Take-Profit Zone: 122,969–126,272 (upper channel resistance and breakout range)
The timing couldn’t be more significant. The Federal Reserve has just confirmed its Payments Innovation Conference for October 21, 2025, featuring discussions on Bitcoin integration, stablecoin frameworks, and CBDC development. This announcement aligns closely with the insider’s massive long exposure visible on HyperDash.

BTC recovers, positive at the end of OctoberBTC Daily Analysis
Price recently swept liquidity below the key support zone around 108,000–106,000, forming a clear Liquidity Sweep Zone (LQ Sweep). This move indicates that the market collected stop-losses and liquidity from previous lows before showing a strong bullish reaction.
The recovery from this area suggests a potential short-term reversal as buyers step in to defend the lower trendline of the ascending channel. The confluence between the Liquidity Sweep Zone and the trendline support strengthens the probability of a bullish continuation.
In the coming sessions, if BTC maintains momentum above 110,000–111,000, the next upside targets will be:
First resistance: 115,500–116,000
Major resistance zone: 120,000–122,000
A clean break and retest of the 115,500 zone would likely confirm the continuation scenario toward the upper boundary of the channel near 125,000–126,000.
Summary:
Structure: Bullish reaction from key liquidity zone
Bias: Short-term bullish as long as 108,000 support holds
Targets: 115,500 → 122,000 → 126,000
Invalidation: A daily close below 106,000 would negate the bullish setup

BITCOIN Did the 1W MA50 save the Cycle again??Bitcoin (BTCUSD) has now completed two straight weeks since the Friday 10 flash-crash of almost touching the 1W MA50 (blue trend-line) but managing to hold it and rebound. This is not the first time we see this pattern during this Cycle. In fact it is a frequent one that systemically fuels the 3-year Channel Up of this Bull Cycle.
As you can see, ever since the November 21 2022 bottom of the previous Bear Cycle, the current Bull Cycle has been trading within this Channel Up pattern, which after it broke above the 1W MA50 and in March 2023, turned it into its long-term Support.
More specifically, since that day, every time BTC broke and closed a weekly candle below its 1W MA20 (red trend-line), it dropped further to its 1W MA50 to find Support, priced the Channel Up Higher Low and rebounded.
This has happened so far 3 times (excluding now), in September 2023 it almost touched the 1W MA50 and rebounded but in August 05 2024 and April 07 2025, it marginally breached it and then rebounded. Based on this, BTC is currently at or very close to the new Higher Low (Support), hence a buy opportunity.
The only condition that hasn't been fulfilled, is the 1W RSI entering its 2-year Support Zone. If the 1W MA50 indeed holds and manages to keep closing the 1W candles above it, that would be an indication that the Bull Cycle is still in effect. The minimum rally a pull-back has given throughout the Cycle has been +92.44%, so as long as it holds, there are strong probabilities that BTC may reach a least $143000.
Do you share that model's optimism or you think the new Bear Cycle has already started? Feel free to let us know in the comments section below!
-------------------------------------------------------------------------------
** Please LIKE 👍, FOLLOW ✅, SHARE 🙌 and COMMENT ✍ if you enjoy this idea! Also share your ideas and charts in the comments section below! This is best way to keep it relevant, support us, keep the content here free and allow the idea to reach as many people as possible. **
-------------------------------------------------------------------------------
💸💸💸💸💸💸
👇 👇 👇 👇 👇 👇

20/10/25 Weekly OutlookLast weeks high: $115,965.44
Last weeks low: $103,546.52
Midpoint: $109,755.98
Following the flash crash of two weeks ago, Bitcoin opted for the "fill the wick" pattern last week with a steady continuation of the downtrend printing a low for the week 1.5% shy of completely backfilling the entire wick.
Because of the aggressive nature of the immediate recovery, I would estimate that a large number of stop losses would be placed just under the bottom of the flash crash wick and so as price approached that level, buyers stepped in to move price away from that danger area. I am still not convinced that $98,000-102,000 area is safe from a revisit, but when is a question I do not have an answer for.
This week we've seen an early move by the bulls to flip a very important $108,000 level. I could see BTC conforming to the weeks range quite strongly as both extremities of the range as well as midpoint line up very well with HTF S/R levels. I think any PA between those levels would give clues as to the strength of both sides, bulls and bears but the important moves will happen around the extremes. Of course the trade war news is a factor still in play as well as CPI later in the week.
This CPI release is also taking place during a government shut down, it's the first CPI on a Friday since 2018 and FOMC (rate cut predicted) takes place just 5 days after with massively reduced data releases due to the Government shut down. This to me is a volatility storm waiting to happen and many participants are going into it blind.
Good luck this week everybody!

Bitcoin - Will Bitcoin also cross $100,000?!Bitcoin is located between EMA50 and EMA200 on the four-hour timeframe and is in its medium-term ascending channel. In case of an upward correction towards the specified supply range, it is possible to sell Bitcoin with a better risk-reward.
It should be noted that there is a possibility of heavy fluctuations and shadows due to the movement of whales in the market and compliance with capital management in the cryptocurrency market will be more important. If the downward trend continues, we can buy within the demand range.
Bitcoin’s recent rally has stalled under macroeconomic pressures, marking one of the most significant events in the asset’s history. With capital inflows into ETFs slowing and volatility spiking, the market has entered a recalibration phase—characterized by deleveraging, cautious investor sentiment, and a reliance on new demand to reignite the bullish trend.
This latest price decline is particularly concerning, as it marks the third time since late August that Bitcoin has fallen below roughly $117,000, a zone where most large holders are now underwater.
Following the largest liquidation cascade in Bitcoin’s history, capital inflows into U.S. spot ETFs have weakened alongside price declines. At the same time, the derivatives market has seen a sharp reduction in leverage, while ETF investors have shown mild selling pressure, resulting in a net outflow of about 2.3K BTC so far this week.
Unlike previous capitulation phases, where outflows typically accelerated price drops, the current slowdown reflects hesitation rather than panic. However, if weakness persists or ETF inflows take longer to recover, it could signal fragility on the demand side, undermining one of the core drivers behind Bitcoin’s past rallies.
During the recent liquidation wave, spot trading volumes surged to some of the highest levels of the year, reflecting intense market activity as traders rapidly adjusted their positions amid heightened volatility.
...دادهاند
In Q3 of this year, the number of publicly traded companies holding Bitcoin on their balance sheets hit a new record — despite ongoing market turbulence. According to data from Bitwise Asset Management, the number of listed firms with Bitcoin holdings grew by nearly 40% in just three months, reaching 172 companies.
Still, a recent October survey by Bank of America shows that 76% of investors currently hold no exposure to cryptocurrencies, up from 67% in September. Even among those with some allocation to digital assets, exposure remains minimal:
• 3% of investors hold only 2% of their portfolios in crypto.
• 1% allocate around 4% to cryptocurrencies.
• 3% have 8% or more of their portfolios invested in digital assets....
BTC 4H Analysis | Day 5🥳 Hey everyone! Hope you’re doing great! Welcome to SatoshiFrame channel .
✨ Today we’re diving into the 4-Hour Bitcoin analysis. Stay tuned and follow along!
👀 After breaking out of the descending channel and confirming the long setup I explained in the previous post, Bitcoin moved upward and easily broke through its Maker-buyer zone.
🔍 Over the past two market-holiday days, Bitcoin consolidated in a multi-timeframe accumulation phase with a ceiling at $107,356, which was easily breached. The price then advanced toward its higher-level key resistances. It’s now trading between $110,500 and $113,000 — the $113,000 zone is our long trigger since price has struggled there multiple times before. This makes it a bit risky, but if the upward movement continues, the next resistances could be at $115,800 and $120,836.
🧮 Looking at the RSI oscillator, it has comfortably passed the 50 level on the 4-hour chart and is now heading toward the overbought zone, facing a key resistance at 70. This 70 level overlaps with the 50 zone on the daily timeframe, meaning that if RSI enters overbought on the 4-hour, the daily will just be shifting from a bearish swing phase to a long-position momentum phase — so the 70 zone is crucial.
🕯 If you check the lower-volume section of the chart, you’ll notice something interesting: the breakout above the two-day accumulation range came with a clear rise in buy volume, which helped Bitcoin easily break both the resistance area and the descending trendline (the upper boundary of the previous channel). This suggests Bitcoin may soon take a volume or price correction to gain more strength for another upward move.
⏰ During today’s New York session, we might see some strong moves. Remember last week when U.S. investors were selling off their ETF holdings, and the market was hesitant to buy? That fear caused weak participation. This time, we may have a reason to stay active during New York hours as sentiment shifts.
🧠 Here are the two key scenarios to watch:
🟢 Long Position Scenario
Wait for Bitcoin to react either to the micro-buyer zone or to the $113,000 area. If we see a pullback followed by an indecision candle (confirmation setup) touching the SMA-7, that’s our entry cue — ideally with a tighter stop size.
🔴 Short Position Scenario
Ignore shorts for now. Bitcoin already completed its second downward wave with an imbalanced slope, and over the last two days, seller momentum has weakened. Buyers are now driving price through resistance levels, so shorting here would go against the current flow.
❤️ Disclaimer : This analysis is purely based on my personal opinion and I only trade if the stated triggers are activated .

BTC - NEED MORE CONFIDENCEMorning folks,
So after our Thu conversation BTC has collapsed to ~ 105K. So, our suggestion has been confirmed, although we have not planned any traders.
Now it is trying to show the bounce. This is great news, but somehow I do not want to hurry up with long entry, and prefer to get more confirmation.
For example, if we would get this reverse H&S pattern - this will be at least something.

BTCUSD – Three Drives Pattern + RSI DivergenceHi Teams!
Bitcoin has recently completed a three-drive pattern while also showing a clear bearish divergence on the RSI. This confluence has led to a strong rejection from the third drive area, confirming short-term weakness.
The three-drive trendline was broken last night, signaling that the bullish momentum has temporarily cooled down. However, as long as $97,900 remains unbroken, the bullish structure can still hold.
Here’s the current plan:
Key support zone: $108,600; this looks like a good potential long entry area if the price stabilizes and shows confirmation.
Upside target: around $118,045, which also aligns with the previous swing high.
Invalidation: if the price breaks below $97,900, the setup turns bearish, and we can expect deeper retracements toward the $86,500–$88,000 region.
In short, BTC is at a critical decision point, holding above $97,900 keeps the bullish structure intact, but a breakdown below that level could shift the market sentiment sharply bearish.
Disclaimer: As part of ThinkMarkets’ Influencer Program, I am sponsored to share and publish their charts in my analysis.

Bitcoin Price Outlook: Testing the $97,800 Support ZoneHi there!
Let's analyze Btc!
Bitcoin is currently moving inside a clear descending channel, showing consistent lower highs and lower lows. The price is likely to continue its downward movement until it reaches the daily support area around $97,800.
This zone appears to be a promising area for long-term opportunities. Still, traders should wait for strong confirmation signals before entering, as a reversal will only be valid once momentum shifts from bearish to bullish.

The Bitcoin bearish era has begun (1D)First of all, you should know that in our previous analyses, we had identified a large triangle. However, the market makers created another bullish wave, increasing the chart’s error margin (The scenario you see in the related ideas section.).
This sharp move indicates the beginning of new bearish branches! It is expected that with a pullback to the red zone, the correction will continue, and we will be involved in it for at least a few months.
Closing a daily candle above the invalidation level will invalidate this analysis.
For risk management, please don't forget stop loss and capital management
When we reach the first target, save some profit and then change the stop to entry
Comment if you have any questions
Thank You

Bitcoin the BOTTOMBitcoin has bottomed (IMO) at $106K, the 2024 top and 61.8% Fibonacci level, and is now rising for the final leg up.

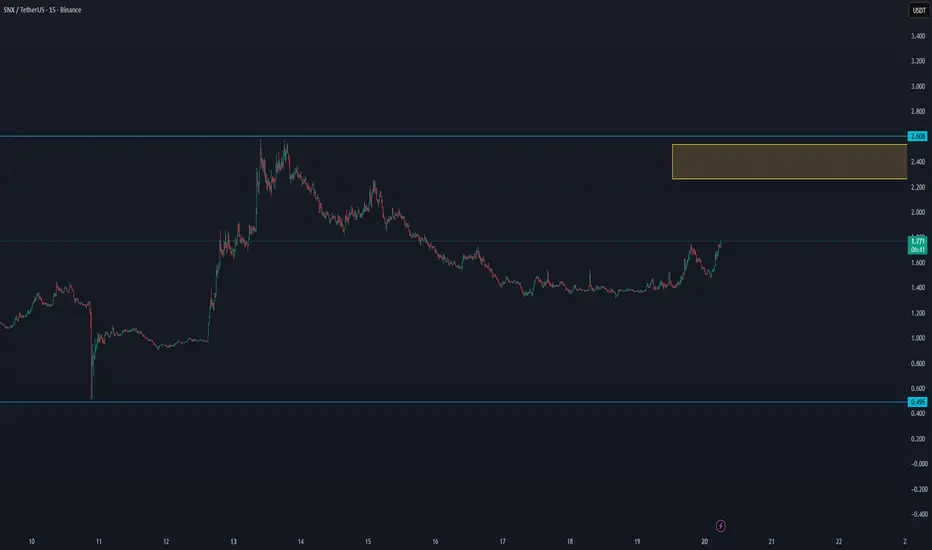
SNX/USDT INCREASE VOLUME On the lower time frames, SNX is showing signs of increasing volume, which could build up over time. For this reason, it’s worth watching SNX closely to see if the trend can break.