CETUS — DESCENDING TRENDLINE: BREAKOUT OR CONTINUED DOWNTREND?📊 Technical Analysis — $CETUS/USDT
⏱️ Time Frame: 3D
🏦 Exchange: OKX
📐 Pattern: Descending Trendline / Long-Term Downtrend
💰 Current Price: around $0.02178
━━━━━━━━━━━━━━━━━━
📉 🔻 DESCENDING TRENDLINE PATTERN
CETUS/USDT continues to trade below the Descending Trendline that has formed since the major high around $0.49.
The yellow trendline represents a consistent structure of Lower Highs (LH). Previous rallies have repeatedly faced rejection when approaching this trendline.
📌 This indicates
CETUSUSD
CETUS/USDT – Descending Trendline: Reversal or Fakeout?On the 2D timeframe, CETUS/USDT is still in a medium–long term downtrend structure, clearly shown by a series of lower highs and lower lows. Price is currently testing a dynamic resistance (descending trendline) that has been holding since the previous peak.
There are also key horizontal levels acting as reaction zones:
0.0290 → Key resistance (red line)
0.0333 – 0.0440 – 0.0550 – 0.0815 → Layered target zones
0.0139 → Major support (previous low)
---
📉 Pattern Formation: Descending Tria
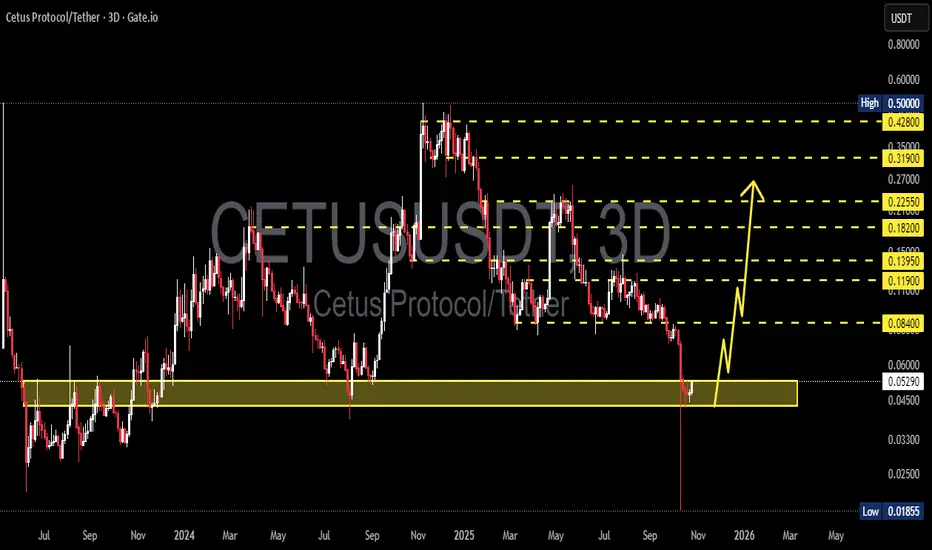
CETUSUSDT — Major Rebound or Deeper Breakdown?CETUS is now testing a critical support zone between 0.0528 and 0.043, a level that has historically acted as a major demand base since 2023. The latest 3D candle shows a massive liquidity wick down to 0.0185, followed by a sharp rebound — a strong signal of a potential bear-trap or early accumulation phase forming at the bottom.
The broader trend remains bearish, with a sequence of lower highs since the 2025 peak. However, this recent recovery suggests that buyers are trying to defend the last
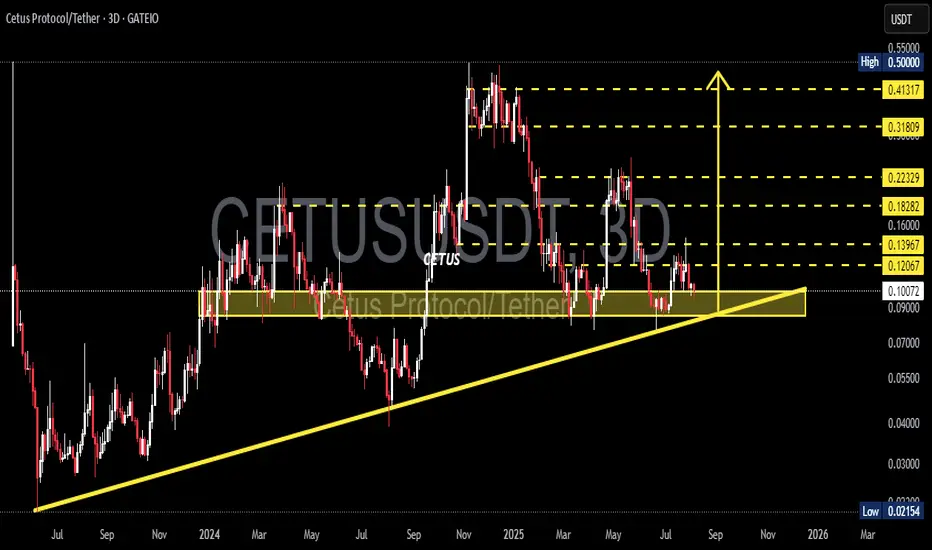
CETUS/USDT 3D — Awaiting a Major Decision at Key Support ZoneCetus Protocol (CETUS) is currently at a highly critical phase, trading just above a strong historical support zone that has repeatedly acted as a key price floor. The chart reveals a tight technical formation, signaling a potential for a significant move in the near term.
---
🔍 Technical Analysis:
Key Support Zone: $0.09000 – $0.10084
Price is currently testing a major demand area that has historically prevented deeper drops since mid-2023.
Ascending Trendline:
A medium-term trendline from
CETUS: The Smart Investment for Short-Term Growth! (12H)Since we placed the red arrow on the chart, the CETUS correction has begun.
It seems to be a double correction, with two diametric patterns—one butterfly and one diamon. connected together.
Currently, we appear to be in wave f of the diamond diametric. Once the correction completes and reaches the green zone, wave g could finish.
We’ll need to see if after wave g, we have wave x, wave h, or a post-pattern movement!
The targets are marked on the chart. A daily candle close below the invalidat
I expect CETUS to continue rising to $0.15.Hello everyone!
Today, I want to continue with the idea about CETUS. The asset successfully reached the 0.382 Fibonacci level, bringing in a 58% profit. Now, we can expect a continuation of the upward movement towards the final target at the 0.618 Fibonacci level, resulting in a total profit of 109%.
I consider it advantageous to enter a position after breaking and holding above the 0.382 Fibonacci level, with subsequent profit-taking at $0.092 (+28%) and $0.115 (+60%).
This is not financial
Cetus Protocol has good investment potential.Cetus Protocol. A new project positioning itself as a DEX to provide liquidity for the SUI and APTOS blockchains.
It was listed on major exchanges in May of this year.
For me, the project is an investment opportunity.
As for trading, I suggest looking at the chart. Currently, a local uptrend support line and a strong resistance level around $0.045 or 0.236 on the Fibonacci scale have formed on the chart.
If this level is broken and sustained above it, I expect the continuation of the uptrend