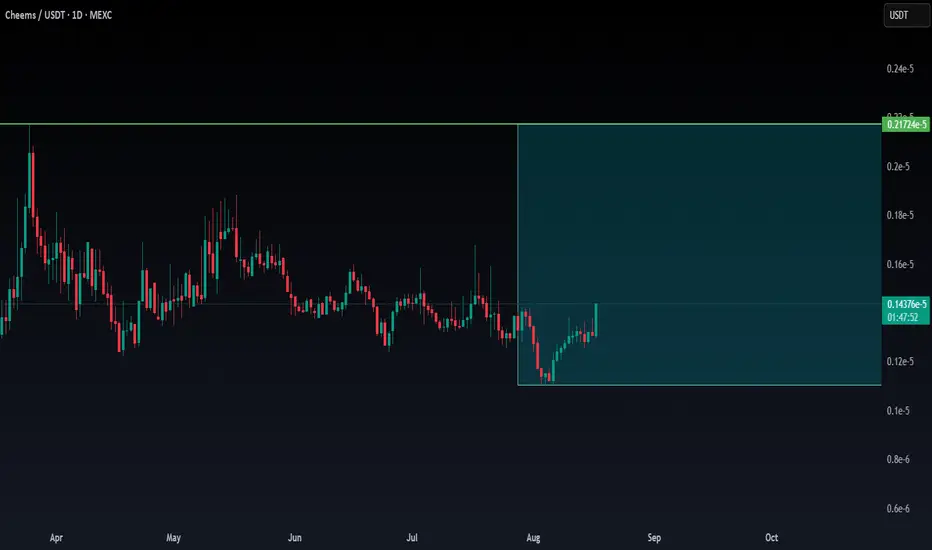
CHEEMS:USDT NEW INCREASE TRENDDepend on last trend, high chance Cheems will see new increase volume in the coming time frames.Longby RENKDATAUpdated 1
Cheems Trending: Preparing for the Next Wave Up with Strong LiquCHEEMS is trending again, and we could be setting up for another leg up. Liquidity continues to build above, making this setup similar to successful plays in the past. While history is never certain, disciplined risk management remains key to turning any trade into something special. Risk Management: Protect your position—don’t rush in without a defined stop loss. Monitor volatility and sentiment indicators; current conditions warrant a flexible but cautious approach. Profit Target: Set take p1Longby minno910
CHEEMS_USDT Can this coin make it on low time frame?Cheems seems to have interesting level confirmation. What could be confirmed in the coming hours? For this reason, follow this day trade option to see the possibility. In case there is a confirmation, the update will get a follow-up. Longby SatochiTrader4
CHEEMS ANALYSIS (1D)The correction of this asset has started from the point we marked as "start" on the chart. It appears to be an ABC correction or a more complex pattern. It seems that this correction is forming a Flat, and we are currently in wave B of this Flat. Wave B itself is a Diametric, and we are now in wave e of it. The expected price action of this coin is illustrated on the chart. The closure of a daily candle above the invalidation level will invalidate this analysis. For risk management, please by behdark5
1000CHEEMSUSDT – 2500% Volume Surge!1000CHEEMSUSDT – 2500% Volume Surge! Watching the Blue Boxes Closely “A 2500% volume increase is NOT a joke—something BIG is happening! But smart entries matter.” 🔥 Key Insights: ✅ Massive Volume Surge – This is where real moves start. ✅ Two Strong Support Zones Marked (Blue Boxes) – These are the ideal reaction points. ✅ Patience = Profit – Jumping in blindly is how people get wrecked. Wait for confirmation! 💡 The Smart Plan: Watch for LTF Market Structure Breaks at Blue Boxes – A reac1Longby UmutTrades5
Cheems Token ($CHEEMS): Set for Breakout Amid Bullish IndicatorCheems Token ($CHEEMS), the dog-themed memecoin built on the Binance Smart Chain, has captured the attention of crypto enthusiasts and traders alike. Boasting a vibrant community across platforms like X and Telegram, and a market cap exceeding $211 million, $CHEEMS is showing strong signs of a potential breakout. Let’s delve into the technical and fundamental aspects driving this momentum. Technical Analysis The daily price chart of $CHEEMS reveals a symmetrical triangle pattern, often considerCLongby DEXWireNews3
CHEEMS - LONG - Swing Trading*This is a re-entry from my last idea but for swing trading (see related publications). Cheems is in an good entry, with a great support. T1: 0.00000090 T2: 0.00000095 T3: 0.0000011Longby leonardobarriosr69Updated 3
CHEEMS - LONG - 4 hour timeframe tradingCheems is in an extraordinary entry, with good support. High risk, fast and high profit trade. Be careful. T1: 0.00000090 T2: 0.00000095Longby leonardobarriosr69Updated 3
Cheems - 1 hour timeframe tradingRisky Trade - protect as soon as possible. 1 hour time frame. Resistance in 0.00000098 (TP 1). Close trade when it's around that price or take partial and protect in breakeven.Longby leonardobarriosr69Updated 1
 LongLongLongLongLongLong