COTI — Long-Term Trendline Breakout & Critical Reclaim Zone!📊 Technical Analysis — ECONOMICS:COTI
⏱ Time Frame: 4D
📌 Pattern: Descending Trendline Breakout + Reclaim/Accumulation Zone
🟨 Key Zone: 0.0152 – 0.0125
---
📐 PATTERN — DESCENDING TRENDLINE
📉 COTI has previously been trading within a long-term downtrend, characterized by a series of lower highs and persistent selling pressure.
🔻 The yellow descending trendline has acted as dynamic resistance throughout the decline. As long as price remained below this trendline, bearish pressure remained t
Cotilong
COTI Faces Its Biggest Resistance — Breakout or Rejection?📊 Technical Analysis — COTI/USDT
COTI is currently at a critical area on the 4D timeframe, after experiencing a prolonged downtrend from the peak around $0.19. The price structure has formed a series of Lower Highs (LH) and Lower Lows (LL) connected by the yellow Descending Trendline.
However, after reaching a low around $0.00717, the price has started showing a strong recovery and is now approaching the descending trendline again.
🔥 This is a very important area: if the trendline is successf
#COTIUSDT Ready to go higher#COTI
The price is moving within a descending channel on the 1-hour timeframe and has reached the lower boundary. It is now poised for a bounce and is expected to retest this boundary.
The Relative Strength Index (RSI) indicates a downward trend, which is likely to continue given the overbought conditions.
A key support zone has been identified in green at 0.00800. The price has bounced off this zone several times, making it a strong support level.
The price is trending towards the 100-perio
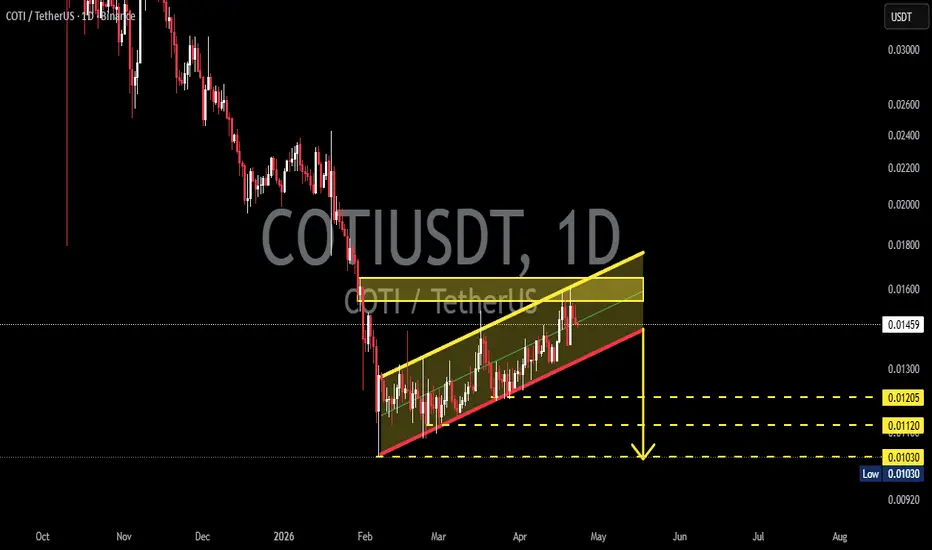
COTI/USDT — Bear Flag: Potential Continuation to the Downside?On the 1D timeframe, COTI/USDT is still within a larger downtrend structure since its peak. After a sharp decline (flagpole), price is now moving upward gradually in a consolidation phase, forming a Bear Flag pattern.
The current structure shows:
A slow and weak upward movement (flag)
Formed within a small ascending channel (yellow zone)
Still unable to break strong resistance
Price is currently positioned near the upper boundary of the flag, approaching resistance.
---
📐 Pattern Identi
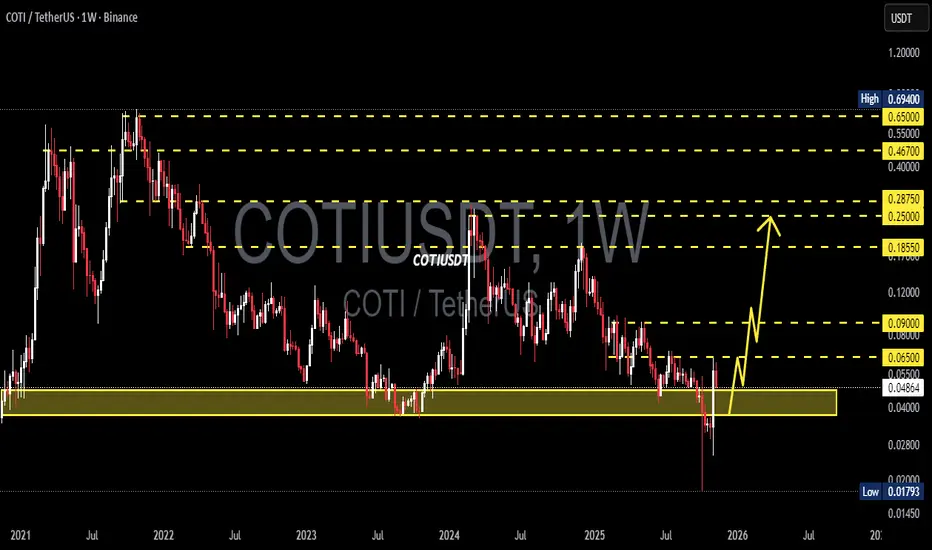
COTI/USDT - Smart Money Accumulation or Just a Dead Cat Bounce?After a sharp decline reaching an extreme low around $0.017, COTI has bounced strongly and managed to close back above the key demand zone at $0.047–$0.037.
This yellow zone isn’t just any level — it represents the last stronghold of buyers, a crucial area that has repeatedly held the price since 2021.
Looking closer, the latest weekly candle shows a deep liquidity sweep followed by a massive rejection — a classic sign that big players might have “cleared out stops” and begun stealth accumulati
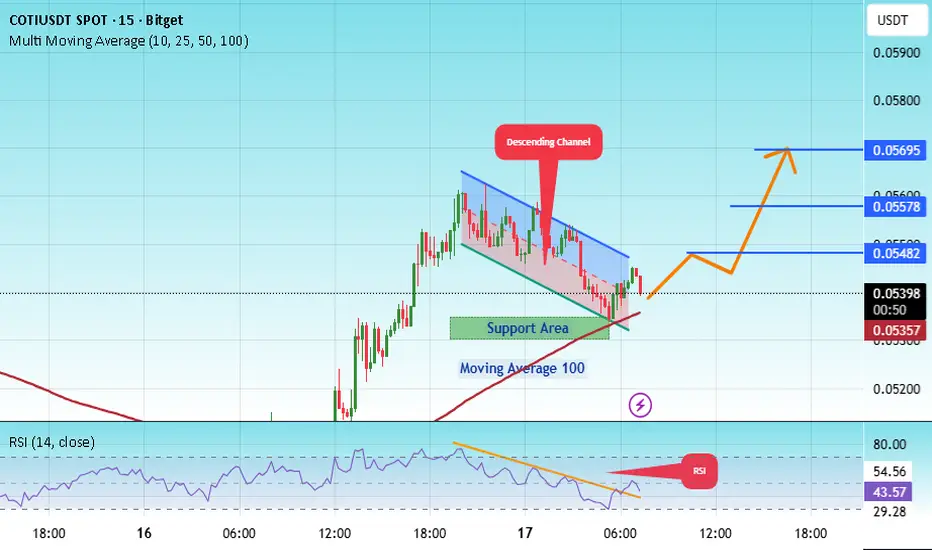
#COTI/USDT - Bottomed out!#COTI
The price is moving within a descending channel on the 1-hour frame, adhering well to it, and is heading for a strong breakout and retest.
We have a bearish trend on the RSI indicator that is about to be broken and retested, which supports the upward breakout.
There is a major support area in green at 0.05325, representing a strong support point.
We are heading for consolidation above the 100 moving average.
Entry price: 0.05390
First target: 0.05480
Second target: 0.05580
Third targe
COTIUSDT UPDATE#COTI
UPDATE
COTI Technical Setup
Pattern : Bullish Falling Wedge pattern
Current Price: $0.05039
Target Price: $0.065
Target % Gain: 30.55%
Technical Analysis: COTI has broken out of a falling wedge on the 4H chart with bullish momentum. The breakout shows strength and suggests continuation toward $0.065, with confirmation supported by price action and breakout retest.
Time Frame: 4H
Risk Management Tip: Always use proper risk management.
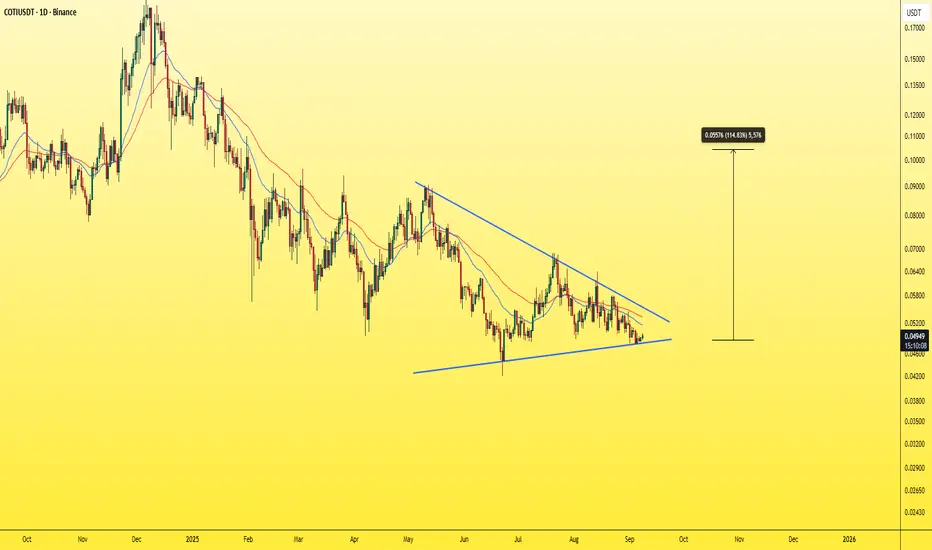
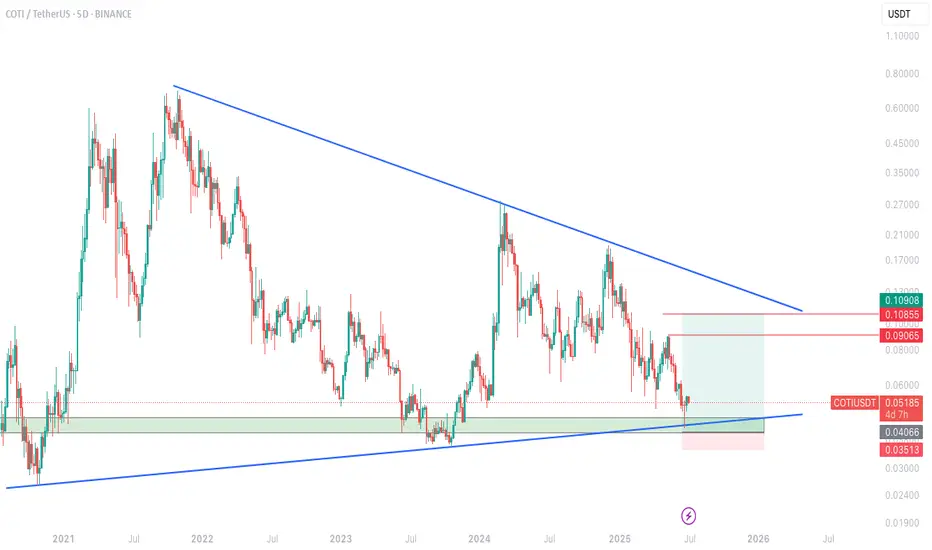
COTIUSDT - Bottomed out!Many coins have already reached bottom levels, and one of the strongest among them is COTI.
It has formed a symmetrical triangle pattern and is now sitting at one of its lowest levels, which is a strong support zone — buying here is almost like getting it at “nothing.”
COTI is currently gearing up for a historical rally expected to take place in Q4 2025.
Best Regards:
Ceciliones🎯
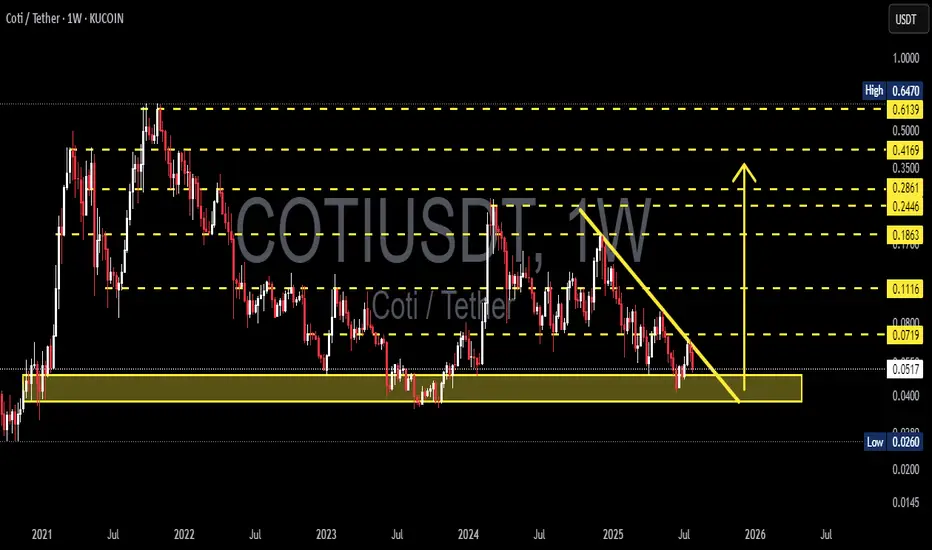
COTIUSDT Weekly Analysis Potential Reversal?📍 Current Price Position – On Top of Historical Support!
The COTI/USDT pair is currently testing a crucial support zone between $0.0400 – $0.0517, which has been a key demand zone since early 2021. This isn't just any support — it's a macro psychological area that has repeatedly triggered strong reversals in the past.
We are at a make-or-break level, where the next move could define the mid-term trend.
---
🧩 Price Structure and Pattern
📐 The chart shows a descending triangle pattern with:
COTI/USDT – Approaching Make-or-Break Zone | Multi-Leg Reversal📌 Overview:
COTI is currently at a critical inflection point in its long-term structure. After a prolonged distribution phase since 2021 and a steady decline throughout 2023–2025, price action is now testing a historical support zone that has repeatedly triggered strong reversals. This area could be the foundation of a macro bottom formation—or the gateway to further downside if broken.
🔍 Technical Breakdown & Key Price Zones:
🟨 Major Demand Zone (Support Block):
Range: $0.030 – $0.048
This
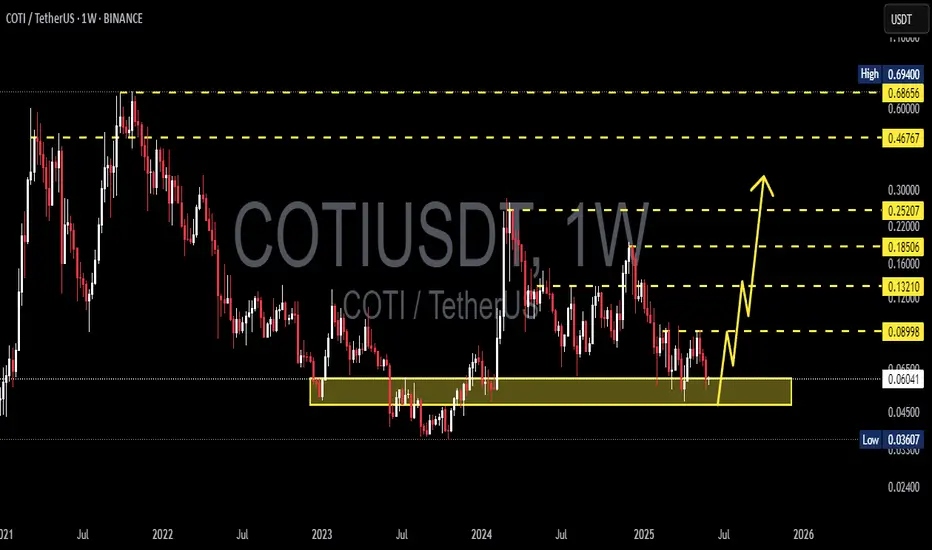
COTI/USDT Weekly Analysis – Potential Macro Reversal in PlayThe chart displays a long-term downtrend structure for COTI/USDT, yet a significant accumulation zone is forming around the $0.036–$0.045 range (highlighted in yellow). This area has acted as a key support level multiple times since 2021, suggesting strong demand and a potential bottoming pattern.
🔍 Key Observations:
Macro Support Zone:
Price is currently trading within a strong historical support zone between $0.03607 (multi-year low) and $0.04500, where buyers have consistently stepped in ov
#COTI/USDT#COTI
The price is moving within a descending channel on the 1-hour frame, adhering well to it, and is on its way to breaking it strongly upwards and retesting it.
We are seeing a rebound from the lower boundary of the descending channel, which is support at 0.06870.
We have a downtrend on the RSI indicator that is about to break and retest, supporting the upward trend.
We are looking for stability above the 100 Moving Average.
Entry price: 0.06870
First target: 0.07471
Second target: 0.0979
#COTI/USDT#COTI
The price is moving in a descending channel on the 1-hour frame and is expected to continue upwards
We have a trend to stabilize above the moving average 100 again
We have a descending trend on the RSI indicator that supports the rise by breaking it upwards
We have a support area at the lower limit of the channel at a price of 0.07800
Entry price 0.08236
First target 0.08376
Second target 0.08576
Third target 0.08878
#COTI/USDT#COTI
The price is moving in a descending channel on the 1-hour frame and is adhering to it well and is heading to break it strongly upwards and retest it
We have a bounce from the lower limit of the descending channel, this support is at a price of 0.08530
We have a downtrend on the RSI indicator that is about to break and retest, which supports the rise
We have a trend to stabilize above the moving average 100
Entry price 0.08863
First target 0.09110
Second target 0.09362
Third target 0.0
#COTI/USDT Ready to take off upwards#COTI
The price is moving in a descending channel on the 1-hour frame and is adhering to it well and is heading to break it strongly upwards
We have a bounce from the lower limit of the descending channel, this support is at a price of 0.06000
We have a downtrend on the RSI indicator that is about to be broken, which supports the rise
We have a trend to stabilize above the moving average 100
Entry price 0.08850
First target 0.1020
Second target 0.10810
Third target 0.1147
#COTI/USDT Ready to go higher#COTI
The price is moving in a descending channel on the 1-hour frame and sticking to it well
We have a bounce from the lower limit of the descending channel, this support is at 0.1150
We have a downtrend on the RSI indicator that is about to be broken, which supports the rise
We have a trend to stabilize above the moving average 100
Entry price 0.1225
First target 0.1304
Second target 0.1390
Third target 0.1483
COTI Textbook Macro Accumulation Entering MarkupCOTI has a beautiful textbook accumulation finishing up here, it's about to enter the markup phase. Altcoin season is starting and this is going to be one of the big winners this cycle! I have targets all the way up to $0.98 based on the fib extensions for wave 5 - this impulsive structure is following all of the rules so far. Wave 4 bounced right at the top of Wave 1 just like it's supposed to.
CLong
#COTI#COTI is in a good position and is ready for a big rally.
The price has started to grow from the support level of $0.090 - $0.1030 . But this is still the beginning of its ascent path. Big profits can be made from it.
The price is now almost at the bottom and is compressed for a move and at least 100% growth.
The momentum is strong , and the trend seems very upward.
COTI coin is setting up for upto 20% pumpHi dear friends, hope you are well and welcome to another new trade setup of COTI coin.
Previously we caught almost 17% pump as below:
Now on a daily time frame, COTI with BTc pair is about to complete a bullish Gartley move for the next pump.
Note: Above idea is for educational purpose only. It is advised to diversify and strictly follow the stop loss, and don't get stuck with trade.
CLong