AUDCAD ANALYSISAUDCAD is in downtrend
Price rejected from key level at 0.9425
Below HVN at level 0.9541
Below SMA 100
MACD shows bearish momentum
RSI is below level 50
It's expected forming bearish Elliot wave (5) to target level 0.9150
Crosses

CADCHF ANALYSISCADCHF is rejected with strong bullish movement at level 0.6818 after forming harmonic pattern AB = CD
Price is trading in down channel
Pair is based above key level at 0.6860
MACD shows bullish momentum
We r waiting price to exceed next resistance level at 0.6879 and also break upper edge of down channel to open long trade
It's expected to target downtrendline near level 0.6950

GBPCAD ANALYSISGBPCAD retested broken downtrendline
Price is based above support level at 1.7144
Above SMA 100
Above HVN at level 1.7070
MACD shows weakness in bearish momentum
RSI is above level 50
We r waiting price to exceed key level to open long trade
It's expected for coming bullish movement to target resistance level at 1.7550

AUDCAD ANALYSISAUDCAD is trading in down price channel
Price rejected from key level corresponding to 38.2% Fibonacci level at 0.9390
Below SMA 100
Below HVN at level 0.9540
It's expected forming bearish Elliot wave (5) to target lower edge of price channel at level 0.9150

NZDCAD ANALYSISNZDCAD ended Bearish Elliot wave (5)
Price rebounded from demand zone at level 0.8620 with strong bullish movement
Above SMA 100
It's expected to retest upper edge of falling wedge pattern at level 0.8710
then going up towards HVN at level 0.8828
then finally target supply zone at level 0.8940

EURNZD ANALYSISEURNZD rebounded from upper limit of broadening pattern with strong bearish movement
Price is based below resistance level at 1.7964
MACD shows bearish momentum
RSI is below level 50
It's expected the continuation of bearish momentum to target first HVN at level 1.7740
then finally target lower edge of broadening pattern at level 1.7520

NZDCHF ANALYSISNZDCHF is in downtrend
Pair broke lower edge of up-channel pattern with strong bearish movement
Price is based below resistance level at 0.6074
Below HVN at level 0.6100
Below SMA 100
MACD shows bearish momentum
It's expected forming bearish Elliot wave (5) to target level 0.5850

CHFJPY ANALYSISCHFJPY retested major downtrendline
Price is based on support level at 115.69
Above SMA 100
MACD shows weakness in bearish momentum
It's expected for coming bullish movement to target first HVN at level 116.72
then finally target supply zone at level 117.80

EURNZD ANALYSISEURNZD broke uptrendline
Price is based below HVN at level 1.7740 which indicates that pair is in distribution phase
Pair is based below key level at 1.7714
Below SMA 100
MACD shows start of bearish momentum
It's expected for coming bearish movement to target demand zone at level 1.7450

EURJPY ANALYSISEURJPY retested broken downtrendline
Price is supported above key level at 1240.40
Above SMA 100
RSI is based on level 50
It's expected for coming bullish movement to target first HVN at level 125.42
then finally target resistance level at 126.50

GBPJPY ANALYSISGBPJPY broke major downtrendline
Price respects uptrendline
Price is based above HVN at level 135.80 which indicates that pair is in accumulation phase
Above SMA 100
MACD shows weakness in bearish momentum
It's expected going up towards resistance levels respectively 138.20, 140.35

CADCHF ANALYSISCADCHF is in downtrend after breaking up-channel pattern
Strong bearish wave (a) ended at level 0.6860
then corrective bullish wave (b) rejected with strong bearish movement at level 0.6948
Price is based below resistance level at 0.6918
Based below HVN at level 0.6905 which indicates that pair is in distribution phase
Below SMA 100
MACD shows bearish momentum
RSI is below level 50
It's expected forming bearish wave (c) to target support level at 0.6815

GBPNZD ANALYSISGBPNZD broke major downtrendline
Price is supported above support level at 1.9108
Above SMA 100
MACD shows bullish momentum
RSI is above level 50
It's expected for coming bullish wave to retest key level at 1.9630 which corresponds to 50% Fibonacci level

NZDCAD ANALYSISNZDCAD broke major uptrendline
Price broke neckline of Head & Shoulders pattern
Below SMA 100
MACD shows bearish momentum
It's expected for coming strong bearish wave to target support levels respectively 0.8744, 0.8650

GBPNZD ANALYSISGBPNZD rebounded from key level at 1.9120 with strong bullish movement
Price is based above HVN at level 1.9196 which indicates that pair is in accumulation phase
RSI is in uptrend
It's expected for coming bullish momentum to retest major downtrendline near level 1.9400

AUDCHF ANALYSISAUDCHF is supported above key level at 0.6600
Price rejected from 50% Fibonacci level with bullish movement
Above SMA 100
MACD shows bullish momentum
RSI is above RSI
It's expected the continuation of bulls power to target first supply zone at level 0.6710
then finally target next resistance level at 0.6800

AUDCHF ANALYSISAUDCHF broke uptrendline
Pair is based below resistance level at 0.6640
Price is based below HVN at level 0.6614 which indicates that pair is in distribution phase
Below SMA 100
MACD shows bearish momentum
we r waiting price to break support level at 0.6597 to open short trade
It's expected for coming bearish movement to target demand zone at level 0.6506

CADCHF ANALYSISPair broke uptrendline
Price is based below resistance level at 0.6914
Price is based below HVN at level 0.6905 which indicates that pair is in distribution phase
Below SMA 100
We r waiting price to break support level (1) at 0.6884 to open short trade
It's expected for coming bearish movement to target first support level (2) at 0.6815
then finally target demand zone at level 0.6747

CADJPY ANALYSISCADJPY broke uptrendline
Price is based below supply zone at level 81.45
Below SMA 100
MACD shows bearish momentum
RSI is in downtrend
It's expected the continuation of bears power to target HVN at level 80.22

GBPJPY ANALYSISGBPJPY broke minor uptrendline
Pair is based below resistance level at 141.95
MACD shows bearish momentum
It's expected for coming bearish movement to retest major uptrendline and support level (1) at 139.80

GBPNZD ANALYSISGBPNZD completed bearish elliot wave (5)
MACD shows weakness in bearish momentum
RSI shows positive divergence
we r waiting price to close above key level at 1.9760 to open long trade
It's expected for coming bullish movement to target HVN at level 2.0055

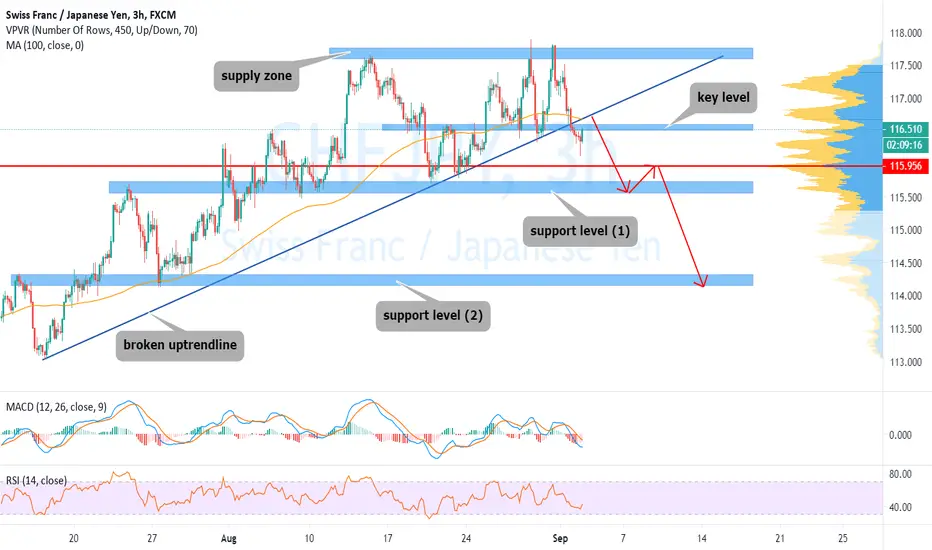
CHFJPY ANALYSISCHFJPY broke uptrendline
Pair is based below key level at 116.55
Below SMA 100
RSI is below level 50
It's expected for coming pullback to retest broken uptrendline
than bearish movement will be occurred to first target support level (1) at 115.60
and finally target support level (2) at 114.30
NZDCAD ANALYSISNZDCAD broke major downtrendline
Above SMA 100
RSI is above level 50
It's expected for coming correction to retest key level at 0.8744 which corresponds to 61.8% Fibonacci level
then continue going upwards to target first HVN at level 0.8898
then finally target supply zone at level 0.9000
