Recovery Speed MattersHow much price recovers after a decline matters, but how quickly it happens can reveal something that the percentage alone cannot.
Suppose CRYPTOCAP:BTC falls from $80,000 to $72,000 over ten days.
In one scenario, price needs another ten days to recover back toward $80,000. The recovery is constructive, but buyers needed roughly the same amount of time to undo the damage that sellers created.
Now imagine CRYPTOCAP:BTC suffers the same decline over ten days but recovers to $80,000 in only
Cryptoproptrading
What’s Behind a New HighA new high looks bullish, but the number of assets participating in the move can tell you much more about its quality.
Consider an index reaching a record high. If 70–80% of its components are also advancing, many sectors and individual stocks are contributing to the move. Demand is distributed across the market rather than concentrated in a few names.
Now imagine the index reaches another record several weeks later, but only 40% of its components are advancing. A handful of heavily weighted s
When Sideways Markets Are ChangingA market can spend weeks around the same price and still change significantly underneath the surface. The mistake is assuming that because price is flat, buyers and sellers are doing nothing.
Sometimes the opposite is happening.
Suppose CRYPTOCAP:BTC trades between $78,000 and $80,000 for two weeks. At first, both boundaries produce similar reactions. Price reaches $80,000 and sellers push it back toward the middle, while declines toward $78,000 attract buyers.
The range appears balanced.
Use Yesterday’s Range to Read Today’s MarketThe previous day’s high and low give intraday traders a simple reference for answering an important question: is today’s market still trading inside yesterday’s accepted territory, or is it successfully establishing business somewhere new?
That distinction can completely change how an intraday move should be interpreted.
Suppose CRYPTOCAP:BTC traded between $78,000 and $80,000 yesterday. Today it rallies from $79,200 to $79,800 in less than an hour. On a five-minute chart, that can look like
When Market Behavior ChangesMarkets develop short-term habits. During a strong trend, pullbacks may remain shallow, buyers may respond quickly near recent lows, and every recovery may reach a new high without requiring much time.
Those habits create a baseline. When they begin changing, traders can sometimes see deterioration before the larger structure actually breaks.
Suppose CRYPTOCAP:BTC has been trending higher for several weeks. Most corrections have been around 2–3%, lasted less than a day, and recovered quickly
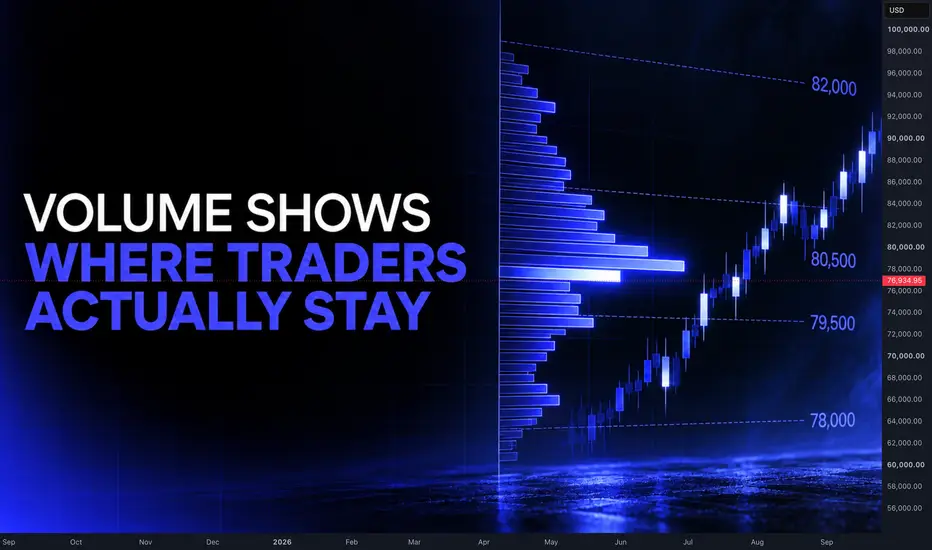
Where Volume Traded Can Matter More Than WhenMost traders read volume vertically. They see a large volume bar and know that significant activity occurred during that candle, but that still leaves an important question unanswered: where did that trading actually take place?
Volume at price gives a different view of market structure because it separates areas where participants repeatedly accepted price from areas the market moved through quickly.
Imagine CRYPTOCAP:BTC trades between $78,000 and $82,000 for several days, but most of the
When the Market Fails to Do What It ShouldSome of the best information in trading comes from a simple question: what should price have done here?
Imagine CRYPTOCAP:BTC breaks above a well-defined resistance level after several failed attempts. Volume expands, the breakout candle closes strongly, and the broader market is also moving higher. These are conditions where buyers should have an advantage.
But then nothing happens.
Price stops advancing, every attempt to extend higher is quickly sold, and within several candles CRYPTOCAP
The Market Rarely Changes Character OvernightTraders often search for the exact candle that marked the beginning of a new trend or the precise moment when bullish conditions became bearish. Looking back at historical charts, it is tempting to believe those transitions happened suddenly.
Real-time markets feel very different.
Before a genuine change becomes obvious, subtle characteristics usually begin shifting one after another. The market may still continue making new highs, but pullbacks become less orderly. Recovery attempts begin takin
Every Market Has a Natural RhythmOne aspect of technical analysis that receives surprisingly little attention is rhythm. Most traders focus on direction, volatility, or support and resistance, while overlooking the fact that markets often develop their own pace of movement.
Some environments produce long, steady trends with orderly pullbacks. Others expand violently before spending weeks moving sideways. Certain assets regularly alternate between periods of activity and inactivity, while others maintain relatively stable behavi
A Trend Is Built One Swing at a TimeWhen traders look at historical charts, trends appear smooth and continuous. Price seems to travel effortlessly from one area to another, creating the illusion that the market always knew where it was going.
That is not how trends develop in real time.
Every trend is built through a series of individual decisions. Buyers push price higher, sellers attempt to regain control, buyers defend the pullback, and only then does another expansion occur. Each completed swing represents a small victory for
Precision Is Overrated in Technical AnalysisMany traders spend years trying to improve the precision of their entries. They search for the perfect support level, the exact Fibonacci ratio, or the ideal candlestick confirmation that will allow them to enter within a few points of the turning point.
The pursuit feels productive because precision appears professional.
In reality, markets rarely reward precision as much as they reward consistency.
Charts are not engineered systems where every reaction occurs at an exact price. They are the re
The Biggest Difference Between a Trade and an Investment Is TimePrice behaves differently depending on how much time participants are willing to give their idea.
This distinction is often ignored because traders and investors may be looking at the exact same chart while reaching completely different conclusions. One participant sees a short-term correction that should be sold. Another sees a healthy pullback inside a multi-year uptrend. Both interpretations can be correct because they exist on different time horizons.
Problems begin when those horizons becom
Every Chart Has an Expiration DateOne of the easiest assumptions to make in technical analysis is that a chart remains equally relevant simply because price has not invalidated the larger trend. Traders often perform their analysis before the session begins, identify the levels they want to trade, and then spend the rest of the day looking for confirmation of that original idea.
The problem is that markets are constantly producing new information.
Every hour that passes changes the relationship between buyers and sellers. New po
Every Timeframe Tells a Different StoryOne of the easiest ways to become confused is to expect every timeframe to agree with your opinion.
A five-minute chart can look aggressively bullish while the four-hour chart remains in a correction. A daily chart may still be trending higher even though the hourly chart has been falling for two days. Neither chart is wrong.
They are simply describing different parts of the same auction.
Many traders treat conflicting timeframes as a problem that needs solving. In reality, the disagreement ofte
The Market Rarely Rewards the Obvious ConclusionOne of the easiest mistakes in trading is confusing a reasonable conclusion with a profitable opportunity.
A chart can look extremely bullish and still offer a poor long setup. A chart can look extremely bearish and still offer a poor short setup. The issue is not whether the conclusion is correct. The issue is whether the market has already priced that conclusion in.
This distinction becomes important after prolonged directional moves. The longer a trend continues, the easier it becomes to ex
Some Opportunities Improve By Being MissedMissing a move is one of the most frustrating experiences in trading.
The market moves exactly as expected, the analysis proves correct, and yet the trader never finds a way to participate. The natural reaction is regret. The assumption is that an opportunity was lost.
Sometimes that assumption is wrong.
Not every missed trade is a mistake.
Many missed opportunities reveal something valuable about the quality of the setup itself. If entering required chasing price, abandoning risk management, o
The Market Rewards Adaptation More Than ConvictionConviction is often celebrated in trading. Traders are encouraged to trust their analysis, commit to their ideas, and avoid being shaken out by temporary volatility.
While conviction has value, it becomes dangerous when it prevents adaptation.
Markets are constantly changing environments. Liquidity shifts, participation changes, volatility expands and contracts, and narratives evolve. A trade idea that made perfect sense yesterday may become significantly weaker today.
The challenge is recogniz
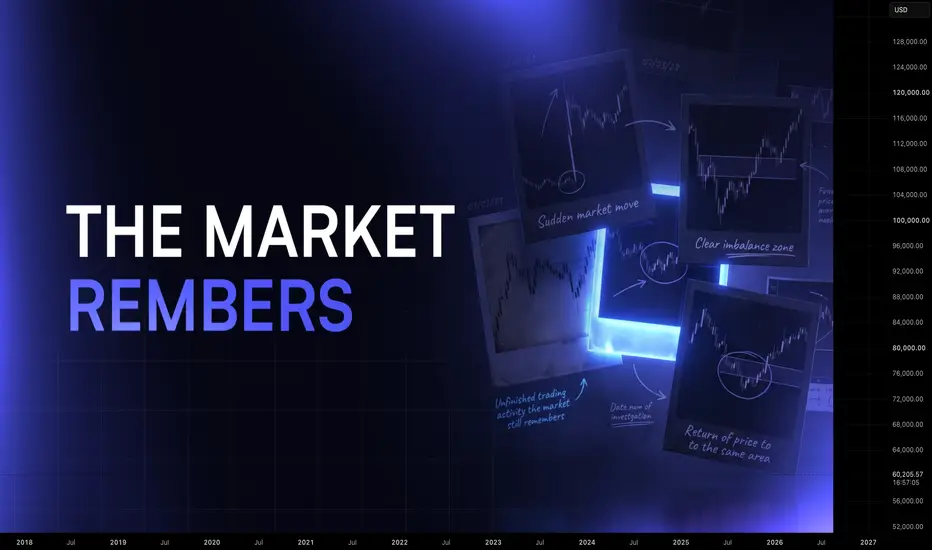
The Market Remembers Where It Became UnbalancedOne of the reasons certain areas on a chart continue attracting attention long after they were created is that markets have a tendency to revisit places where trading was incomplete.
Most traders focus on where price is currently trading. The market, however, often responds to where important transactions previously occurred.
When price moves slowly, buyers and sellers have time to interact. Orders are absorbed, positions are established, and value is gradually agreed upon. These areas tend to
Choppy Markets Drain More Traders Than CrashesMost traders fear aggressive market crashes because the danger is obvious. Volatility expands, movement accelerates, and losses can accumulate quickly. Risk becomes impossible to ignore, which naturally causes traders to become more defensive. Exposure is reduced, position sizing becomes smaller, and caution returns because the environment clearly feels dangerous.
Choppy market conditions create the opposite problem. Risk appears manageable because volatility is lower and price continues moving
Strong Candles Often Create Weak EntriesLarge candles attract attention because they create the impression that the market has become decisive. Momentum appears clear, direction feels obvious, and uncertainty suddenly disappears. For many traders, this is the moment when a trade finally feels safe enough to take. The problem is that emotional comfort and structural opportunity rarely arrive at the same time.
Before a large expansion candle appears, the market often looks far less convincing. Price may be consolidating, liquidity may
A Market Can Move Higher While Becoming WeakerOne of the easiest mistakes traders make during a strong trend is assuming that new highs automatically confirm a healthy market. As long as price continues moving upward, confidence remains high and attention stays focused on direction rather than the quality of the movement itself. The problem is that trends often begin weakening long before they actually reverse, and those changes rarely appear obvious when viewed through price alone.
A healthy trend tends to progress efficiently. Impulses c
The Role of Imbalance in Price MovementNot all areas of the chart are equal. Some zones show heavy interaction, while others show rapid movement with little resistance. These differences are not random. They reflect how orders were executed during the move.
When price moves slowly, buyers and sellers are matched efficiently. Each level sees participation, and the market progresses in a balanced way.
When price moves quickly, that balance disappears.
Aggressive buying or selling pushes the market through multiple price levels without
Why Price Moves Faster in One Direction Than the OtherMarkets rarely move symmetrically.
Up moves and down moves often behave differently in speed, structure, and volatility. Traders who treat both directions equally often misread timing and risk.
The reason lies in how positions are built and unwound.
Upward movement is usually driven by participation. Buyers enter gradually, price builds structure, and trends develop through sequences of higher highs and higher lows.
Downward movement is often driven by liquidation.
When price drops, long positio