Is Dell Going To Top And Have A Downside Correction? The retail news about Dell, HPQ, HPE and many other companies from the Computer Systems and Communications industries were blasted last week from retail news stating that these firms were going to experience a downside correction.
However, if you study the stock charts, you will see that a very sturdy sideways trend has developed which will support the stock as it continues to move upward. In fact, when the Major indexes, such as the SPX, are heading down, Dell and other computer systems indust
Darkpools
Void of Buyers vs. Corporate Buyback PatternsToday’s TradingView tutorial explains how to recognize a Void of Buyers and Corporate Buyback candlestick patterns on a stock chart. These are entirely different price-and-volume patterns, and the Accumulation/Distribution indicator provides important confirmation.
When there is a Void of Buyers, the retail news will usually find some “reason” for the decline in the Dow 30, NASDAQ 100, and S&P 500. Yesterday and several times last week, there was a Void of Buyers. The retail news claimed th
How Institutions Quietly Move Billions Before Your Chart ReactsAlmost half of all equity trading in the United States takes place in dark pools. This means that roughly 40-45% of all equity volume trades off-exchange in alternative trading systems, as of 2026. Most retail traders' charts only tell them part of the story, as a significant amount of trading volume never appears on traditional exchanges. In this article, we're going to talk about what dark pools are, why trading takes place outside of traditional exchanges, and how this information can help yo
Why the stock market suddenly reversed to the upsideWere you surprised when the major indexes suddenly stopped running down and gapped and ran up to new highs? You can anticipate that shift when you know the candlestick and indicator patterns that indicate a shift in the balance of power.
WHY? because all of the Dark Pool Hybrid Indicators and candle patterns were signaling a reversal before the indexes reversed suddenly to the upside. The indicators and price patterns revealed the reversal early, as they typically do.
Are you trying to pred
VWAP and Market Participant GroupsThe first FACT that you need to understand about VWAP as an indicator that has bands that contract and expand is which of the 15 Market Participant Groups are in control of a stock's price. The Market Participant Groups are critical to understanding how to interpret VWAP and how to use Chaikin's Oscillator to reveal the professionals, corporate buybacks, Sell Side Institutions, Hedge Funds, and MEMEs Groups activity before the price trend shifts from downside to upside, or vice versa. This is cr
Indicator Divergence and Convergence Reveal Professional TradersDivergence and convergence indicators can help traders identify changes in price momentum and determine which market participants may be controlling price.
For the most responsive analysis, use an exponential moving average (EMA) or another front-weighted moving average. Avoid simple moving averages, which can lag too far behind current price action.
Begin with one primary indicator and one subordinate indicator. Primary indicators analyze price, volume, or both, while subordinate indicators i
Angle of Ascent, Support vs. Resistance & Retail NewsWhen a stock launches sharply out of a bottom, the Angle of Ascent becomes one of the most important signals to monitor. In this chart, the angle has gone near‑vertical , price has pierced resistance , and the candles are shrinking — a classic combination that tells swing traders it’s time to prepare an exit, not chase the final push.
Trying to capture the absolute high only increases risk. Vertical runs almost always retrace vertically , especially when the move is driven by speculativ
The Market Participant Cycle for StocksOne of the most important aspects of the stock market is the Market Participant Cycle. This is a cycle that creates the long-term, mid-term and short-term trends. Each Market Participant has a completely different price and trend pattern on stock charts. Identifying which Market Participant(s) are in control of price is crucial for selecting when to buy or sell a stock.
The most important Market Participants are the Dark Pools. There are 14 Market Participant groups that trade or invest in the
How to Interpret Accumulation vs. Distribution IndicatorsToday we're using the NASDAQ:PANW chart for a tutorial on how to determine when a stock has started a bottom and is no longer a sell short opportunity, by reading the accumulation vs. distribution indicator along with volume and candlestick patterns.
Reading indicators is essentially learning the language of the market. Candlesticks are an indicator; volume is an essential indicator. Accum vs Dist is also critical to compare to price and volume to understand who is in control of the price ac
How to Find the Dark Pool Buy-Side Bargain HuntingThere is plenty of bad news to worry about. However, the Dark Pool Buy-Side Institutions are in hidden accumulation mode, bargain hunting right now. Swing and position traders need to learn how to track the Dark Pool activity, identify their footprints on the charts, and identify which industries and stocks they are accumulating slowly over time.
The Dark Pool Buy-Side has vast assets under management worldwide. They are the most important and dominant of the 12 Market Participant Groups. The
Dark Pool Buy Zones and Run Gain Potential ExplainedUnderstand How Dark Pool Buy Zones Create Pro Trader Nudges
These candlestick patterns I call "nudges" cause swing style runs that you can trade if you learn how to trade with the professional traders who set up these patterns and other very small candles that trigger the AI that High Frequency Trading firms use or small fund managers to buy or sell the stock.
Professional traders do not drive price up, buying into a run. They set a trigger that instigates the runs up or down from HFT AI, Sm
The 2nd Phase of AI Technology is UnderwayThis tutorial is about discovering how new technologies such as AI have several phases over many years which create growth and speculation in the leading companies.
There are always 3 top contenders for a new technology sub industry. A sub industry is an industry that is within the primary industry.
For example, NASDAQ:GOOG , Open AI, and Anthropic are currently the top contenders for the subindustry: Medical Diagnostics AI. This is just one of many sub industries that will emerge over the n
Explanation of a Risk of a Flash CrashA risk of a Flash Crash is not the start of a Bear Market. Flash Crashes are uncommon in indexes and more common in individual stocks during earnings season and when there is a major negative news item that is unsupported by actual hard data.
Retail news creates fear and uncertainty often with information that is not always accurate or that is stated in a way to create fear of a NON EVENT.
A non event is something that might happen.
Flash Crashes also occur on individual stocks when HFT AI
Analysis of RIVNSPRS takes time to develop, but the ability to READ a stock chart and all the dynamics of each individual stock chart as quickly and easily as you read a book is important for consistently successful trading. Charts are the LANGUAGE of trading transactions and you must develop this skill to have a high income trading stocks.
Professional traders swing trade. The will nudge price or create setups that triggers HFT AI with their huge quantities of orders flooding the queues before the market ope
Risk Control, Risk Assessment, Risk ManagementWhy do the professionals make consistently high incomes from trading stocks?
They always control and manage their risk. They use the candlestick patterns as support and resistance levels and allow the stock to "breathe" within a range they have determined is a natural price movement up and down within a tight consolidation, which is what the professionals prefer to trade.
Professionals do mitigate risk on huge-lot orders over 1 million - 5 million shares or higher. They may use Option Puts,
Dark Pools & Position Trading for Monthly IncomeHow Dark Pools Create Monthly Income Opportunities for Position Trading
Dark Pools create a tight sideways trend I call a "Platform" because the highs and lows within the sideways trend are very consistent and form a trend that is wider than a consolidation but narrower than a typical sideways trend which lacks the consistent highs and lows of a platform.
Position Hold trading holds the stock longer than Swing trading, and thus generates higher profits over time.
When markets are stressed,
Anatomy of a Breakaway Gap & What Happens NextAMZN is an excellent example of a Breakaway gap due to improvement of the company's fundamentals. The prior fundamental level is clearly defined on the chart and easy to see. The new fundamental level has not yet been fully established and will begin to form over the next few weeks.
Even if there is a Flash Crash, the fundamental lows of the previous level are very strong support.
What to watch for in the stock price action over the next few weeks:
1. Dark Pool accumulation in the Buy Zone.
2
META| 720 Breakout Setup- Gamma MORE!Price Consolidating just below 719-720- a key volume shelf and gamma pivot. A clean breakout with volume could trigger a dealer hedge-driven squeeze into 740-750 as gamma flips positive in the coming days or weeks.
74% bullish call flow today hints at an early momentum shift- watching the EMA cloud to flatten for added confluence.
The Four Different Sideways TrendsIn the modern Market Structure, stocks, indexes and industry indexes move sideways or trend moving horizontally most of the time. Understanding this phenomenon and how to use it to your advantage is important to learn.
There are 4 different types of price moving sideways:
1. The consolidation is a very narrow price range, often less than 5% but can be wider. The consolidation trend usually lasts a few days to a few weeks. The price action is very tight and small. Pro traders dominate consolid
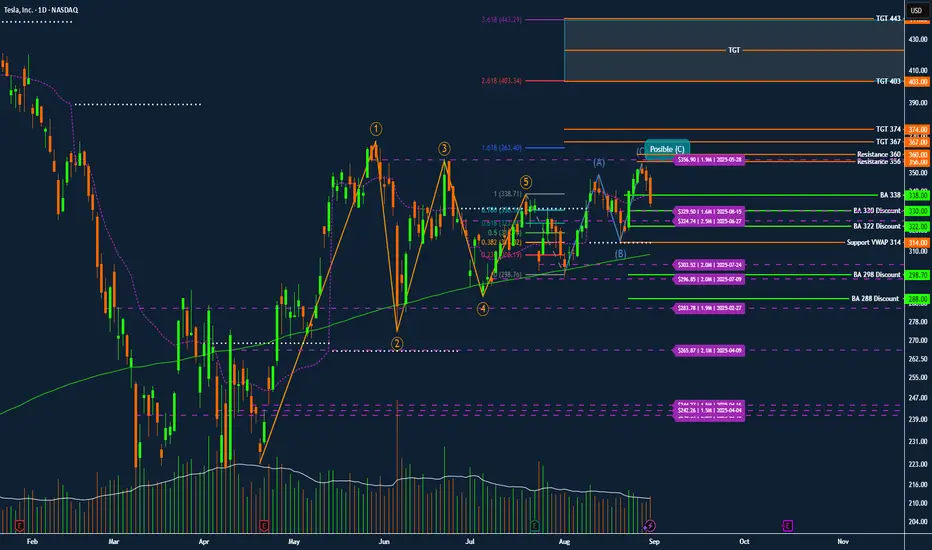
TSLA TESLA Institutional Roadmap for September Discount ZoneTesla NASDAQ:TSLA – Institutional Roadmap for September: Discount Zones, Breakout Triggers, and Squeeze Targets
Tesla continues to trade as one of the clearest institutional battlegrounds in the market. The footprints in option open interest, dark pool levels, and anchored VWAP create a very precise map for swing traders who want to follow the flow rather than fight it.
Elliott Wave Context
Tesla completed a clean 1–5 impulse wave earlier in the year. The stock has since been retracing
Earnings HFT gapsThe gaps that form during earnings season on or the next day after the CEO reports the revenues and income for that past quarter are always HFT driven. The concern over the past 2 previous quarters was the fact that the High Frequency Trading Firms were incorporating Artificial Intelligence into their Algos to make automated trading decisions on the millisecond scale. These small lot orders fill the ques milliseconds ahead of the market open in the US and any huge quantity of ORDERS (not lot si
How Sell Side Institutions Move Price: BuybacksThere are Buy Side Institutions, aka Dark Pools, and there are Sell Side Institutions, the Money Center Banks and Giant Financial Services companies. These two groups dominate the market activity and move price in entirely different ways and for entirely different reasons.
Sell Side Institutions are short-term TRADERS. They are not allowed, nor do they wish, to hold stocks for the long term. The Sell Side trades stocks and has the most experienced, most talented, and most sophisticated floor tr
Understanding How Dark Pool Buy Side Institutions AccumulateThe SPY is the most widely traded ETF in the world. Its price or value movement reflects the S&P 500 index value. It doesn't reflect the buying or selling of the SPY.
You must use volume indicators and accumulation/distribution indicators that indicate whether the Buy Side Institutions are in accumulation mode, rotation to lower inventory to buy a different ETF or other instrument, OR distribution due to mutual fund and pension fund redemption demands.
ETFs are one of the fastest growing ind


