DOGSUSDT LONG SET UP ALERT !#DOGS
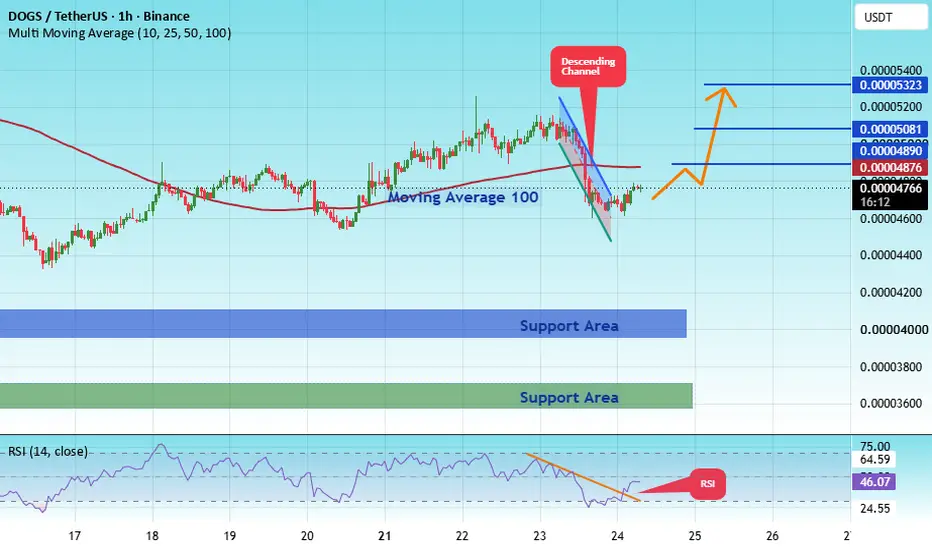
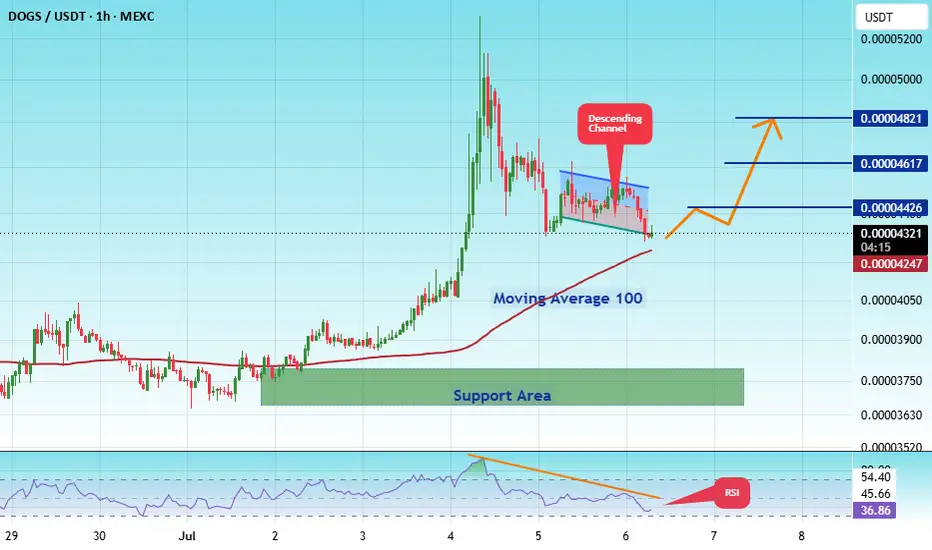
The price is moving within a descending channel on the 1-hour timeframe; it has reached the lower boundary and is poised for a rebound. A retest of this boundary is expected, supporting an upward move.
The Relative Strength Index (RSI) indicates a bearish trend, but an upward breakout is likely due to oversold conditions on the 1-hour timeframe.
An orange trend line supports the potential upward rebound.
There is initial support at 0.00004569, acting as a preliminary support zone.
A k
Dogsusdc
DOGSUSDT LONG SET UP ALERT !#DOGS
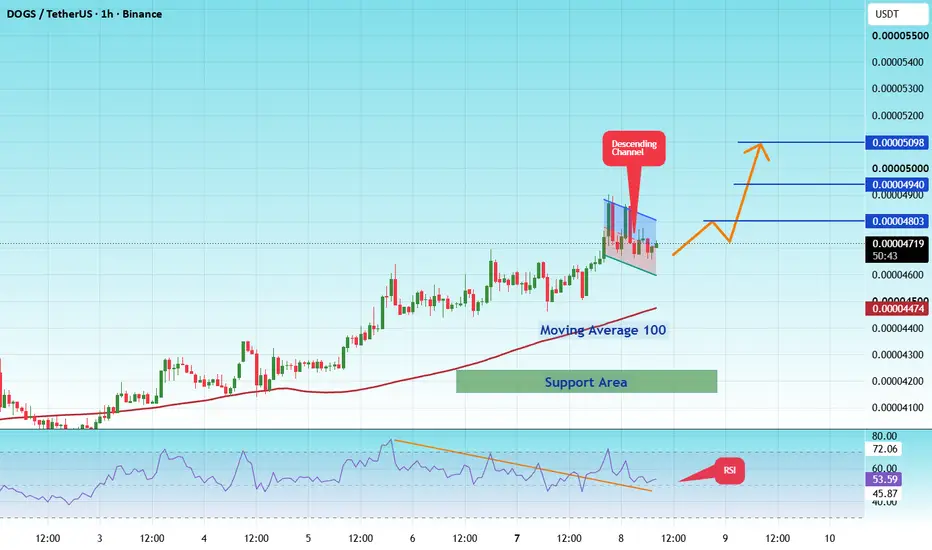
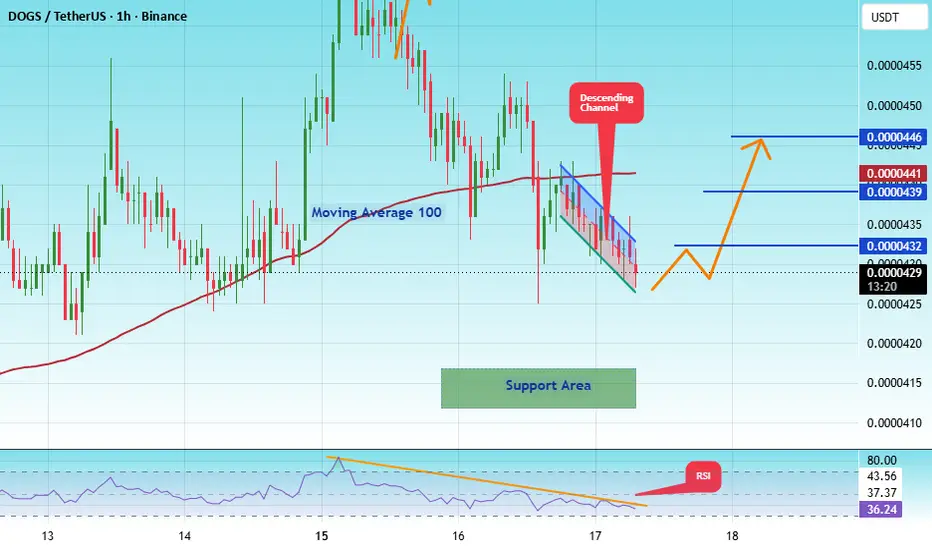
The price is moving within a descending channel on the 1-hour timeframe; it has reached the lower boundary and appears poised for a rebound. A retest of this boundary is expected, supporting an upward move.
The Relative Strength Index (RSI) indicates a bearish trend, but an upward breakout is likely due to oversold conditions on the 1-hour chart.
An orange trend line supports the potential upward rebound.
There is initial support at the 0.00004000 level, acting as a primary support zon
#DOGSUSDT LONG SET UP ALERT !#DOGS
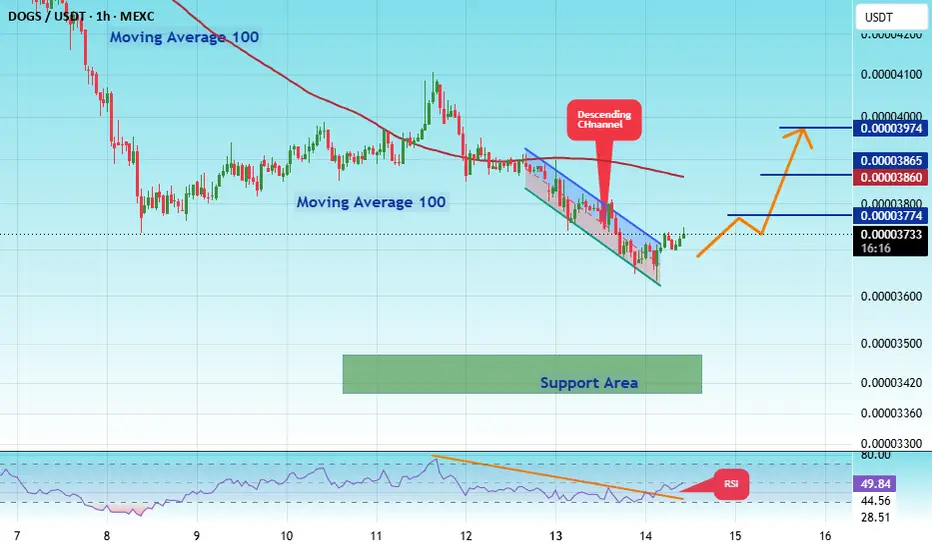
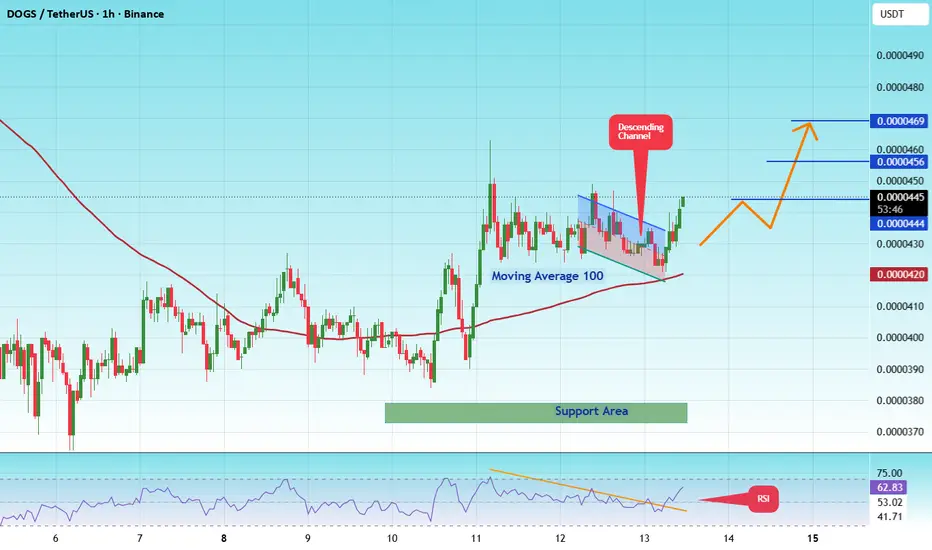
The price is moving within a descending channel on the 1-hour timeframe; it has reached the lower boundary and is poised for a rebound. A retest of this boundary is expected, supporting an upward move.
The Relative Strength Index (RSI) indicates a bearish trend, but an upward breakout is likely due to oversold conditions on the 1-hour timeframe.
There is initial support at 0.00003843 acting as a primary support zone.
A key support zone (marked in green) exists at 0.00003370; the price
#DOGS/USDT may continue its trend after correction#DOGS
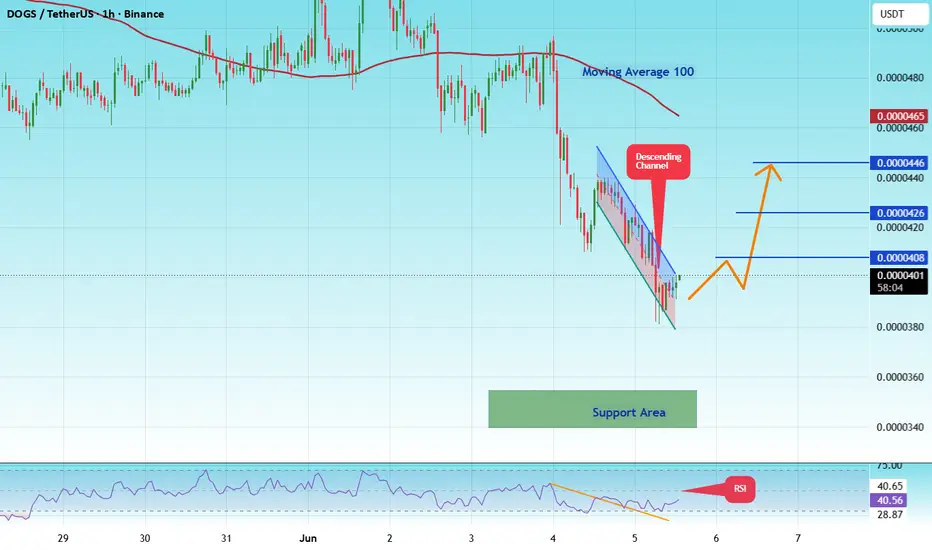
The price is moving within a bearish channel on the 1-hour timeframe; it has reached the lower boundary and is poised to break through it. A retest of this boundary is expected.
The Relative Strength Index (RSI) indicates a bearish trend, which is likely to continue given the overbought conditions.
There is a key resistance zone (marked in green) at 0.00005252; the price has bounced off this level multiple times, establishing it as a strong support level.
A consolidation trend is obser
#DOGSUSDT LONG SET UP ALERT !#DOGS
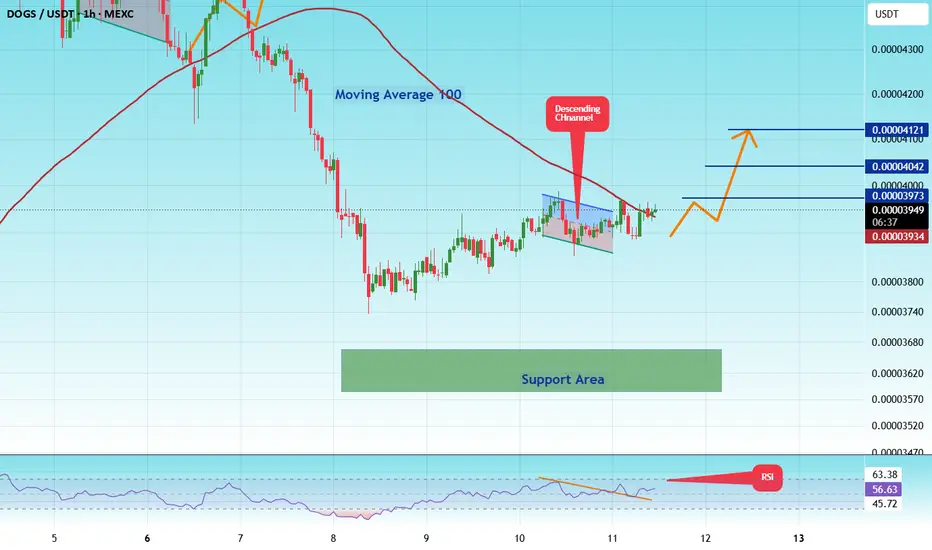
The price is moving within a descending channel on the 1-hour timeframe and has reached the lower boundary. It is now poised for a bounce and is expected to retest this boundary.
The Relative Strength Index (RSI) indicates a downward trend, which is likely to continue given the overbought conditions.
A key support zone has been identified in green at 0.00004200. The price has bounced off this zone several times, making it a strong support level.
The price is trending towards the 100-pe
#DOGSUSDT LONG SET UP ALERT !#DOGS
The price is moving within a descending channel on the 1-hour timeframe and has reached the lower boundary. It is now poised for a bounce and is expected to retest this boundary.
The Relative Strength Index (RSI) indicates a downward trend, which is likely to continue given the overbought conditions.
There is a key support zone in green at 0.00003376, and the price has bounced off this zone several times, making it a strong support level.
The price is trending towards the 100-period mo
#DOGSUSDT LONG SET UP ALERT !#DOGS
The price is moving within a descending channel on the 1-hour timeframe and has reached the lower boundary. It is now poised for a bounce and is expected to retest this boundary.
The Relative Strength Index (RSI) indicates a downward trend, which is likely to continue given the overbought conditions.
There is a key support zone in green at 0.00003259. The price has bounced off this zone several times, making it a strong support level.
The price is trending towards the 100-period moving
#DOGSUSDT is currently strongly bullish#DOGS
The price is moving within a descending channel on the 1-hour timeframe and has reached the lower boundary. It is now poised for a bounce and is expected to retest this boundary.
The Relative Strength Index (RSI) indicates a downward trend, which is likely to continue given the overbought conditions.
There is a key support zone in green at 0.00003200. The price has bounced off this zone several times, making it a strong support level.
The price is trending towards the 100-period moving
#DOGSUSDT is currently strongly bullish#DOGS
The price is moving within a descending channel on the 1-hour timeframe and has reached the lower boundary. It is now poised for a bounce and is expected to retest this boundary.
The Relative Strength Index (RSI) indicates a downward trend, which is likely to continue given the overbought conditions.
There is a key support zone (in green) at 0.00003400. The price has bounced off this zone several times, making it a strong support level.
The price is trending towards the 100-period movi
#DOGSUSDT is currently strongly bullish#DOGS
The price is moving within a descending channel on the 1-hour timeframe and has reached the lower boundary. It is now poised for a bounce and is expected to retest this boundary.
The Relative Strength Index (RSI) indicates a downward trend, which is likely to continue given the overbought conditions.
A key support zone has been identified in green at 0.00003590. The price has bounced off this zone several times, making it a strong support level.
The price is trending towards the 100-pe
#DOGSUSDT#DOGS
The price is moving within a descending channel on the 1-hour timeframe and has reached the lower boundary. It is now poised for a bounce and is expected to retest this boundary.
The Relative Strength Index (RSI) indicates a downward trend, which is likely to continue given the overbought conditions.
There is a key support zone in green at 0.000003680. The price has bounced off this zone several times, making it a strong support level.
The price is trending towards the 100-period movin
#DOGSUSDT is currently strongly bullish#DOGS
The price is moving within a descending channel on the 1-hour timeframe and has reached the lower boundary. It is now poised for a bounce and is expected to retest this boundary.
The Relative Strength Index (RSI) indicates a downward trend, which is likely to continue given the overbought conditions.
There is a key support zone in green at 0.0000410. The price has bounced off this zone several times, making it a strong support level.
The price is trending towards the 100-period moving
#DOGSUSDT is currently strongly bullish#DOGS
The price is moving within a descending channel on the 1-hour timeframe and has reached the lower boundary. It is now poised for a bounce and is expected to retest this boundary.
The Relative Strength Index (RSI) indicates a downward trend, which is likely to continue given the overbought conditions.
There is a key support zone in green at 0.0000413. The price has bounced off this zone several times, making it a strong support level.
The price is trending towards the 100-period moving
#DOGSUSDT is currently strongly bullish#DOGS
The price is moving within a descending channel on the 1-hour timeframe and has reached the lower boundary. It is now poised for a bounce and is expected to retest this boundary.
The Relative Strength Index (RSI) indicates a downward trend, which is likely to continue given the overbought conditions.
There is a key support zone in green at 0.00003583. The price has bounced off this zone several times, making it a strong support level.
The price is trending towards the 100-period moving
#DOGSUSDT is currently strongly bullish#DOGS
The price is moving within a descending channel on the 1-hour timeframe and has reached the lower boundary. It is now poised for a bounce and is expected to retest this boundary.
The Relative Strength Index (RSI) indicates a downward trend, which is likely to continue given the overbought conditions.
A key support zone has been identified in green at 0.0000367. The price has bounced off this zone several times, making it a strong support level.
The price is trending towards the 100-per
#DOGSUSDT is currently strongly bullish#DOGS
The price is moving within a descending channel on the 1-hour timeframe and has reached the lower boundary. It is now poised for a bounce and is expected to retest this boundary.
The Relative Strength Index (RSI) indicates a downward trend, which is likely to continue given the overbought conditions.
A key support zone has been identified in green at 0.0000370. The price has bounced off this zone several times, making it a strong support level.
The price is trending towards the 100-per
#DOGSUSDT is currently strongly bullish#DOGS
The price is moving within a descending channel on the 1-hour timeframe and has reached the lower boundary. It is now poised for a bounce and is expected to retest this boundary.
The Relative Strength Index (RSI) indicates a downward trend, which is likely to continue given the overbought conditions.
A key support zone has been identified in green at 0.0000340. The price has bounced off this zone several times, making it a strong support level.
The price is trending towards the 100-per
#DOGSUSDT is currently strongly bullish#DOGS
The price is moving within a descending channel on the 1-hour timeframe and has reached the lower boundary. It is now poised for a bounce and is expected to retest this boundary.
The Relative Strength Index (RSI) indicates a downward trend, which is likely to continue given the overbought conditions.
There is a key support zone (in green) at 0.0000444. The price has bounced off this zone several times, making it a strong support level.
The price is trending towards the 100-period movin
#DOGSUSDT is currently strongly bullish#DOGS
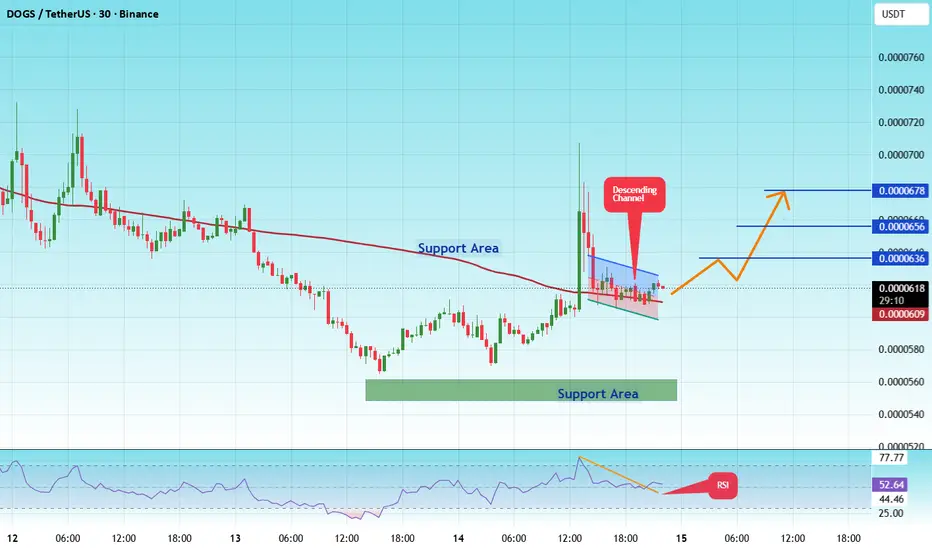
The price is moving within a descending channel on the 30-minute timeframe and has reached the lower boundary. It is now poised for a bounce and is expected to retest this boundary.
The Relative Strength Index (RSI) indicates a downward trend, which is likely to continue given the overbought conditions.
There is a key support zone in green at 0000446. The price has bounced off this zone several times, making it a strong support level.
The price is trending towards the 100-period moving
#DOGSUSDT is currently strongly bullish#DOGS
The price is moving within a descending channel on the hourly timeframe. It has reached the lower boundary and is trending towards a bounce. A retest of this boundary is expected.
The Relative Strength Index (RSI) indicates a downward trend, and this trend is likely to continue due to the overbought condition.
A key support zone has been identified in green at 0.0000447. The price has bounced off this zone several times, making it a strong support level.
The price is trending towards t
#DOGSUSDT is currently strongly bullish#DOGS
The price is moving within a descending channel on the hourly timeframe. It has reached the lower boundary and is trending towards a bounce. A retest of this boundary is expected.
The Relative Strength Index (RSI) indicates a downward trend, and this trend is likely to continue due to the overbought condition.
A key support zone has been identified in green at 0.0000460. The price has bounced off this zone several times, making it a strong support level.
The price is trending towards t
#DOGSUSDT is currently strongly bullish#DOGS
The price is moving within a descending channel on the hourly timeframe. It has reached the lower boundary and is trending towards a bounce. A retest of this boundary is expected.
The Relative Strength Index (RSI) indicates a downward trend, and this trend is likely to continue due to the overbought condition.
A key support zone has been identified in green at 0.0000550. The price has bounced off this zone several times, making it a strong support level.
The price is trending towards t
#DOGS/USDT is currently strongly bullish#DOGS
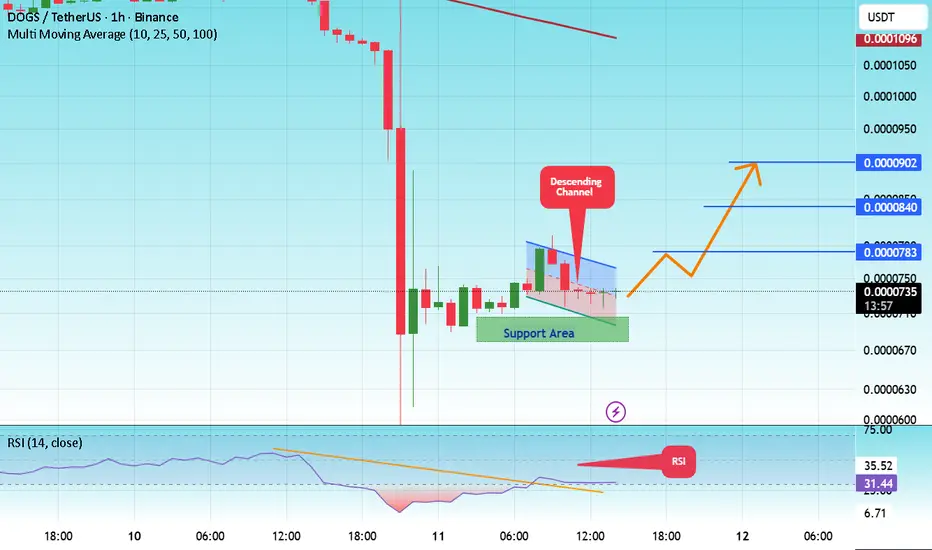
The price is moving in a descending channel on the 1-hour frame and is expected to break and continue upward.
We have a trend to stabilize above the 100 moving average again.
We have a downtrend on the RSI indicator that supports the upward move with a breakout.
We have a major support area in green that pushed the price higher at 0.0000700.
Entry price: 0.0000732.
First target: 0.0000783.
Second target: 0.0000840.
Third target: 0.0000902.
To manage risk, don't forget stop loss and c
#DOGS/USDT is currently strongly bullish#DOGS
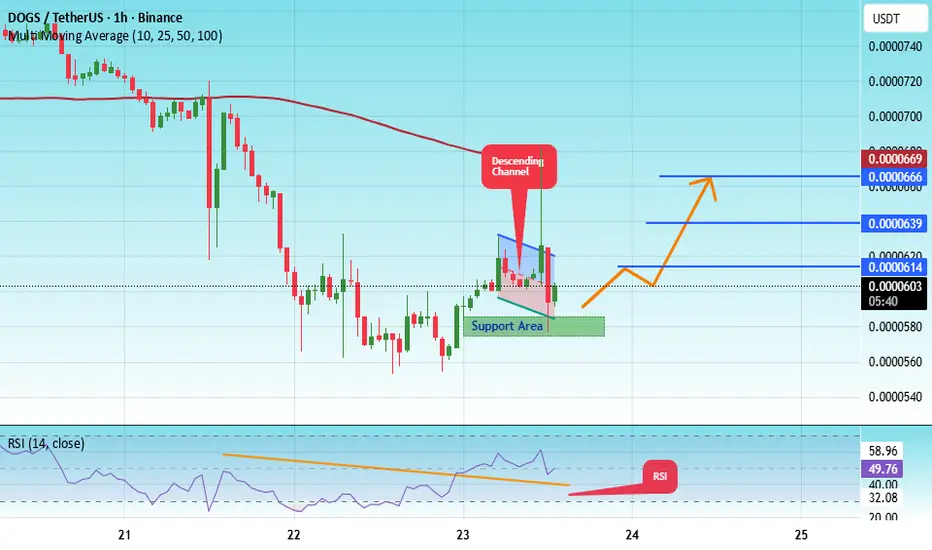
The price is moving within a descending channel on the 1-hour frame, adhering well to it, and heading for a strong breakout and retest.
We have a bearish trend on the RSI indicator that is about to be broken and retested, which supports the upward breakout.
There is a major support area in green at 0.0000577, which represents a strong support point.
We are heading for consolidation above the 100 moving average.
Entry price: 0.0000600
First target: 0.0000614
Second target: 0.0000639
Th