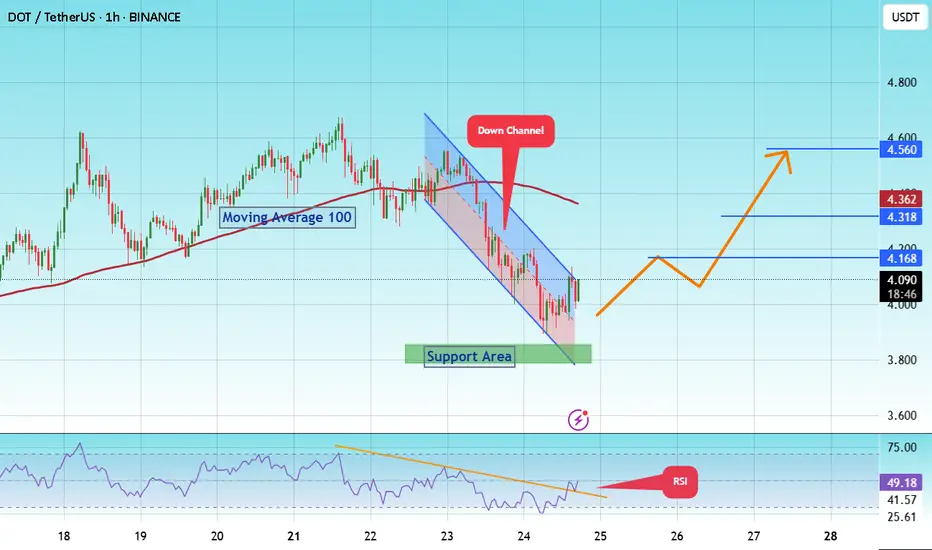
#DOT/Eyes 15% Rally, Targeting Key $ 4.560 Resistance Level#DOT
The price is moving within a descending channel on the 1-hour frame and is expected to break and continue upward.
We have a trend to stabilize above the 100 moving average once again.
We have a downtrend on the RSI indicator that supports the upward break.
We have a support area at the lower limit of the channel at 3,870, acting as strong support from which the price can rebound.
We have a major support area in green that pushed the price higher at 3,800.
Entry price: 4.084
First target: 4.168
Second target: 4.318
Third target: 4.560
To manage risk, don't forget stop loss and capital management.
When you reach the first target, save some profits and then change your stop order to an entry order.
For inquiries, please comment.
Thank you.
DOTUSDT
DOT - Confirmed!DOT Technical Outlook
On the weekly timeframe, DOT has confirmed a breakout from its long-term downtrend, followed by a successful retest. This establishes a solid technical foundation, with confluence now forming between the weekly and daily structures.
On the daily chart, price action has moved decisively above the previous bearish zone, signaling renewed momentum. In the short term, the key resistance levels to monitor are $5, $6, and $8. A sustained breakout above these thresholds would provide confirmation for a broader bullish scenario.
From a technical perspective, the upward trend has been validated. The next catalyst for continuation will likely come from upcoming market developments and potential positive news flow, which could act as triggers to remove remaining resistance barriers.
Overall, the technical setup suggests that DOT is positioned for further upside, with a constructive outlook in the near to medium term.

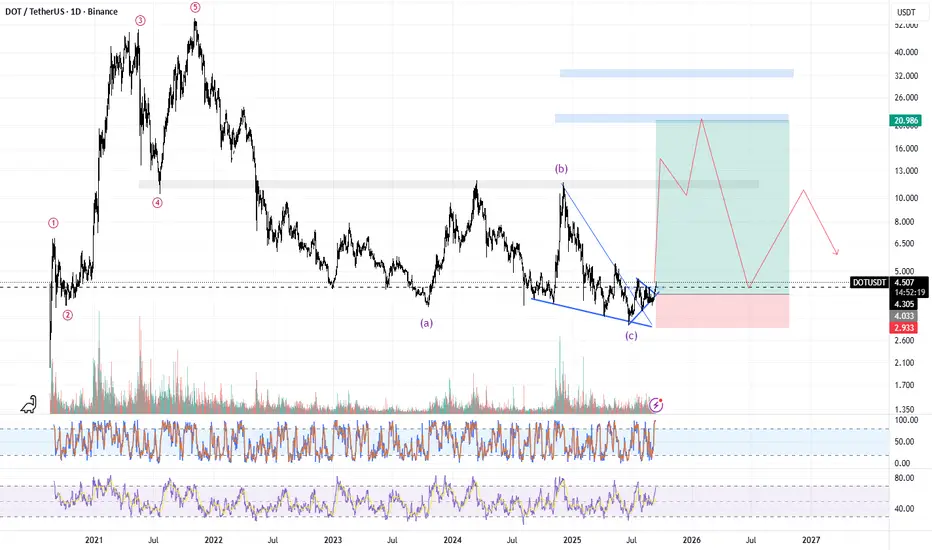
DOT/USDT has not made a new all-time high in the current cycle.In my opinion, in this cycle, considering the end of the trend and the fact that it hasn’t formed a proper bottom, we are unlikely to see a new high. However, we could reach the 50% or 68% retracement levels of the previous decline and start the first impulsive wave. This movement is similar to what XRP experienced in the previous cycle.
DOT; BUY OR SELL?Hello friends
Given the good growth we had, the price has formed a triangle, and if the triangle breaks, the price can move to the specified targets.
If the price falls, we have two excellent support areas that the price will definitely react to.
*Trade safely with us*

DOT STARTING NEW VOLUME TRENDDOT STARTING NEW VOLUME TREND
Following to see new confirmations at DOT
DOT - Loading!!!DOT Technical Analysis & Market Outlook September 2025
In May 2025, DOT’s price decisively broke out of the long-term weekly downtrend, followed by a successful retest in June 2025.
However, despite the anticipation of many investors, the market entered a sideways consolidation phase instead of delivering an explosive breakout.
I have also been patiently waiting for this breakout, though that patience has been increasingly tested. To refine my outlook, I shifted to the daily timeframe in search of confirmation on a smaller scale, closely monitoring for a breakout signal. Yet, the trading session on September 7, 2025, despite notable volatility, failed to produce a decisive breakout.
That said, I am not discouraged. On the daily chart, although the price faced strong rejection on September 7 and the attempt to break higher encountered resistance, the structure still suggests that once this barrier is cleared, a breakout is imminent—likely within just a few sessions.
From a technical standpoint, the bullish trend is clear. What remains is the alignment between the daily and weekly structures to ignite a strong move. Historically, such technical confirmations are often catalyzed by major news or events. After reviewing both the fundamental catalysts and potential risks, I outline three primary scenarios for DOT in the near term:
🔮 DOT Price Scenarios (Q4 2025)
🚀 Bullish Scenario (30%)
JAM Upgrade launched successfully with no major technical issues.
Polkadot Hub + Asset Hub attract leading dApps (DeFi, NFT, Gaming).
Bitcoin maintains its post-halving uptrend.
Institutional capital flows in via the Polkadot Capital Group (PCG).
Projected Price: $33 – $52 (Moon case)
⚖️ Neutral Scenario (45%)
Roadmap delivered on time, but no standout dApps emerge.
Altcoin market rises modestly, yet capital remains concentrated in BTC & ETH.
DeFi and DOT staking adoption grows, but fails to trigger mass adoption.
Projected Price: $8 – $12 – $22
🐻 Bearish Scenario (25%)
JAM or Elastic Scaling delayed or faces critical bugs.
Liquidity exits altcoins; BTC dominance rises sharply.
Regulatory pressure (DOT potentially classified as a security).
End-of-cycle profit-taking pressure from investors.
Projected Price: $4 – $6
📌 Conclusion
Regardless of the scenario, it is increasingly clear that DOT has already established its bottom. The key question now is not if but when the breakout will arrive—an event that could align with the “Moon scenario.”
I hope this analysis provides valuable insights and supports your investment decisions.

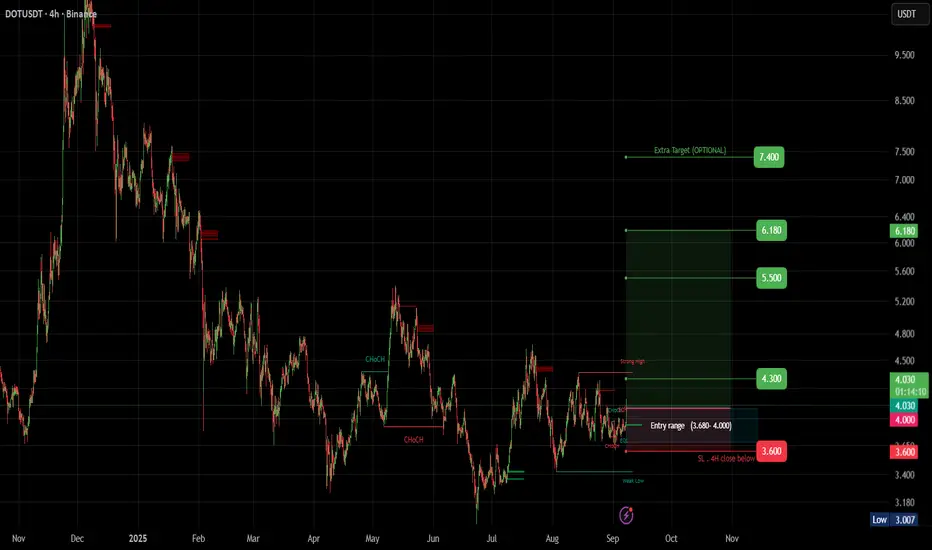
DOT (SPOT)BINANCE:DOTUSDT
#DOT / USDT
Entry range (3.680- 4.000)
SL 1D close below 3.600
T1 4.300
T2 5.500
T3 6.180
Extra Target is optional 7.400
_______________________________________________________
Golden Advices.
********************
* collect the coin slowly in the entry range.
* Please calculate your losses before the entry.
* Do not enter any trade you find it not suitable for you.
* No FOMO - No Rush , it is a long journey.
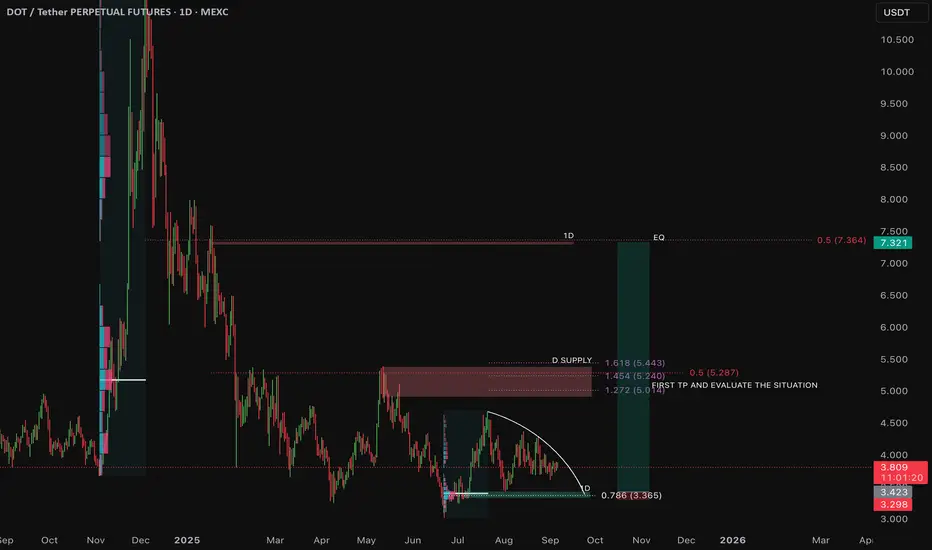
$DOT HTF Idea if MMs give us a final leg upCRYPTOCAP:DOT perhaps is in accumulation and my entry is in the wide area of the OB ( yes i include wicks sometimes ) and on Daily Demand. My thesis is supported by FIB and from POC of the FRVP and also from the Liquidity curve. SL is below OB. TP is in the Daily Supply area supported from FIB extensions and POC of the FRVP of the macro move. Also EQ of a PSH which PA found clear resistance. If PA overcomes this area then we BCS at Daily Supply and EQ of the Macro move.
( - Beginner chart - so dont take as granted, constructive critism is welcome )
Thank you.
DOTUSDTI have conducted a technical analysis of 1150 using the Janne School methodology, combining both numerical and temporal analysis. Based on my findings, I believe that 1150 is poised to reach a target price of 44 rs. My analysis incorporates various

Polkadot Dot usdt daily analysis
Time frame hourly
Risk rewards ratio =1.75
Target = 4.33 $
I expected the price to drop to $3.67 and then rise.
Now, in the short term, I’m opening a position with low risk. If this position gets closed, we’ll have to see whether the price breaks the green trendline or continues fluctuating between these two lines.

DOT is bullish now and many Traders don't see it !!The price is trapped inside a triangle, and it is currently at the triangle's bottom. If we look at previous lows, the price has typically seen strong growth after hitting the bottom. If the price follows previous trends, we should now expect a price increase.
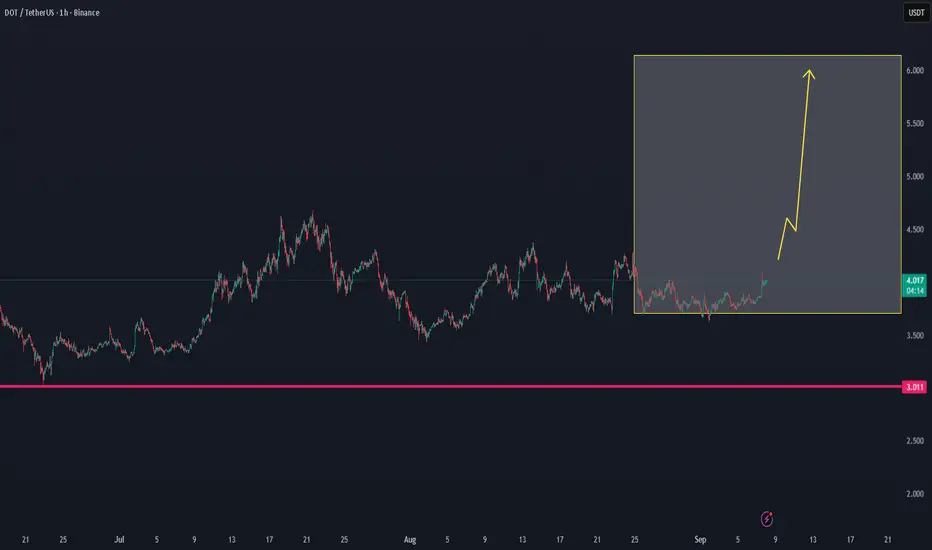
High Volume Support Could Push Polkadot 15% Higher Toward 4.90Hello✌️
Let’s analyze Polkadot’s price action both technically and fundamentally 📈.
🔍Fundamental analysis:
Polkadot added Elastic Scaling in Aug 2025 so parachains can rent extra power using DOT.
JAM upgrade is set for late 2025 to improve speed and cross chain links.
These updates could shape DOT’s activity in the coming months. 📊
📊Technical analysis:
BINANCE:DOTUSDT shows strong daily support and high trading volume 🚀. Maintaining this support could drive a 15% rally toward 4.90 📈.
✨We put love into every post!
Your support inspires us 💛 Drop a comment we’d love to hear from you! Thanks, Mad Whale

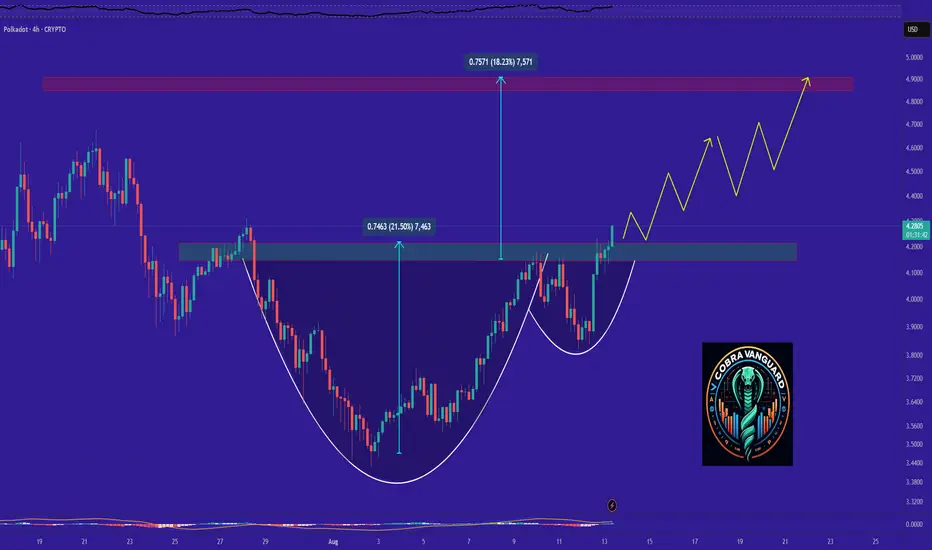
DOT is bullish now and many Traders don't see it !As I said,the cup and handle pattern has completed and broken out, which could quickly drive the price above $4.5.
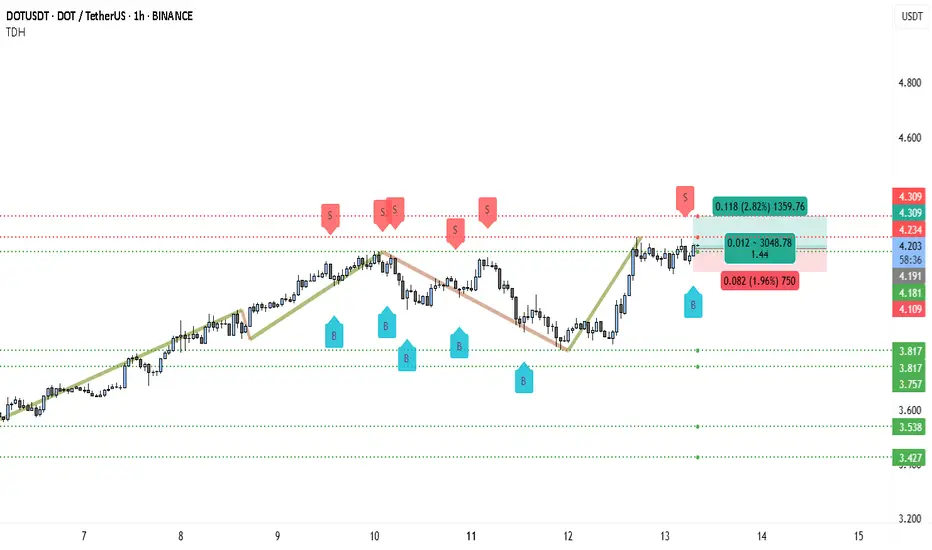
DOT Ready to Explode Above $4.20? Don’t Blink!📊 Market Structure
DOTUSDT is showing a bullish recovery after a recent pullback. From the August 7th low, the price trended upward strongly, making higher highs until around August 10th, where sellers took over and drove a retracement. The correction respected multiple support levels, and buying pressure re-emerged around $3.817–$3.757, leading to the latest rally.
Currently, DOT is trading just above the $4.181–$4.192 zone, which is a short-term support area. This level is important because it was previously resistance during the earlier uptrend and is now holding as a pivot for bullish continuation.
________________________________________
🔍 Price Action Insights
The chart shows multiple “B” buy signals during the dip phases, confirming accumulation zones. The most recent buy signal triggered right before price pushed toward the $4.309 resistance area. Sellers have previously been active around $4.234–$4.309, which explains the minor consolidation we’re seeing now.
The immediate upside target is $4.309 — a break and close above this on the 1H would likely send DOT toward higher resistances, possibly into the $4.40 area over the next sessions.
________________________________________
💼 Trading Setup (From Chart Data)
• Entry: $4.192 (current support & breakout retest)
• Stop Loss: $4.109 (below short-term support) – Risk ≈ 1.96%
• Take Profit: $4.309 (resistance) – Reward ≈ 2.82%
• Risk : Reward Ratio: ~1.44 : 1
________________________________________
📈 Bullish Scenario
If DOT holds above $4.181–$4.192 ✅, expect a retest and possible breakout above $4.309. Breaking that resistance could trigger a stronger rally toward $4.40+, with momentum building from the prior higher low.
________________________________________
⚠️ Bearish Risk
If $4.181 breaks decisively ❌, price could revisit the lower supports at $3.817 or even $3.757 before buyers attempt another push.
________________________________________
📌 Trade Management
1. Watch for bullish candles with strong closes above $4.234 — this would be the first sign of strength toward $4.309.
2. Take partial profit near $4.309 🏦 to secure gains.
3. Move stop-loss to breakeven once partial profits are taken.
4. If a breakout above $4.309 occurs, trail the stop under each new higher low to capture extended upside.
From this setup, DOTUSDT is in a bullish recovery mode and, as long as it stays above the $4.18 pivot, buyers have the advantage.
DOT/USDT Profit Heist | Don’t Let Bears Catch You🚨Polkadot Crypto Vault Break-In Plan | DOT/USDT Robbery Blueprint🚨
🌍 Hola Heist Crew! 💰📡
Ready for another vault-cracking strategy? Here's your DOT/USDT Crypto Heist Plan based on pure Thief Trading Style™—a fusion of smart-money tactics, technical traps, and stealth execution. 🎯💸
🔓 🎯 Entry Zone – Lockpick Ready
"The vault’s wide open! Swipe the bullish loot anywhere, anytime—but smart thieves plan pullback entries."
📌 Recommended: Use 15–30 min timeframe for sniper buys near swing highs/lows.
💡 Pro Move: DCA with layered buy limits like a seasoned thief stacking getaway routes. 🧠💵
🚔 Stop Loss – Evade the Patrol
📍 Secure SL just below the nearest 4H candle wick low (e.g., 4.000 zone)
🔐 Customize SL to match your risk profile & lot size—escape routes vary by thief rank.
💣 Target – Break the Vault & Vanish
🎯 TP: 5.200
🕶️ Optional: Dip out early if market heat rises near resistance traps. Escape clean.
⚠️ High Alert – Police Checkpoint Ahead
👮 Red MA Zone = Barricade.
It’s a hotspot for bearish cops + consolidation traps.
Only strong thieves survive here—book profits before you get cornered.
💼 For Scalpers & Swing Agents
🔍 Scalpers: Only ride long—quick bags, quick exit.
💰 Swingers: Follow the full robbery plan. Patience pays.
🎯 Trailing SL is your body armor—keep it tight.
📊 Fundamental Force Behind the Break-In
🔥 DOT/USDT is flashing bullish momentum supported by:
Sentiment shift
Intermarket alignment
COT positioning
On-chain data
📡 Stay updated via macro reports & sentiment dashboards—intel is profit.
📰 News Alert – Chaos Creates Opportunity
🧨 Avoid fresh entries during high-volatility news drops.
🎯 Trailing SL can save you during headline crossfire.
❗️Disclaimer:
This blueprint is for educational purposes only. Always conduct your own recon and apply strict risk management. Thieves who don’t scout first... get caught.
🚀 Boost the Heist – Support the Crew
💥 Smash that “Boost” if this plan adds value 💥
Your boost fuels more chart crimes, more profit hits, and a growing rob-the-market brotherhood! 💪💼📈
🧨 See you in the next job... Stay hidden, stay funded!
– Thief Trading Style™ HQ 🕶️🐱👤💰🚁

DOTUSDT - The Monster!It would be a shame if you’ve lost hope in DOT like many others have recently.
This is a strong project with a large market cap, and in every bullish season, it delivers solid performance — not explosive, but consistent. A moment will come when you’ll regret not buying it at $4.
From an investment perspective, its minimum long-term target is $40, while its more conservative mid-term target is $10.
Currently, the coin has broken out of a falling wedge pattern with a successful retest and has crossed above the 25 EMA on the 3-day chart.
These are all bullish indicators and a clear opportunity, especially with a nearby stop loss at $3.5.
Best regards:
Ceciliones🎯

DOT | Bounce Setup from Major Support ZonePolkadot (DOT) has dropped sharply in recent weeks and is now testing a significant support zone between $3.60 – $3.70. This level has historically provided strong demand, making it a potential launch point for a bounce toward higher resistance levels.
Trade Setup:
🔹 Entry Zone: $3.60 – $3.70
🔹 Take Profit Zones:
• TP1: $4.30 – $4.70
• TP2: $5.20 – $5.60
🔹 Stop Loss: Below $3.30
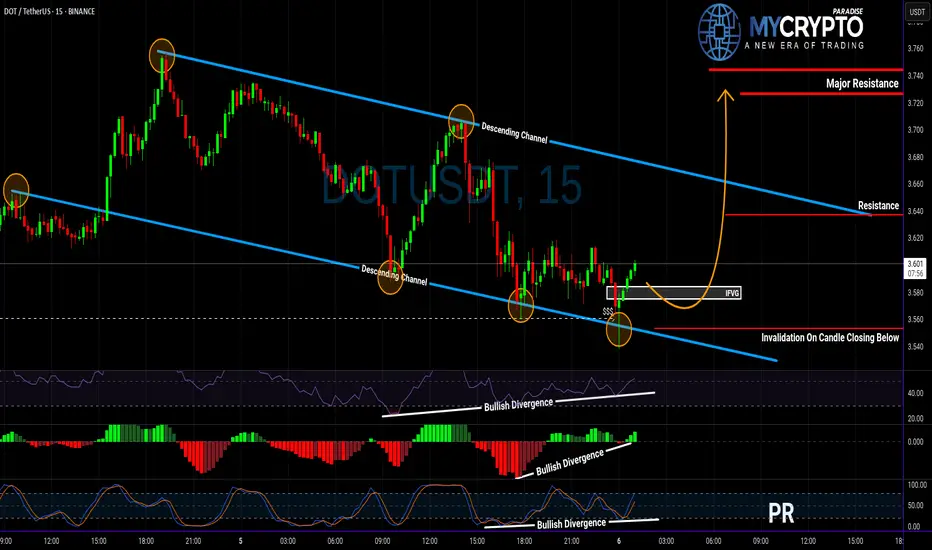
DOT About to Explode or Collapse? Read This Before Entering!Yello Paradisers, are you watching DOT closely? Because this setup could either give aggressive traders a golden entry—or wipe out the impatient ones 👀
💎DOTUSDT is showing strength after sweeping liquidity and now sitting right at the supportive trendline of its descending channel. What’s catching our attention is the clear bullish divergence on RSI, MACD, and Stoch RSI, which together boost the probability of a bullish breakout from here.
💎If we get a pullback, the IFVG zone (Inverse Fair Value Gap) below offers a clean setup for a high RR (risk-to-reward) trade. That would be a more strategic entry for patient traders. But for those who trade more aggressively, the current price is already offering a decent RR setup—just remember, this is not advisable for beginners. Patience and discipline remain key, especially in uncertain zones like this.
💎However, if DOTUSDT breaks down and closes a candle below our invalidation level, the bullish scenario is completely off the table. In that case, the smartest move is to step aside and wait for better confirmation before making any decisions.
🎖Strive for consistency, not quick profits. Treat the market as a businessman, not as a gambler.
MyCryptoParadise
iFeel the success🌴
Which altcoin hits the $50 club first? $INJ or $DOT? Which altcoin hits the $50 club first? CRYPTOCAP:INJ or CRYPTOCAP:DOT ? 🚀
3W HTF Technical Breakdown:
1⃣ CRYPTOCAP:INJ (@injective )
✔ Reclaimed structure above $13.31
✔ Targeting $31 → $52.98
✔ Clean 385% R:R setup
⚠ Invalidation below $8.79
2⃣ CRYPTOCAP:DOT (@Polkadot )
✔ Bounced from multi-year TL + demand zone
✔ Hold above $3: Targets $16.67 → $24.37 → $55
✔ Monster 1,660% setup loading
Both charts are screaming high-conviction breakout.
The $50 race is on…
NFA & DYOR

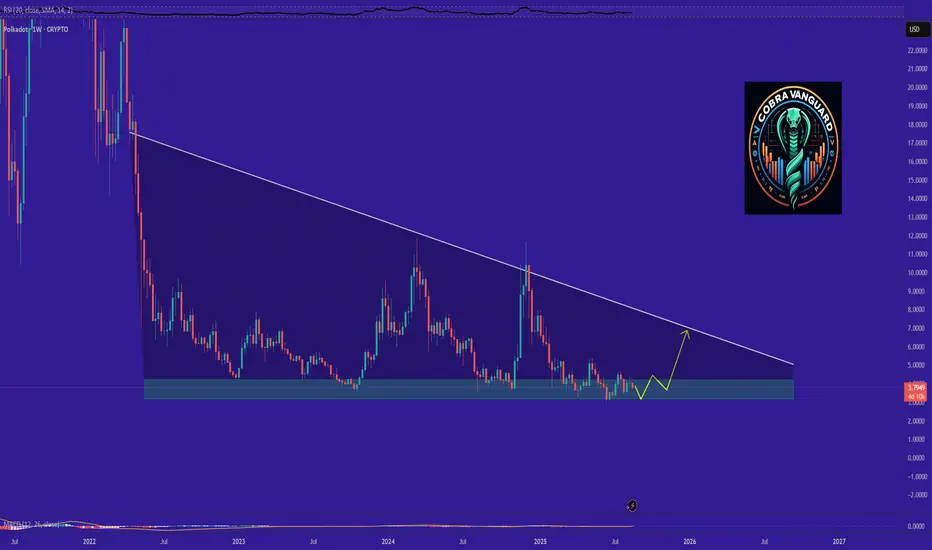
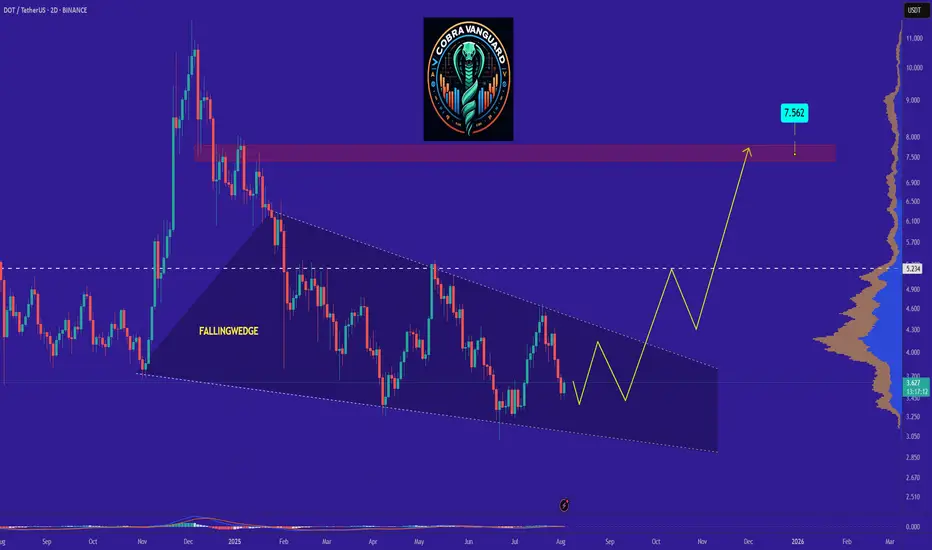
DOT is bullish now and many Traders don't see itSo if you pay attention to the DOT chart you can see that the price has formed a Ascending wedge which means it is expected to price move as equal as the measured price movement.( AB=CD )
NOTE: wait for break of the WEDGE .
Best regards CobraVanguard.💚
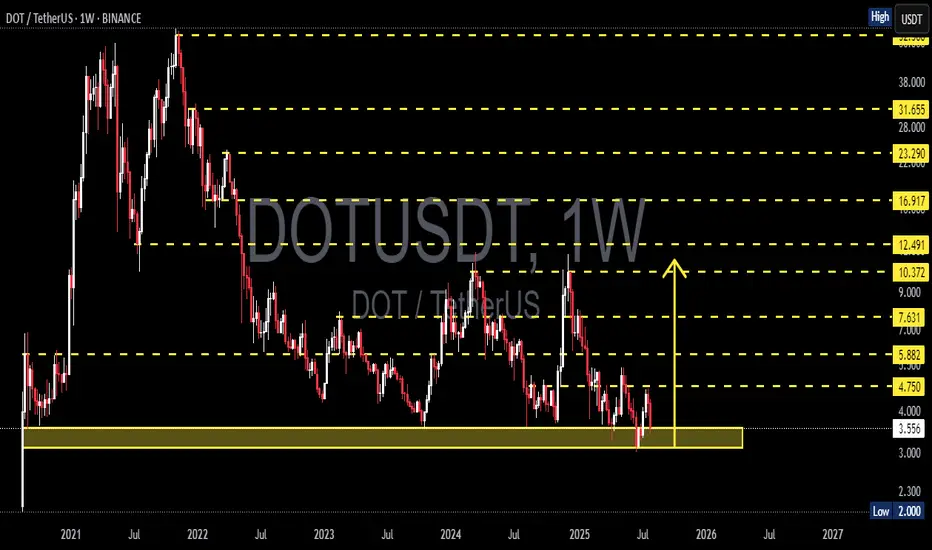
DOTUSDT On the Edge of a Major Rebound or a Devastating BreakdowPolkadot (DOT) is once again retesting one of its strongest macro support zones between $4.00 – $3.55, a historically significant demand area that has provided major price bounces since mid-2022.
This isn’t just a random level—it’s a critical accumulation base where large buyers have consistently shown interest. With price now hovering around this zone again, the next move could be decisive for DOT's mid- to long-term trend.
---
🔍 Price Structure & Key Patterns
Extended Accumulation Phase: DOT has been trading in a sideways range for over 80 weeks, indicating a potential bottoming structure forming after a prolonged downtrend.
Strong Historical Demand: The $4.00 – $3.55 region has acted as a key support multiple times since 2022, reinforcing its importance as a make-or-break zone.
Potential Trap Setup: Current price action could be forming either a bull trap or bear trap, depending on whether price rebounds or breaks down. Weekly candle confirmation will be key.
---
🟢 Bullish Scenario (Upside Reversal)
If price holds and prints a strong bullish candle (e.g., bullish engulfing or long-tailed hammer), expect the following upside targets:
Short-term: $4.75 – $5.88
Mid-term: $7.63 – $9.00
Long-term: $10.37 – $12.49, aligning with prior distribution zones
✅ A breakout from this long accumulation base could trigger a massive short squeeze and renewed buying momentum.
---
🔴 Bearish Scenario (Breakdown)
If DOT closes below $3.55 on the weekly chart:
Confirms breakdown from macro support
Opens downside risk toward $2.30 – $2.00
Would print a new lower low, extending the bear market phase and potentially triggering capitulation
⚠️ Speculative long positions should include tight risk management below $3.50.
---
🧠 Market Sentiment & Strategy
DOT appears to be in a "Capitulation meets Hope" phase—selling pressure is exhausting, but bullish conviction hasn't yet taken control.
Ideal entry zones lie within the current demand range, with tight stops.
Watch for a daily breakout or bullish momentum confirmation next week before committing to positions.
---
📌 Final Takeaway
> DOT is standing at the edge of a cliff—or a launchpad. The $3.55–$4.00 zone has repeatedly been the foundation for rebounds. If history repeats, this may be the beginning of a new uptrend. If not—brace for deeper downside.
⏳ The market is watching. Will DOT break out… or break down?
#DOTUSDT #Polkadot #CryptoTechnicalAnalysis #SupportResistance #CryptoRebound #BearishOrBullish #AltcoinOutlook #CryptoBreakdown #WeeklyChart #AccumulationZone #DOTAnalysis
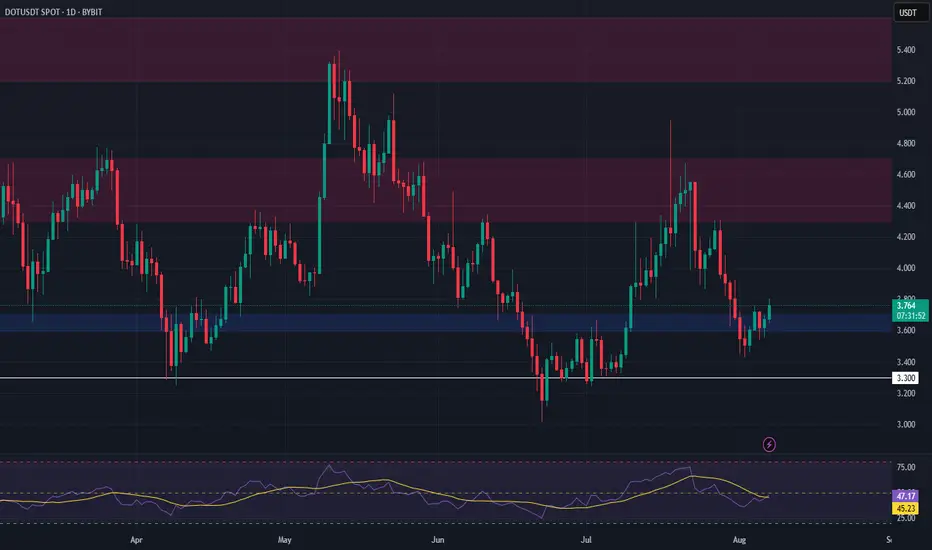
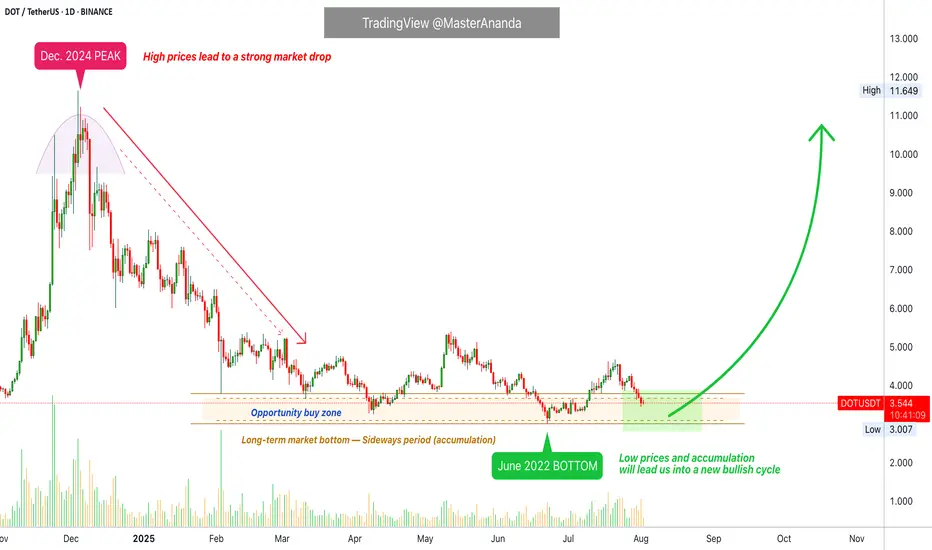
Polkadot · Trading at Bottom Prices · Bullish Scenario ExplainedThe same levels, the same prices, the same support zone. Polkadot is still trading at bottom prices. From the bottom the market tends to grow.
Good morning my fellow Cryptocurrency trader, I hope you are having a wonderful day. Notice the brown lines on the chart. We have the 7-April low, the June 22 low and also the low in March and yesterday, 1 August. This is a bottom range and this is the buy zone.
Polkadot (DOTUSDT) has been trading near this range since February 2025, six months ago. This is a very long—and strong—consolidation period. This much accumulation is surely the preparation for a major market change, a change of trend. A new uptrend. An event that has not happened since 2021.
I think the most important part is to truly understand that a bullish wave develops only from low prices. Notice the peak from December 2024. As soon as prices are high, the market seeks balance and starts to decline. But, when prices are low, an accumulation period develops and afterward a wave of growth. That is what I see happening right now across the market and with this chart. It already happened to hundreds of projects, literally. They all had the same chart.
These projects grew in late 2024, November-December. Then they went into correction in early 2025 until recently. The current low as witnessed on DOTUSDT led to massive growth. Some of these pairs are trading at new all-time highs while others have grown 500% or more. Those trading at the bottom are still early and next in line to move when the market does.
We will be bullish within days, as soon as Bitcoin ends its retrace. I shared in another publication why I believe Bitcoin will recover in the coming days.
Thank you for reading.
Namaste.
Price floor: The opportunity to buy has arrived.Hello friends🙌
According to the decline we had, you can see that the price has reached its historical low, which has given good profits whenever it reaches this low. Now, with capital and risk management, we can buy within the limits of the low and move with it to the specified targets.
🔥Follow us for more signals🔥
*Trade safely with us*
