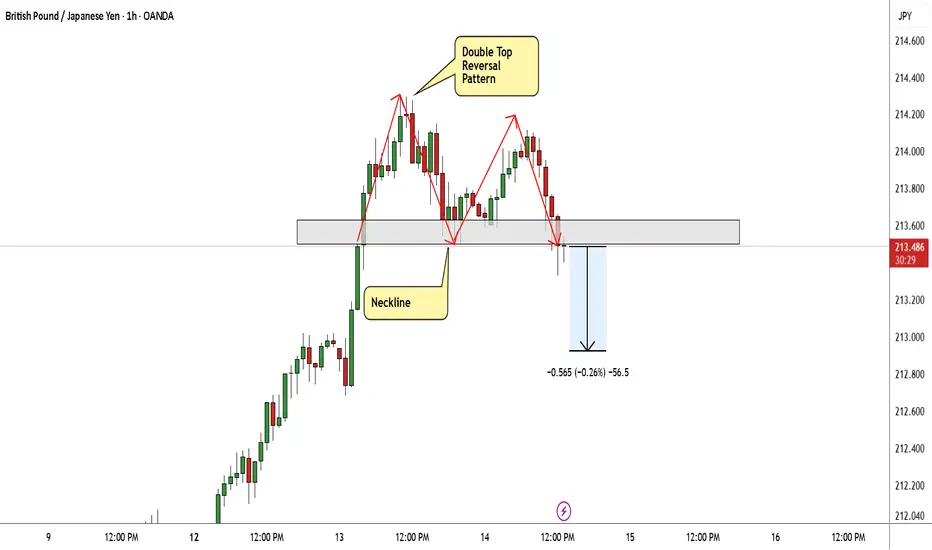
GBP/JPY Made A Reversal Pattern , Short Setup To Get 100 Pips !Here is my 1H Chart On GBP/JPY , And finally the chart made a reversal pattern The price creating a very clear reversal pattern ( double top) and the price made a very good bearish price action now from good res area But until now we have not a clear closure below our neckline to confirm the pattern , so we should wait for clear closure with 1H Candle at least below the neckline to can get a confirmation and enter a sell trade and in this case we can targeting from 50 to 100 pips cuz the high fo
Community ideas
Bullish continuation?GBP/JPY could make a short-term pullback to the support level, which is a pullback support, and could bounce from this level to our take profit.
Entry: 211.43
Why we like it:
There is a pullback support level.
Stop loss: 210.35
Why we like it:
There is a pullback support level.
Take profit: 214.60
Why we like it:
There is a resistance level at the 61.8% Fibonacci projection.
Enjoying your TradingView experience? Review us!
Please be advised that the information presented on TradingView
Litecoin: The Next PumpAfter years of posting my Monero KRAKEN:XMRUSD thesis based on its privacy use case it has finally catapulted into new All Time Highs and entered "price discovery."
So I now look to what is next... focusing on
PATTERN RECOGNITION
FUNDAMENTALS: PRIVACY
THE TRADE
Pattern Recognition
A recent post by Peter Brandt got me to check old, long dormant cryptocurrencies and I checked Litecoin $KRAKEN:LTCUSD.
At first glance of the long term historic chart I can't help but notice the ee
When Will Tesla’s Pilot Take Off?Hello Traders 👋
Hope you all are doing well and trading with discipline. Let’s analyze Tesla from a pure technical perspective and see where the next major move could unfold.
Tesla is trading inside a well-defined rising channel, respecting both the rising support and the rising resistance, which clearly confirms a strong bullish market structure.
After getting rejected from the 458–460 resistance zone, price did not break down. Instead, it formed a higher low on the rising support line, showi
Post-Rally Consolidation, Awaiting CatalystHello everyone,
Bitcoin is no longer in an expansion phase of the uptrend, but has shifted into a consolidation phase following the recent rally.
From a structural perspective, the medium-term uptrend remains intact. Bitcoin continues to print higher highs and higher lows, with price holding above both the EMA 34 and EMA 89, while these two moving averages are still sloping upward. The key point here is that sellers have not been able to trigger any meaningful breakdown, especially failing
Bitcoin - Holding The Middle, Eyes On The EdgeBitcoin continues to trade within a clearly defined range, with price currently positioned in the upper half of that structure. After a strong move away from the lower boundary, the market has shown acceptance above the midpoint, suggesting buyers are still active but now approaching an area where reactions are more likely.
Range Structure And Key Zones
The broader structure remains range-bound, with a well-respected low acting as the base and a clear resistance zone marking the top. The uppe
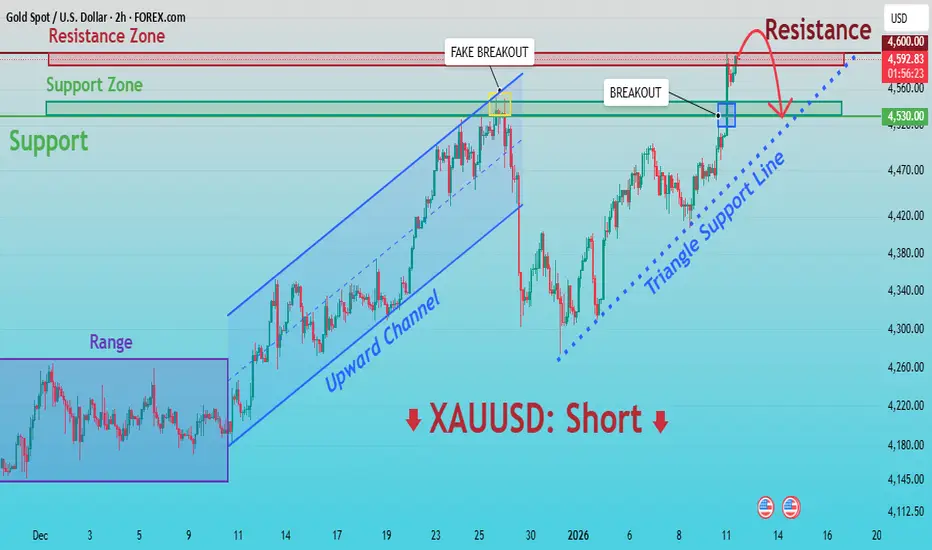
XAUUSD: Critical Supply Zone - Reaction May Define Next MoveHello everyone, here is my breakdown of the current XAUUSD setup.
Market Analysis
Gold is trading within a broader bullish environment, but recent price action shows signs of exhaustion near key resistance. After a period of consolidation inside a clear range, XAUUSD broke to the upside and formed a well-defined upward channel, confirming buyer control. This move brought price into the upper Resistance Zone around 4,590–4,600, where strong selling pressure emerged.
Currently, at this level,
It's not about a strategy. It's about how you see yourself. When I first started trading, after beginners luck period, I honestly believed the strategy was the missing piece that would fix everything, like once I found the right setup the market would finally “make sense,” my losses would stop, and I’d just execute trades like a machine and collect profits on schedule.
So I did what most beginners do, I went on the hunt, watching hours of content, saving charts, screenshotting models, changing my templates, and telling myself I was “learning,” when in
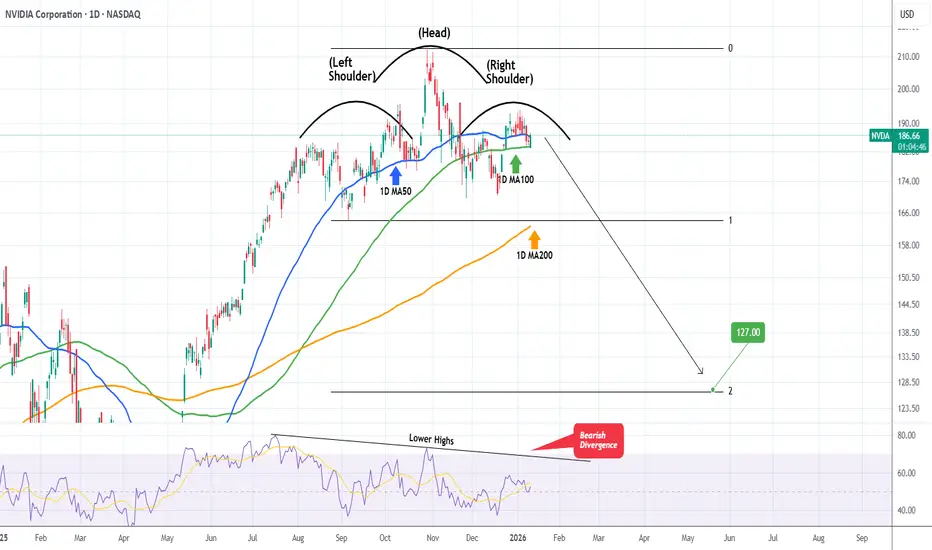
NVIDIA Huge Head & Shoulders forming. $127 technical Target.NVIDIA Corporation (NVDA) is in the process of completing the Right Shoulder of a Head and Shoulders (H&S) pattern, having turned sideways since the October 29 2025 High (ATH).
With the 1D RSI on Lower Highs, i.e. a Bearish Divergence since July 17 2025, it is possible that within a month's time max, the stock will break its Support and the H&S will target its technical extension, the 2.0 Fibonacci at $127.00.
---
** Please LIKE 👍, FOLLOW ✅, SHARE 🙌 and COMMENT ✍ if you enjoy this idea! Also
AUDUSD Trend continuation pattern supported at 0.6637The AUDUSD remains in a bullish trend, with recent price action showing signs of a breakout within the broader uptrend.
Support Zone: 0.6637 – a key level from previous consolidation. Price is currently testing or approaching this level.
A bullish rebound from 0.6637 would confirm ongoing upside momentum, with potential targets at:
0.6756 – initial resistance
0.6780 – psychological and structural level
0.6800 – extended resistance on the longer-term chart
Bearish Scenario:
A confirmed brea
Parabolic Moves Don’t Always End in Collapse — Silver ExplainedI’ve seen many analyses from my colleagues where 1980 and 2011 are used not as upside projections, but as collapse templates for silver.
The argument is simple and visually convincing: silver has already gone parabolic, therefore the next chapter must be a collapse similar to those historical episodes.
I understand the logic.
I don’t predict the future, and I can’t categorically deny that such an outcome is possible.
But here’s where I draw a clear line: similar-looking charts do not guarantee
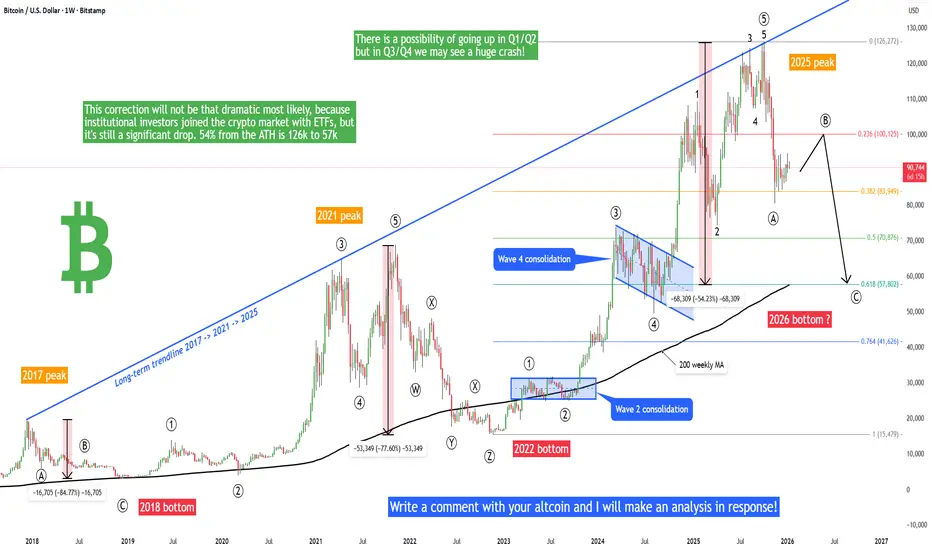
Bitcoin - 2026 roadmap, pump to 100k, then crash to 57k!Is it possible that Bitcoin will go above 100k or 103k in the next weeks/months? And is it possible that Bitcoin will later drop heavily to 57k? Altcoin season during the rise to 103k? I will answer these questions in this post. Write a comment with your altcoin, hit the like button, and I will make an analysis for you in response.
On the chart we can see a long-term linear chart of Bitcoin (2017 - 2026). As we can see, Bitcoin crashed by 85% in 2018 and by 77% in 2022. The next crash is appare
Gold Strengthens as Geopolitical Risk IncreasesGold Strengthens as Geopolitical Risk Increases
Gold continues to respect a bullish market structure, with price developing a clear impulsive sequence followed by shallow corrective waves. The recent pullback found support near the 4,400 zone (wave iv), and price is now pushing higher again, confirming buyers’ control.
The bullish scenario remains intact. A clean continuation higher could first target the resistance zone 4,548.
A breakthrough at the top of the structure 4548 should push GOL
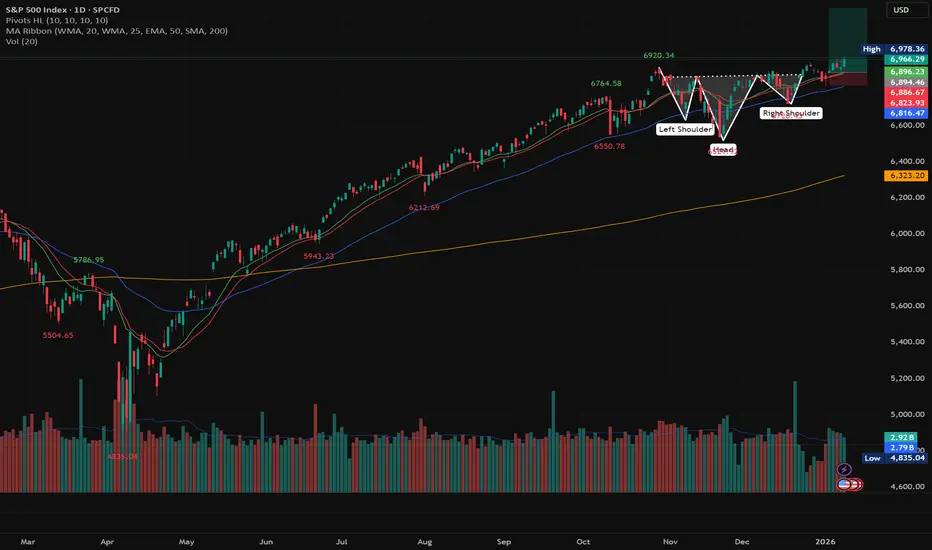
Stocks Shake as Prosecutors Go After Fed Boss Powell. Now What?Wall Street went into the weekend riding record highs — and came back to something that felt more like a political thriller than a macro update.
US stock futures slipped after news broke that the Department of Justice has opened a criminal investigation into Federal Reserve Chair Jerome Powell, sharply escalating President Donald Trump’s long-running standoff with the central bank.
Early Monday morning, Dow DJ:DJI futures fell 200 points , while S&P 500 futures SP:SPX dropped 0.5% and Nas
A letter to myself. (Buy the dip)This is phase one of a global technological financial system. If our parents even parked a fraction of their cash here 10–20 years ago the long-term payoff would have been nice, but they didn't and it's okay because they didn't know. We now have the privilege of choosing to contribute to our financial future in ways that were previously out of reach for everyday people because we couldn't even fathom the future the internet is today.
This data from the adoption curve theory further supports tha
Chart Patterns ranked by reliability (1-8)Chart Patterns as a Strategy (Not a System)
In the world of technical analysis, chart patterns are often marketed as stand-alone trading systems. In reality, their real edge comes from probabilistic structure recognition, not prediction.
The key insight from my large-sample testing (10 years, 200,000+ patterns (Futures, FX)) is this:
Patterns don’t predict direction — they quantify structural bias once price has already revealed intent.
That distinction is what separates profitable traders f
Meta Is Down Nearly 20% Since August. Here's What Its Chart Says"Magnificent Seven" stock Meta Platforms NASDAQ:META has fallen nearly 20% since hitting an all-time high in August, and has also trailed the S&P 500 SP:SPX in various timeframes from three months to one year. Let's see what its chart and fundamental analysis can show us.
Meta's Fundamental Analysis
Meta has been struggling of late, with some on Wall Street wondering if the company -- which owns Facebook and Instagram -- got ahead of itself as far as capex spending on artificial intellig
Developing A Trading Philosophy: Experimenting With IndicatorsIn our last video we were talking about the concept of the causes and effect on price action. What causes price to move in a certain direction vs. what the effects of the price action.
We came to the conclusion, that indicators are not causes of price action, but they are a different way of looking at the price. Therefore, price action dictates what happens to the indicator.
On the other hand things like market structure elements, supply and demand areas, order block, order flows, imbalances
Challenges of Fading and OverextensionIntroduction
Fading is a strategy where a position is taken against the prevailing move, based on the expectation that it is overextended and likely to reverse. While mean reversion is a valid market phenomenon, some methods are built on incomplete beliefs about how markets operate.
From Normal to Deviation
Markets can be evaluated relative to their recent or average behavior. Price movement within these bounds is considered normal, while a notable move beyond them is referred to as a deviat
How to Trade with Volume Profile in TradingView Master Volume Profile using TradingView's powerful charting tools in this step-by-step tutorial from Optimus Futures.
Volume Profile is an advanced charting indicator that helps traders identify key support and resistance levels, areas of price acceptance, and potential breakout zones by showing where trading activity is concentrated at different price levels.
What You'll Learn:
Understanding Volume Profile as a price-based volume tool that displays trading activity horizontally across pric
NFLX: Massive Head-Shoulder-Formation!Hello There,
welcome to my new analysis about the Netflix stock (NFLX). Recently, I spotted major underlying factors that will be highly determining for the whole upcoming price action. The stock already dumped heavily bearishly towards the downside, almost declining over $150 B in market cap. Such a major pullback is in most cases not followed by an immediate market recovery. Most of the time, such a determining price action is likely to move on forward in the direction it came from.
When loo
Where Is Oil Heading To ? - /CL Analysis 1) Technical Perspective: Support & Resistance
~$65 was a support zone earlier (2021–2024). In 2025–26, that $65 area now often acts as resistance. Prices have come down toward $55
2) Fundamental Drivers Behind the Downtrend
Oil has been in a multi-year decline from the highs seen in 2022 after the Russia–Ukraine war spike. A combination of oversupply and weaker demand has kept price pressure on:
• 2025 saw a large annual price drop due to persistent oversupply and slow demand.
• EIA and
Breakout Candles Decoded a Complete AnatomyHello traders, This is mine first educational idea of 2026, and I wanted to start the year by sharing a concept that looks simple on charts but is deeply misunderstood in real trading and why every breakout is meant to be chased some are meant to be trusted, some avoided, and some waited upon and why Some Breakouts Fly and others fail? Let's decode that!
So most traders focus on whether a breakout happened.
Professional traders focus on how the breakout happened ?
In this publication we’ll bre
Dollar Off to Weak Start After Worst Year Since 2017. Now What?The US dollar rang in 2026 without much enthusiasm. No fireworks. No flex. Just a quiet shuffle out of the gate that felt eerily familiar to anyone who shoved cash in FX markets last year.
After logging its worst annual performance since 2017, the greenback has started the new year on the back foot — and traders are wondering whether this is merely a breather or the beginning of something more structural.
If currencies had personalities, the dollar currently looks like it stayed up too late in