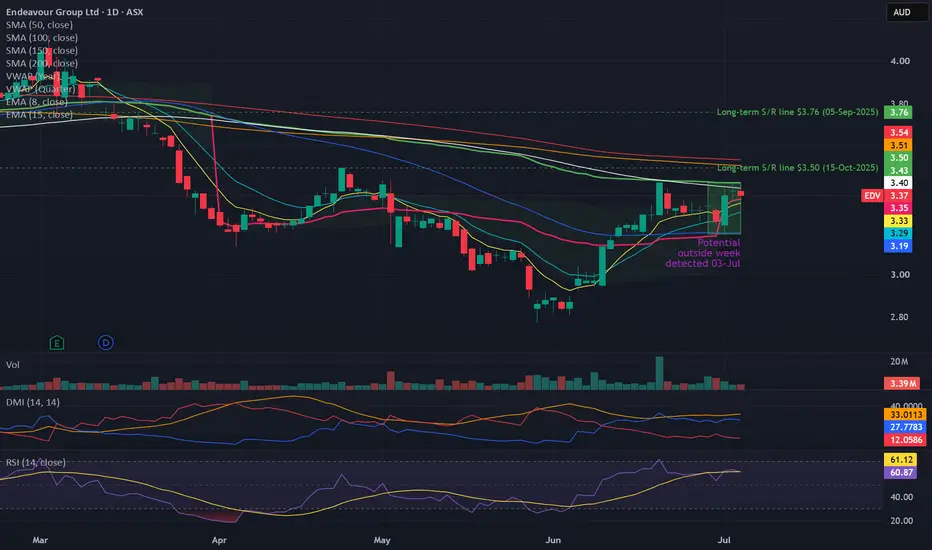
Potential outside week and bullish potential for EDVEntry conditions:
(i) higher share price for ASX:EDV above the level of the potential outside week noted on 2nd July (i.e.: above the level of $3.43).
Stop loss for the trade would be:
(i) below the low of the outside week on 1st July (i.e.: below $3.19), should the trade activate.
EDV
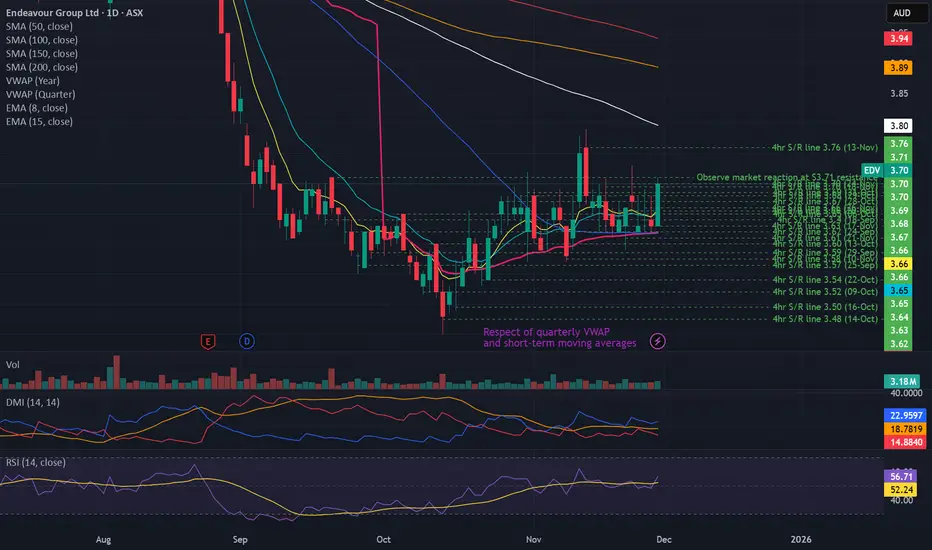
Bullish potential detected for EDVEntry conditions:
(i) higher share price for ASX:EDV along with swing up of indicators such as DMI/RSI, and
(ii) observing market reaction around the $3.71 resistance area.
Depending on risk tolerance, the stop loss for the trade would be:
(i) below the recent swing low of $3.57 of 10th November, or
(ii) below the recent swing low of $3.45 of 14th October.
Potential key reversal bottom detected for EDVLevel of interest: Prior support/resistance level from previous trade at $5.00 even (key support/resistance area to observe).
Stop loss for the trade involving ASX:EDV (and indication that this trade is an absolute 'no-go') is any trade below the low of the signal day of 5th September (i.e.: any trade below $4.92).
Long Duration Bonds (TLT)We haven't had to manage cycle risk, on a sustained basis to the downside, since 2008-2009 and 2000-2002.
The biggest problem in financial markets right now is there's no Event.
This is just Cycle-Risk and we haven't had to manage cycle risk - on a sustained basis to the downside - since '08-'09, and 2000-2000 before then.
The Fed is in QT. Financial conditions are still in accommodative territory, according to the Financial Conditions Index, and we have a long way to go.
We will not see any do
More downside for long term durations It appears that there is at least 15% more downside to EDV before a possible trend reversal. I have two separate channels made up. If support fails EDV may find it self within the lower channel. The long term economic picture still seems to be uncertain. With more clarity coming with time. A bounce or failure at the long term support could very well happen within the next 2-6 weeks.
Low Cost ETFs That Beat The Market Low cost ETF's that beat the market:
(Note these lean Growth, Tech, & Large-Cap Heavy)
Add slow and steady now; Add heavy when we retest the black trend-line
-------------------------------------------------------------------------------------
Ticker: SPYG
Name: SPDR Portfolio S&P500 Growth ETF
Last Close: 44.85
Net Assets ($M): 7596
Expense Ratio: 0.04%
Dividend Yield: 1.3%
5-Yr Average Dividend Yield Growth: 10.5%
YTD Returns Vs S&P500: 10.6%
2-yr Annualized Returns Vs S&P500: 5.2%
3-yr A
EDV - Bullish breakout, bad new for S&P?EDV has done well since the S&P cooled off at the beginning of the year. The two have a predictably negative correlation, however, even though the S&P has been doing relatively well since mid-February, a weak pennant has formed in EDV and there are signs of a positive breakout.
T
EDV play (TLT same thing)1. If breakout, buy with stop. If breakout confirmed, buy more.
2. If dips, wait until lower trend line (support) is hit. If support holds, buy this dip with stop and hold (if worked) until upper trend line (resistance) is hit then go back to 1.
If aggressive, can short dip, short broken support.