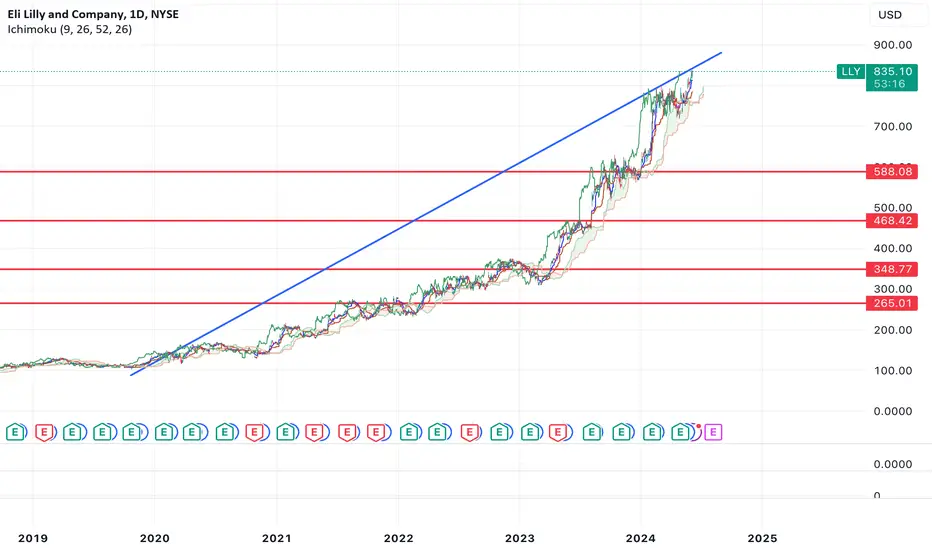
$LLY look out below $265 bottom coming soonNYSE:LLY looks like it's topping up here. Anytime you see a chart that has gone straight up like this, you know the fall is going to be painful.
I think we'll top within the next week or two and then we're going to start the bear market that goes all the way down to $265 before it truly bounces.
Why do I think this? If you create a parabola, price is starting to break through it which means we're likely to see a 80%+ correction once the trend changes.
On top of this, RSI is in extreme overbought territory.
If you're long, I'd set stops where you're comfortable with gains because once this move down happens, months worth of gains will evaporate.
Elililly
LLY Eli Lilly Options Ahead of EarningsIf you haven`t bought the 6.20X call:
nor the 4.10X gain:
Then analyzing the options chain and the chart patterns of LLY Eli Lilly prior to the earnings report this week,
I would consider purchasing the 860usd strike price Calls with
an expiration date of 2024-7-19,
for a premium of approximately $9.20.
If these options prove to be profitable prior to the earnings release, I would sell at least half of them.

ELI LILLY Preparing for the final buy opportunity.Eli Lilly is on a very steady bullish technical outlook on the 1D timeframe (RSI = 62.145, MACD = 9.380, ADX = 18.580) as it has been trading inside a Channel Up since January 2023. The current bullish vessel within this pattern is a Rising Wedge. As you can see, the two Wedges prior have a last break under the 1D MA50 before rallying to a HH at the top of the Channel Up. The 1D RSI has already crossed over its LH trendline so every pullback that comes in the next 2 weeks, is in our opinion the last buy opportunity. Our target is approximatelly a +45% rise (TP = 1000) which is the rise that all bullish structures prior experienced.
See how our prior idea has worked out:
## If you like our free content follow our profile to get more daily ideas. ##
## Comments and likes are greatly appreciated. ##

AMGN Rises as CEO Celebrates Growth in Experimental Obesity DrugAmgen Inc.'s shares ( NASDAQ:AMGN ) rose by 15.9% when the market opened on Friday, marking its biggest intraday rise since July 2009. The company has emerged as a potential competitor to Eli Lilly & Co. and Novo Nordisk A/S, which currently dominate the weight-loss market. Demand for anti-obesity drugs like Zepbound and Wegovy is so strong that Intelligence's estimate for $80 billion in annual sales by 2030 looks conservative. William Blair analyst Matt Phipps sees MariTide as having multi-blockbuster potential, boosting his rating on Amgen stock to outperform.
Shares of Denmark's Novo Nordisk fell as much as 5.3% after the Amgen CEO's comments. Optimism over towering sales of its Wegovy and Ozempic drugs have pushed Novo's market value above $500 billion, reinforcing its position as Europe's most valuable listed company. The stock has more than quadrupled since the start of 2020.
MariTide has excited investors because it's taken less frequently than the top-selling treatments from Novo and Lilly. Patients given a monthly injection of the drug lost up to 14.5% of their body weight in 12 weeks, according to a small early-stage study published in February in the journal Nature Metabolism. Some people kept weight off for up to 150 days after stopping the drug, the findings showed.
Amgen ( NASDAQ:AMGN ) is already investing in building out production capacity for MariTide, even though it's still in mid-stage studies and hasn't been submitted for regulatory approval. Amgen is planning late-stage studies in obesity, obesity-related conditions, and diabetes, likely delivered in a handheld autoinjector used monthly. Amgen will focus on MariTide and discontinue developing another earlier-stage drug called AMG 786.

Eli Lilly's Stock Surges 4.77% on Weight-Loss Wonder DrugEli Lilly & Company (NYSE: NYSE:LLY ) has sent shockwaves through the pharmaceutical industry with the meteoric success of its weight-loss drug Zepbound, propelling the company's stock to new heights despite a mixed first-quarter performance. With sales of Zepbound surpassing Wall Street's projections by a staggering margin, Eli Lilly has raised its sales outlook for the year, overshadowing slight revenue dips from other key products.
Zepbound's Triumph and Guidance Boost:
In a remarkable turn of events, Zepbound emerged as the star performer in Eli Lilly's ( NYSE:LLY ) portfolio, surpassing sales forecasts by a substantial margin. With first-quarter sales reaching $517.4 million, well above the expected $373 million, Zepbound's success has prompted Eli Lilly to raise its sales guidance for the year by a staggering $2 billion. This unexpected surge in demand for the weight-loss drug has underscored Eli Lilly's position as a frontrunner in the pharmaceutical industry and has reignited investor confidence in the company's growth prospects.
Challenges and Opportunities in the Diabetes Market:
While Zepbound's success has captured headlines, Eli Lilly ( NYSE:LLY ) faces challenges in its diabetes portfolio, particularly with drugs like Mounjaro and Trulicity. Despite a surge in sales for Mounjaro, both drugs fell short of analyst expectations, highlighting the competitive landscape in the diabetes market. However, with plans to expand production significantly in the second half of the year, Eli Lilly remains optimistic about its ability to meet the growing demand for diabetes treatments and capitalize on emerging opportunities in the market.
Analyst Insights and Market Response:
Analysts have offered mixed assessments of Eli Lilly's performance, with some highlighting the company's robust guidance raise and the continued strength of Zepbound, while others have raised concerns about softer sales in the GLP-1 franchise. However, overall sentiment remains positive, with analysts reaffirming their bullish outlook on Eli Lilly's stock and emphasizing the company's strategic initiatives to drive growth and innovation.
Looking Ahead:
As Eli Lilly ( NYSE:LLY ) charts its course forward, all eyes are on the continued success of Zepbound and the company's ability to navigate challenges in the diabetes market. With a bolstered sales outlook and a commitment to expanding production capacity, Eli Lilly ( NYSE:LLY ) is poised to capitalize on evolving consumer preferences and emerging opportunities in the pharmaceutical landscape.

ELI LILLY Going to $1050 but after a 1D MA50 correction.Eli Lilly (LLY) has basically turned sideways since the February 16 High. The dominant pattern is a Channel Up since the March 07 2023 Low and can be divided into 3 Bullish Waves that delivered rallies between +45% and +52%. Every time the price hit the 1D MA50 (blue trend-line), it was a buy opportunity.
The 1D RSI in particular has a Buy Zone, which coincided with all those dip buy opportunities within the Channel Up. As a result, since the stock has already completed a +45% rise from the October 31 2023 Low, we do expect a pull-back to start soon towards the RSI Buy Zone, but only after it rises a little again and forms a Lower High on the RSI, which would be consistent with the previous top formation on the Channel Up.
In any case, at any point the RSI hits its Buy Zone, we will position ourselves with a long and aim for a new +45% rise. Rough target from the current projection is $1050. Notice how efficiently the peak and bottom formations are caught by the Sine Waves. A very symmetric pattern for the long-term indeed.
-------------------------------------------------------------------------------
** Please LIKE 👍, FOLLOW ✅, SHARE 🙌 and COMMENT ✍ if you enjoy this idea! Also share your ideas and charts in the comments section below! This is best way to keep it relevant, support us, keep the content here free and allow the idea to reach as many people as possible. **
-------------------------------------------------------------------------------
💸💸💸💸💸💸
👇 👇 👇 👇 👇 👇

ELI LILLY Is a -20% correction possible?Eli Lilly (LLY) gave us the best possible buy entry at the bottom of the Channel Up last time we gave a call on it (December 14 2023, see chart below) and not hit our $705.00 Target but also aggressively broke above the pattern:
In order to grasp the magnitude of that move, this time we zoom out on the 1W time-frame where we see the long-term pattern since LLY's parabolic move started, in mid 2018 following 3 years of consolidation. The pattern that emerged since is a 6-year logarithmic Channel Up, which since 2023 has gone extremely parabolic.
The key characteristic on this long-term price action is the unique pattern that the 1W MACD forms, a Bearish Cross followed by a Bullish Cross. Four such occurrences since 2018 have caused the stock to form a Higher High top at a minimum 2 weeks and maximum 10 weeks after the Bullish Cross. Currently we are on the 3rd week since the latest 1W MACD Bullish Cross and if it extends to 10 weeks, we can technically expect the new top by April 08 2024.
However, the 1st red 1W candle following the Bullish Cross on those 4 past occurrences has always been the top, or near it. Given the fact that LLY is so close to the top of the 6-year Channel Up, we can expect that a correction will start soon. The minimum correction has been -17.44% and the maximum -23.23% (2 occasions out of the 4). Also before a new long-term rally started, the price hit the 1W MA50 (blue trend-line). Long-term investors can wait for such a contact before buying again heavily Eli Lilly for a new 12-month run.
-------------------------------------------------------------------------------
** Please LIKE 👍, FOLLOW ✅, SHARE 🙌 and COMMENT ✍ if you enjoy this idea! Also share your ideas and charts in the comments section below! This is best way to keep it relevant, support us, keep the content here free and allow the idea to reach as many people as possible. **
-------------------------------------------------------------------------------
💸💸💸💸💸💸
👇 👇 👇 👇 👇 👇

LLY Eli Lilly Options Ahead of EarningsIf you haven`t bought LLY before the previous earnings:
Then analyzing the options chain and the chart patterns of LLY Eli Lilly prior to the earnings report this week,
I would consider purchasing the 680usd strike price Calls with
an expiration date of 2024-2-16,
for a premium of approximately $15.35.
If these options prove to be profitable prior to the earnings release, I would sell at least half of them.

Eli Lilly Stock Soars on Robust Fourth-Quarter PerformanceEli Lilly (NYSE: NYSE:LLY ) has once again defied expectations, propelling its stock to new heights with a stellar fourth-quarter performance that surpassed even the most optimistic forecasts. The pharmaceutical giant's earnings report, released early Tuesday, showcased a remarkable surge in both revenue and adjusted earnings, fueled by the successful launch of its groundbreaking weight loss drug, Zepbound, and buoyed by robust sales of its flagship diabetes treatment, Mounjaro.
Earnings Review
Earnings figures reveal a standout quarter for Eli Lilly (NYSE: NYSE:LLY ), with adjusted profit soaring to $2.49 per share, significantly outpacing the consensus estimate of $2.30 per share among analysts surveyed by FactSet. This remarkable feat represents a substantial increase from the year-earlier period, where earnings stood at $2.09 per share, underscoring the company's impressive growth trajectory.
Revenue Result
Similarly, Eli Lilly's (NYSE: NYSE:LLY ) fourth-quarter revenue surged to $9.35 billion, marking a notable 28% increase from the same period last year and surpassing analysts' expectations of $8.95 billion. This remarkable revenue surge can largely be attributed to the stellar performance of Zepbound, the company's newly approved weight loss drug, which generated a staggering $175.8 million in sales during its inaugural quarter on the market.
Analysts Views
The success of Zepbound has exceeded even the loftiest projections, with analysts predicting the potential for over a billion dollars in sales within its first year alone, positioning it as a potential game-changer in the pharmaceutical industry. Moreover, with its groundbreaking mechanism of action and promising efficacy profile, Zepbound holds the potential to become one of the most significant drugs in Eli Lilly's (NYSE: NYSE:LLY ) portfolio and a major revenue driver in the years to come.
The Mounjaro
Meanwhile, the continued strong performance of Mounjaro, Eli Lilly's (NYSE: NYSE:LLY ) blockbuster diabetes treatment, further bolstered the company's financials, with fourth-quarter sales soaring to $2.21 billion, far surpassing analysts' expectations. This remarkable growth can be attributed to both increased demand and higher realized prices, underscoring the enduring strength of Eli Lilly's (NYSE: NYSE:LLY ) diabetes franchise.
Challenges
However, amidst the impressive financial results, Eli Lilly (NYSE: NYSE:LLY ) also faces challenges, notably in its diabetes portfolio, where lower prices for Trulicity and Humalog offset some of the gains from Mounjaro. Despite this setback, the company remains optimistic about its long-term prospects, buoyed by the continued success of its key products and a robust pipeline of innovative therapies.
Future Outlook
Looking ahead, Eli Lilly (NYSE: NYSE:LLY ) has provided a bullish outlook for the full year, with projected adjusted earnings in the range of $12.20 to $12.70 per share and revenue expected to reach $40.4 billion to $41.6 billion. These optimistic forecasts reflect the company's confidence in its ability to sustain its growth momentum and capitalize on emerging opportunities in the evolving healthcare landscape.
Conclusion
In conclusion, Eli Lilly's (NYSE: NYSE:LLY ) fourth-quarter performance stands as a testament to its resilience, innovation, and unwavering commitment to advancing patient care. With its groundbreaking therapies and strong financial performance, Eli Lilly (NYSE: NYSE:LLY ) is well-positioned to deliver sustained value to its shareholders while continuing to make a meaningful impact on global healthcare.
As Eli Lilly (NYSE: NYSE:LLY ) prepares to engage with investors during its earnings call, all eyes will be on the company as it provides insights into its strategic priorities, pipeline progress, and plans for driving future growth. Amidst a backdrop of rapid innovation and evolving market dynamics, Eli Lilly's (NYSE: NYSE:LLY ) continued success underscores its status as a powerhouse in the pharmaceutical industry and a beacon of hope for patients worldwide.

Eli Lilly Breaks New Ground With Weight Loss Drug Offering Eli Lilly - NYSE:LLY
Earnings
Rep: $2.49 ✅ Exp: $2.29 - 8.45% HIGHER
Revenue
Rep: $9.35b ✅ Exp: $8.94b - 4.55% HIGHER
Company Summary
Eli Lilly is the worlds 9th largest company by market cap at $670b and they have reported positive earnings and revenue both coming in higher than expected for Q4 2023. The pharmaceutical giant booked fourth-quarter revenue of $9.35 billion, up 28% from the same period a year ago. A massive result that is reflected in the chart and pre-market surge in price per a share from €706 - €740 👀
Eli develop and manufacture a series of medications with their top drugs being for diabetes and cancer.
The diabetes drug Trulicity generated more than $7.4 billion in revenue for Eli Lilly in 2022 accounting for more than one-quarter of the company's top line, which totaled $28.5 billion. Meanwhile for 2023, Trulicity, reported $1.67 billion in revenue. That’s down 14% from the same period a year go however remains a large revenue generator.
Mounjaro booked $2.21 billion in sales for the fourth quarter and remains one of the companies core diabetes products.
The Q4 2023 results are the first to include sales of Eli Lilly’s new weight loss drug Zepbound, which won FDA approval in early Nov 2023. Zepbound resulted in $175.8 million in sales for Q4. Analysts are expecting a minimum of $1 billion in sales for the 2024 period and some are claiming that Zepbound could become the biggest drug of all time. Do you feel that AI style narrative euphoria building here?
Now more importantly, Lets check out this chart
The Chart
The chart here really caught my attention, its one of thee strongest long term charts I have come across and it keeps making higher double bottoms off higher moving averages.
The OBV is increasing still and the support line might be a good line to watch got an entry bounce or a break down (exit) - a trigger level.
PUKA

ELI LILLY targeting $705.00 if the 1D MA100 holds.Eli Lilly (LLY) has been on an incredible run ever since our March 01 buy signal (see chart below) that even broke above Channel Up:
We have been strong supporters of the company's fundamentals and those are translated into strong technical bullish patters, offering solid buy opportunities. Another such opportunity exists now as the price is trading around the 1D MA50 (blue trend-line) near the bottom of the 2023 Channel Up.
As long as the 1D MA100 (green trend-line), which is exactly on the Channel's bottom, holds, we remain bullish, targeting the 2.382 Fibonacci extension (similar to the May 22 High) at $705.00. If the 1D MA100 breaks though, we will take the loss and sell instead targeting the 1D MA200 (orange trend-line) at $500.00 where a stronger buy opportunity exists.
-------------------------------------------------------------------------------
** Please LIKE 👍, FOLLOW ✅, SHARE 🙌 and COMMENT ✍ if you enjoy this idea! Also share your ideas and charts in the comments section below! This is best way to keep it relevant, support us, keep the content here free and allow the idea to reach as many people as possible. **
-------------------------------------------------------------------------------
💸💸💸💸💸💸
👇 👇 👇 👇 👇 👇

ELI LILLY Expected to rally above 700 if these conditions hold.LLY is holding the 1D MA50 on a neutral 1D technical outlook (RSI = 47.021, MACD = 2.060, ADX = 24.740), which indicates a strong demand level for the stock. The 1D RSI which is under a LH trendline shows that the stock price is at a pre bullish breakout accumulation like the last week of July and early August. If it holds the line, we will buy and aim a +30% rise (TP = 710.00), following a regression of -8% on each top.
## If you like our free content follow our profile to get more daily ideas. ##
## Comments and likes are greatly appreciated. ##

ELI LILLY Next bullish phase starts. Target 670.Eli Lilly / LLY stopped its short term decline yesterday a little over the 1day MA50.
The green 1day candle signals the start of the new bullish phase inside this double Channel Up.
The 1day RSI is on a similar pattern as August 3rd.
Assuming a declining rate of growth on each Higher High, buy and target 670 (+30% from the recent bottom).
Follow us, like the idea and leave a comment below!!

ELI LILLY Our gem on the verge of making a paradigm shift.Eli Lilly and Company (LLY) has long been one of our best investments a real gem that even withstood and was practically unaffected by the 2022 inflation crisis. For long we have been using the Fibonacci Channel to display LLY's parabolic nature having broken above the 2.0 Fibonacci extension last May.
This time the price reversed much quicker than technically expected and is attempting again to break the top (Higher Lows trend-line) of the Channel Up that started in 2020. If it closes above it, then we wil target the 3.0 Fibonacci Channel extension at $700. If it gets rejected and stays within the Channel Up, we will sell and target the recent Support at $520.
Note that a break above this 3-year Channel Up may constitute a paradigm shift as the stock has never hit a new upper Fibonacci level that quickly (remember it broke above the 2.0 Fib just 5 months ago). This can transcend LLY into an even more aggressive bullish nature that we can't yet quantify.
-------------------------------------------------------------------------------
** Please LIKE 👍, FOLLOW ✅, SHARE 🙌 and COMMENT ✍ if you enjoy this idea! Also share your ideas and charts in the comments section below! This is best way to keep it relevant, support us, keep the content here free and allow the idea to reach as many people as possible. **
-------------------------------------------------------------------------------
💸💸💸💸💸💸
👇 👇 👇 👇 👇 👇

ELI LILLY Needs to correct a little more. Massive buy after.Eli Lilly has completed 3 red weeks in a row. The parabolic rise it is seeing for years is seen accurately on this Fibonacci Channel.
Every such price peak, pulled back to under the MA100 (1d), which is now at 492.43, in order to gather buyers.
Trading Plan:
1. Sell on the current market price.
Targets:
1. 490 (between the MA100 (1d) and the Fibonacci 2.0 level.
Tips:
1. The MACD (1d) is just formed a Sell Cross. Only once since 2018 has a Sell Cross failed to deliver a sizeable drop.
Please like, follow and comment!!

ELI LILLY: Possible to start a strong multi week correction.Eli Lilly has seen enormous growth over the past few years and in particularly in 2023. This Channel Up on the log chart's 1W timeframe is the best depiction of the long term trend. The 1W outlook got extremely overbought technically three weeks ago (RSI = 68.989, MACD = 46.590, ADX = 60.019) and is now correcting. The rejection took place at the top of the Channel Up.
This is a hint that investors should be exiting LLY and not entering. Historically the most efficient level to buy is on the 1W MA50 with a max extension to the 1W MA100. That is our entry strategy. Don't take chances and take the best possible entry. This stock will reward us enormously in 2024.
## If you like our free content follow our profile to get more daily ideas. ##
## Comments and likes are greatly appreciated. ##

ELI LILLY Hit the top of the 4-year Channel. Relief sell-off?Earlier this year we gave a strong buy signal on Eli Lilly and Company (LLY) on March 01 (see chart below) where we called for the most optimal buy entry exactly at the bottom of the bullish pattern:
The price has now hit (last week) the top of the 4 year logarithmic Channel Up, highly overbought with the RSI on the 1W time-frame reaching 84.30, breaking above the August 16 2021 High. As last week's 1W candle closed in red (the first after 5 straight bullish weeks) this is considered so far a Higher Highs rejection and calls for an early sell signals towards the end of October, targeting the 1D MA100 (red trend-line) at $500.00, where the stock will start turning into a buy opportunity again (assuming the RSI is below 55.00).
-------------------------------------------------------------------------------
** Please LIKE 👍, FOLLOW ✅, SHARE 🙌 and COMMENT ✍ if you enjoy this idea! Also share your ideas and charts in the comments section below! **
-------------------------------------------------------------------------------
💸💸💸💸💸💸
👇 👇 👇 👇 👇 👇

ELI LILLY Approaching the top of the Channel. Sell opportunity.Last time we looked at Eli Lilly and Company (LLY) was on March 01 (see chart below) where we called for the most optimal buy entry exactly at the bottom of the bullish pattern:
The price is now approaching the top of the 3 year logarithmic Channel Up, highly overbought with the RSI on the 1W time-frame at 80.00. This gradually calls for a sell towards the end of August, targeting the 1D MA100 (red trend-line) at $480.00, where the stock will turn into a buy opportunity again.
-------------------------------------------------------------------------------
** Please LIKE 👍, FOLLOW ✅, SHARE 🙌 and COMMENT ✍ if you enjoy this idea! Also share your ideas and charts in the comments section below! **
-------------------------------------------------------------------------------
💸💸💸💸💸💸
👇 👇 👇 👇 👇 👇

LLY Eli Lilly Options Ahead of EarningsAnalyzing the options chain and the chart patterns of LLY Eli Lilly prior to the earnings report this week,
I would consider purchasing the 450usd strike price Calls with
an expiration date of 2023-8-11,
for a premium of approximately $11.70.
If these options prove to be profitable prior to the earnings release, I would sell at least half of them.
Looking forward to read your opinion about it.

ELI LILLY on the best buy opportunity of the year!Eli Lilly and Company (LLY) has been trading within a Channel Up pattern since the October 30 2020 low exactly on the 1W MA100 (red trend-line). As the 1D RSI turned oversold below the 30.00 barrier, while the price touched the bottom (Higher Lows trend-line) of the Channel Up, it has filled all conditions for the most optimal buy level of the year. There have been another three similar oversold events, each on one year since 2020.
Once the price breaks above the 1D MA200 (orange trend-line) again, which you can use as confirmation and take the buy after it, we'll set a target at $390.00 on a 4 month horizon.
-------------------------------------------------------------------------------
** Please LIKE 👍, FOLLOW ✅, SHARE 🙌 and COMMENT ✍ if you enjoy this idea! Also share your ideas and charts in the comments section below! **
-------------------------------------------------------------------------------
💸💸💸💸💸💸
👇 👇 👇 👇 👇 👇

$LLY Keep on your portfolio!Eli Lilly and Company is showing a strong momentum ahead of earning report.
its one of by favorite ones.
--TradeWise--

7/17/22 LLYEli Lilly and Company ( NYSE:LLY )
Sector: Health Technology (Pharmaceuticals: Major)
Market Capitalization: $315.073B
Current Price: $331.60
Breakout price: $334.70
Buy Zone (Top/Bottom Range): $314.00-$292.90
Price Target: $364.20-$367.50 (2nd)
Estimated Duration to Target: 112-120d (2nd)
Contract of Interest: $LLY 10/21/22 350c
Trade price as of publish date: $13.50/contract

3/13/22 LLYEli Lilly and Company ( NYSE:LLY )
Sector: Health Technology (Pharmaceuticals: Major)
Market Capitalization: $253.61B
Current Price: $266.30
Breakout price: $270.95 (hold above)
Buy Zone (Top/Bottom Range): $262.45-$247.10
Price Target: $308.00-$310.40
Estimated Duration to Target: 84-90d
Contract of Interest: $LLY 6/17/22 300c
Trade price as of publish date: $5.90/contract
