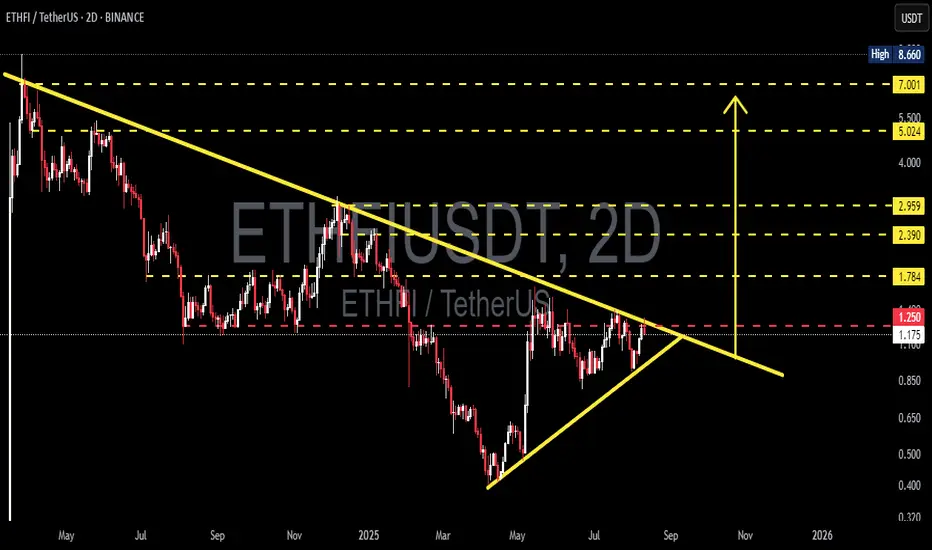
ETHFI/USDT — Descending TrendLine: Breakout Setup?Will ETHFI Recover From Bearish Pressure? 👀
The ETHFI/USDT chart on the 2D timeframe is still moving under medium-term bearish pressure, with the market structure forming a clear Descending TrendLine since the previous price peak. 📉
This trendline has become a dynamic resistance area that has continuously suppressed price movement over the past several months. ⚠️
Currently, the price is approaching the end of the trendline and entering a narrow consolidation zone. Conditions like this often s
Ethfitrend
ETHFI/USDT Approaching Critical Demand — Bounce or Breakdown?On the 3D timeframe, ETHFI/USDT remains in a medium to long-term downtrend. After failing to hold the distribution area around 1.4 – 1.7, price continued to form lower highs and lower lows, confirming strong bearish control. Currently, price is declining and approaching a major demand zone (yellow box) located at 0.51 – 0.41.
---
Pattern & Market Structure Explanation
1. Primary Trend: Bearish Continuation
Clear Lower High (LH) and Lower Low (LL) structure.
Every bullish attempt is rejecte
ETHFI/USDT – Critical Decision Point| Accumulation or Breakdown?ETHFI is currently trading within its most critical zone since mid-year — the 1.00–0.85 range, which has long acted as the last stronghold of buyers. This area is a battle zone between large-scale accumulation or the final signal of distribution.
After facing prolonged downward pressure and failing to reclaim resistance at 1.80, the price is now retesting a strong demand zone — the same area that triggered a major rally earlier this year. The reaction from this region will define ETHFI’s next m
ETHFI/USDT — Symmetric Triangle at the Decision Point!The chart shows a symmetric triangle pattern (descending resistance + ascending support) approaching its apex. Price is currently testing the descending resistance area around 1.25 (red label) — a major decision point. Key horizontal targets/support levels are already marked on the chart (yellow).
---
Pattern Description
* Pair: ETHFI / USDT, 2-Day timeframe.
* Previous long-term trend: bearish (descending resistance line from the left).
* After bottoming near \~0.32–0.40, price formed higher
ETHFI/USDT – BREAKOUT ALERT! Descending Trendline Under Pressure
After over a year of relentless bearish pressure, ETHFI is now approaching a critical technical juncture that could mark the beginning of a major trend reversal. The chart displays a long-term descending trendline, and bulls are now challenging it with growing strength. This setup could lead to a powerful breakout and a potential trend shift.
🧩 Technical Pattern Overview:
🔸 Descending Trendline Resistance – Established since April 2024, acting as a dominant resistance across multiple retests
#ETHFI (SPOT) Entry ( 1.220- 1.620) T. (4.730) SL(.1.187)BINANCE:ETHFIUSDT
entry range ( 1.220- 1.620)
Target1 (2.405) - Target2 (3.151)- Target3 (3.830)- Target4 (4.730)
SL .1D close below (1.187)
______________________________________________________________
Golden Advices.
********************
* collect the coin slowly in the entry range.
* Please calculate your losses before the entry.
* Do not enter any trade you find it not suitable for you.
* No FOMO - No Rush , it is a long journey.
Useful Tags.
****************
My total posts
www.tradingvi