ETH-----Sell around 3930, target 3850 areaOctober 30th Ethereum (ETH) Contract Technical Analysis:
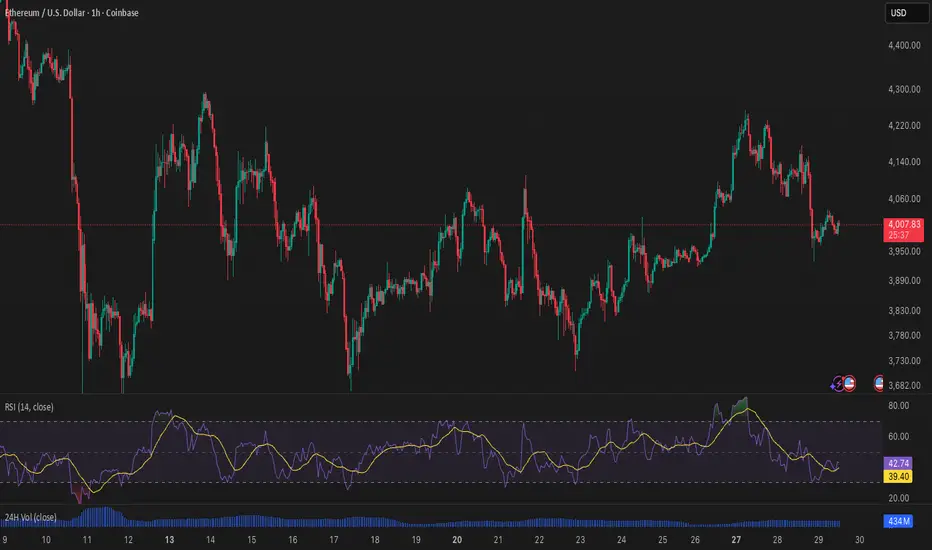
On the daily chart, yesterday's close was a small bearish candle, indicating a continuous decline. The price is below the moving average, and the accompanying indicators show a golden cross with decreasing volume. While the overall trend is clearly downward, attention should be paid to the possibility of a breakout and continuation of the downward movement. In the short term, focus on range-bound trading, with resistance around the 3950 area. The hourly chart shows a generally downward trend with some volatility. Although the decline hasn't been particularly strong, experience suggests a high probability of a sharp drop, so this opportunity should be seized.
Today's ETH Short-Term Contract Trading Strategy:
Sell at the 3930 area, stop loss at the 3960 area, target 3850 area;
Ethshort

ETHUSDT 4-Hour Chart Analysis !!ETHUSDT 4-Hour Chart Analysis
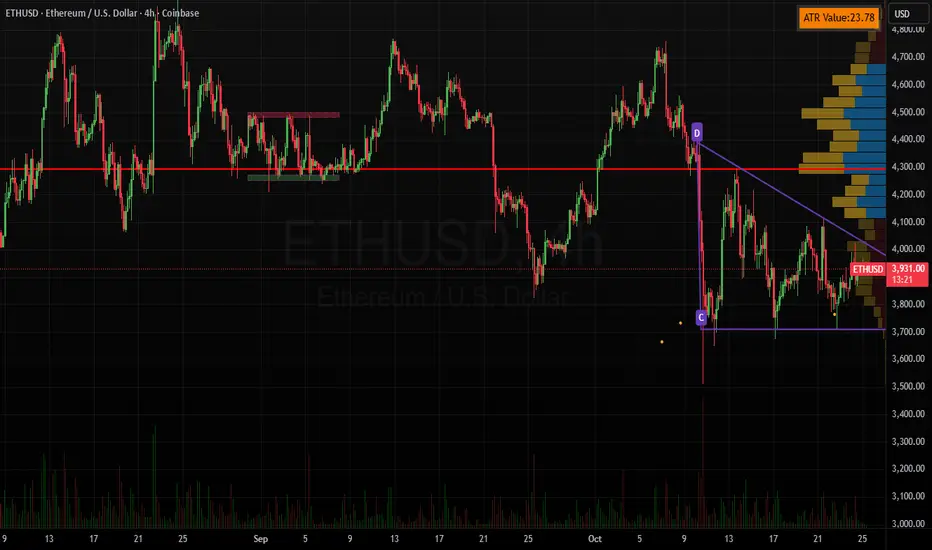
Trend: ETH has found support at the intersection of a long-term downtrend line and a horizontal demand zone ($3,850–$3,900 area). This area has held steady several times and is acting as a base for the price.
Structure: The price has recently pulled back after rallying to $4,220, but continues to make higher lows on this timeframe, indicating that the bullish structure remains intact as long as $3,900 remains stable.
Key Levels:
Support: $3,850–$3,900 (trend line and horizontal zone)
Resistance: $4,220 (recent swing high), $4,830 (key target—see green arrow projection)
Perspective: If ETH remains stable above $3,900 and bounces back from this support, the next targets will be $4,220 and then $4,830. A breakdown below $3,850 would weaken this bullish outlook.
ETH remains bullish above support, and an upward move towards $3,900 is highly likely. Watch for a break above and sustain above the $4,220 level for further momentum.
DYOR | NFA

Wyckoff Distribution - Cycle Top Is In?This idea is sharing the potential for the top being in for ETH and lower timeframe starting the final phase of Wyckoff Distribution.
🔍 Pattern Identification
Phase A–E of a Wyckoff distribution.
Buying Climax (BC) → Automatic Reaction (AR) → Upthrust (UT/UTAD) → Sign of Weakness (SOW).
The “5a / 5b” double top corresponds to the Upthrust After Distribution (UTAD).
The price currently sits near the midpoint of the channel, testing resistance around the 50-day SMA (yellow) and prior support-turned-resistance zones.
📉 Statistical Likelihood of Breakdown
Historically, when this distribution schematic appears in crypto or equities, it resolves to the downside roughly 65–75% of the time — provided:
Volume confirms weakness (volume declining on rallies and expanding on downswings).
Lower highs and lower lows continue forming after the UTAD.
Momentum (RSI) fails to confirm new highs (bearish divergence).
RSI is below 50 and rolling over → neutral-to-bearish momentum.
The price rejected near the 50-day SMA and upper channel resistance.
Structure shows multiple failed breakout attempts above $4,200–$4,400, aligning with a classic distribution top.
📊 Based on backtests of Wyckoff distribution-type structures (in both traditional and crypto markets):
Downside resolution probability: 70% ±10%.
Neutral consolidation (sideways): 20%.
Bullish continuation / spring scenario: 10%.
🧠 Validity of the Pattern on the Weekly
✅ Higher timeframe = stronger implication.
On the weekly chart:
The structure has clear symmetry to Wyckoff’s Distribution Schematic.
There is a confirmed lower high (5b) near prior ATH.
Volume contraction aligns with a mature distribution.
RSI failing to reclaim 70 and diverging from price adds to bearish confluence.
In Wyckoff methodology, patterns across multiple timeframes that confirm each other (daily + weekly) dramatically increase probability of follow-through.
🧩 Multi-Timeframe Synthesis
Daily: short-term distribution (local microstructure)
Weekly: intermediate distribution (macro confirmation)
Monthly: major cycle-top distribution (potential cycle exhaustion)
These three are nested fractals — the monthly chart is the “parent” structure of the same Wyckoff behavior visible on lower frames.
That multi-timeframe confluence adds tremendous weight:
In Wyckoff terms, a valid distribution on monthly + weekly + daily timeframes is statistically one of the highest-probability setups for a major markdown (≈ 80–85% historical probability once confirmed).
🧩 Fractal Nature of Wyckoff Structures
Markets are fractal: smaller patterns nest inside larger ones.
The daily distribution identified is the micro-mechanics — the short-term redistribution of supply near resistance.
The weekly structure is the intermediate framework confirming that supply dominance isn’t just a blip but a developing trend.
The monthly is the macro cycle top — the large-scale distribution that governs the whole market phase (multi-year).
📉 Typical Retrace Targets in Multi-Timeframe Distributions
When a smaller-scale breakdown completes the macro distribution:
Retrace depth: often 50–65 % of the total distribution height.
For ETH, measured from the $4,800 top to the $1,400 macro base → retracement targets of $2,500–$3,000 are classic.
In extreme cases (full Phase E markdown), price can revisit or slightly undercut the long-term demand line (~$1,800–$2,000) before new accumulation begins.
#ETH/USDT Buy Opportunity#ETH
The price is moving within an ascending channel on the 1-hour timeframe and is adhering to it well. It is poised to break out strongly and retest the channel.
We have a downtrend line on the RSI indicator that is about to break and retest, which supports the upward move.
There is a key support zone in green at the 3900 price level, representing a strong support point.
We have a trend to stabilize above the 100-period moving average.
Entry price: 4020
First target: 4050
Second target: 4100
Third target: 4179
Don't forget a simple point: capital management.
Upon reaching the first target, save some money and then change your stop-loss order to an entry order.
For any questions, please leave a comment.
Thank you.

ETH-----Sell around 4035, target 3960 areaETH Contract Technical Analysis (October 29th):
On the daily chart, yesterday's close was a small bearish candle, indicating a consecutive decline. The price is still within a range, and the accompanying indicators show a golden cross with decreasing volume. The overall trend remains bullish, but the price is currently in a range-bound movement. However, attention should be paid to data releases and news-driven stimuli. On the hourly chart, the price faced downward pressure during the US session, but rebounded from early support this morning. The current candlestick pattern shows a consecutive bullish reversal, while the accompanying indicators show a bearish cross with decreasing volume. However, the four-hour chart shows significant price suppression, with resistance around the 4035 area.
Today's ETH Short-Term Contract Trading Strategy:
Sell at the 4035 area, stop loss at the 4070 area, target 3960 area;

Ethereum (ETH/USDT): Possible Short OpportunityHi guys!
ETH is currently testing the ascending trendline support after forming a potential lower high near the $4,165 zone. The structure shows early signs of weakness as buyers failed to maintain momentum above the last swing top.
A clean break below the trendline could confirm a short-term bearish shift, targeting the $4,030–$4,000 support zone, which aligns with the previous breakout level. The invalidation of this setup would occur if the price breaks and holds above $4,165, signaling renewed bullish momentum.
important levels:
Resistance: $4,165
Support: $4,030 – $4,000
Bias: Bearish below $4,165

Eth Short :: ETF Outflows / DAT RiskETH is in a descending triangle on the 4 hour chart which is a bearish pattern.
A few other factors outside of price action that suggest a possible correction:
Net weekly ETF outflows. -63k ETH last week.
Potential multi-year double top playing out but that won't be invalidated until price falls below $1,000ish which is highly unlikely.
ETH validator exit queue at record high level of 43 days with roughly 25 million ETH queued to exit staking. Not all is likely to be sold, but the record exodus can't be bullish. www.validatorqueue.com
Proliferation of Digital Asset Treasuries (DATs) that add very little value to the ecosystem to justify a premium over readily available ETFs. Given the recent decline in ETH price, many are now trading at a discount to NAV. This creates the potential for a negative spiral by forcing sales of assets which adds further pressure to others. Tom Lee who has a vested interest in DAT success said the DAT bubble has started to pop (DAT bubble..not specifically ETH). This by far is the biggest risk to the space. It may take some time to materialize but if it does, I suspect that it will be unwind rapidly.
There are many incredibly bullish counterarguments that could easily take this back up quickly, so this idea will be invalidated when the upper trend line is broken on volume.
My long-term view is bullish but there is a lot of hype and excess in the space that periodically needs to be cleared out. If the descending triangle plays out, we could see another ~20% drop to the $3,000 range.
I am already short but the more cautious approach is to wait until the lower support is broken on volume.
#ETH/USDT : Another Attempt To Resume Upward Movement
#ETH
The price is moving within a descending channel on the 1-hour frame, adhering well to it, and is heading for a strong breakout and retest.
We have a bearish trend on the RSI indicator that is about to be broken and retested, which supports the upward breakout.
There is a major support area in green at 3826, which represents a strong support point.
We are heading for consolidation above the 100 moving average.
Entry price: 3831.
First target: 3920.
Second target: 3969.
Third target: 4200.
Don't forget a simple matter: capital management.
When you reach the first target, save some money and then change your stop-loss order to an entry order.
For inquiries, please leave a comment.
Thank you.

ETHUSDTBINANCE:ETHUSDT have a amazing trend because this is second the best crypto an head of all project so is in watchlist of best traders.
Support for buy: 3750$
Resistance for targets: 4045 - 4200 - 4435 - 4755
Please your risk management.

Ethereum Sees Major Sell-Off as Price Fails to Break $4,000Ethereum’s price sits at $3,950 at the time of writing, stuck below the critical $4,000 resistance. The altcoin has been oscillating near $3,872, showing no clear directional bias.
The current indicators suggest that this consolidation phase above $3,742 support is likely to persist. However, if market conditions worsen and ETH slips below $3,742, a further decline toward $3,489 could follow. Such a move would confirm a bearish continuation pattern.
Conversely, if buying activity strengthens and overall sentiment improves, Ethereum could breach the $4,000 resistance level. A successful breakout would open the path toward $4,221, invalidating the bearish outlook and signaling renewed investor confidence.

ETHUSDT 2-Hour Chart Analysis. ETHUSDT 2-Hour Chart Analysis.
ETH is consolidating above key support levels ($3,700–$3,800) and exhibiting a lateral range, but a clear breakout has yet to occur.
The chart path indicates a bullish scenario: if ETH holds above this base, the next major resistance lies near $4,280—a move above this could lead to a target of $4,400+.
Bullish traders will want to see a strong candle above $3,900 to maintain momentum; failure to hold $3,700 raises the risk of a move towards the $3,390 support level.
DYOR | NFA

#ETH/USDT : Another Attempt To Resume Upward Movement#ETH
The price is moving within a descending channel on the 1-hour frame, adhering well to it, and is heading for a strong breakout and retest.
We have a bearish trend on the RSI indicator that is about to be broken and retested, which supports the upward breakout.
There is a major support area in green at 3826, which represents a strong support point.
We are heading for consolidation above the 100 moving average.
Entry price: 3874.
First target: 3920.
Second target: 3969.
Third target: 4200.
Don't forget a simple matter: capital management.
When you reach the first target, save some money and then change your stop-loss order to an entry order.
For inquiries, please leave a comment.
Thank you.

Ethereum Price Stuck Below $4,000 as LTHs Apply Selling PressureEthereum’s price trades at $3,846 at press time, slipping below the $3,872 support level. The altcoin king has remained stuck under $4,000 for nearly a week, reflecting fading momentum and tightening volatility in the broader crypto market.
Given the prevailing selling pressure and weak inflows, Ethereum’s price could fall further toward the $3,742 support zone. If this level fails to hold, a deeper correction could follow, pushing ETH down to $3,489. Such a decline would reinforce the current bearish outlook.
However, if Ethereum holders curb their selling and demand strengthens, ETH could rebound above $4,000. A decisive break of this resistance could lift prices toward $4,221, signaling renewed optimism and invalidating the prevailing bearish setup.

ETH(20251022) market analysis and operationTechnical Analysis of the ETH Contract on October 22nd:
Today, the large-scale daily chart closed with a small negative candlestick pattern. The K-line pattern continued to decline, and the price remained at a low level. The accompanying indicator formed a downward death cross, and the overall downward trend is still very clear. Although the overall momentum is not strong at present and remains within the range, such a trend is easily affected by news or data, and a significant downward breakout is likely. Therefore, the short-term trading strategy of the high point remains unchanged. The short-term hourly chart showed downward pressure on the price in the early morning. The current K-line pattern continued during the Asian morning. The accompanying indicator formed a downward death cross and broke through the previous day's low. Therefore, today is a simple matter. Focus on the day and wait for a pullback correction in the European session before entering the market and selling directly. The strategy and timing are relatively clear, so please strictly follow it.

ETHUSD Is showing a great buy opportunity - low risk high rewardETHER - ETH/USD experienced a big drop to the downside like most other cryptocurrencies... but it nows has very clear signs of a major bullish movement ahead. There is currently a head and shoulders pattern forming which has given us high confidence that it will head to the upside. BUY NOW!

ETH: Head and Shoulders Pattern Targets $3,800Hi Teams!
Ethereum has recently completed a head and shoulders formation. The neckline around $3,920 was broken decisively, confirming the pattern and triggering further downside momentum.
After the breakdown, the price slipped toward the lower boundary of the descending channel, finding temporary support near $3,860. A short-term corrective move is now unfolding, with ETH likely to retest the neckline zone and the upper boundary of the channel before facing renewed selling pressure.
As long as Ethereum trades below $3,920–$3,940, the bearish structure remains valid. A rejection from this area could accelerate the decline toward the target of the head and shoulders pattern, which aligns with the $3,800–$3,820 support zone.
However, a clear breakout above the descending trendline would invalidate this bearish outlook and could open the way for a recovery toward the $4,000–$4,050 resistance area.
Levels to Watch:
Resistance: $3,920 – $3,940 / $4,000 – $4,050
Support: $3,860 / $3,800 – $3,820
Bearish Target: Around $3,800 zone
Outlook: Bearish while below $3,920.

Ethereum — Losing the PremiumThe Ethereum future’s chart is showing weakness, and I’m expecting a drop toward the $3,760 area from current levels.
Scenario invalidation — the zone is marked on the chart at $4,041

ETHUSD 1D Analysis: Back to the 0.618 fib after ATH rejection?ETH seems to have been rejected at ATHs, with a consequent break of trend diagonal, it's retest and rejection.
The chart reflects a bearish divergence between price and momentum indicators, suggesting a possible trend reversal for ETHUSD in the coming months. The RSI shows a lower high while price made a higher high, indicating weakening buying pressure. Similarly, the MACD’s lower high echoes a loss of momentum, confirming the divergence signal.
The main daily chart displays a breakdown of the multi-month uptrend, as the price violated its rising support line around the end of September 2025. This technical break is reinforced by the outlined Fibonacci retracement levels, providing reference points for potential support and resistance zones. The red projection line anticipates further downside, aligning with the negative momentum seen in RSI and MACD.
Price targets for the projected short setup are highlighted by the green box between the $2,150 and $2,600 zone, where historical volume and Fibonacci confluence may offer stabilization. A broader target extends as low as $1,650 if bearish momentum intensifies, while resistance on any bounce exists near $3,200 and $3,850.
Trade Idea Summary:
Bias: Bearish, following uptrend break and momentum divergence.
Entry range: On confirmed retest and rejection of the broken trend line or key resistance ($3,200–$3,850).
Profit targets: $2,600, $2,150, $1,650, based on volume profile and Fibonacci levels.
Stop loss: Daily close above $4,000 or reclaim of trendline.
Risk management: Adjust stop as price approaches $2,600 zone.
This setup emphasizes momentum decay, technical breakdown, and structured targets, ensuring clarity for both experienced and newer traders.
NFA

ETH: Pulled back under pressure📝ETH has recently broken through an important downward trend line, but then experienced a pullback.
📈Currently, the price is facing greater pressure near 3950. If the closing price can be above 3950, the weekend recovery may continue, and it may even challenge the 3970 - 4000 area. If it can break through this area, it may further rise; if it fails to close above 3950, there will still be a need for a pullback.The key support level below is near 3650.
💡If this position cannot provide effective support, the price may further decline to around 3550, or even near 3370.
💡The resistance level above is in the 3970 - 4000 area. This area is an important pressure level. If the price can effectively break through it, it may indicate that the structure has stopped falling and a rising opportunity will come.
♦Market sentiment remains cautious, with long and short sides locked in a stalemate. From a technical pattern perspective, there is a trend of lower highs and lower lows in prices. If the current structure cannot be broken, market risks will persist.
💎
Buy 3835 - 3840 TP 3850 - 3860 - 3870 SL 3825
Sell 3920 - 3910 TP 3900 - 3890 - 3880 SL 3930
Daily-updated accurate signals are at your disposal. If you run into any problems while trading, these signals serve as a reliable reference—don’t hesitate to use them! I truly hope they bring you significant assistance

Ethereum Falls Below $4,000—But A Price Rebound Could Be NearEthereum’s price currently sits at $3,727, having fallen from $4,000 in the past 48 hours. However, technical indicators suggest that the altcoin may soon see a reversal, with investors preparing to defend key support levels.
If Ethereum bounces off the $3,742 support line, it could climb back toward $4,000. A successful breach of that barrier would likely push ETH higher, targeting the $4,221 level once again. This movement would align with historical recovery trends seen after periods of capitulation.
Still, a failure by investors to sustain momentum could trigger a deeper correction. Should the market sentiment turn bearish, Ethereum may decline toward $3,489. A drop below this level would invalidate the short-term bullish outlook, delaying any potential rebound.

#ETH/USDT
#ETH
The price is moving within a descending channel on the 1-hour frame, adhering well to it, and is heading for a strong breakout and retest.
We have a bearish trend on the RSI indicator that is about to be broken and retested, which supports the upward move.
There is a major support area in green at 3900, which represents a strong support point.
We are heading for consolidation above the 100 moving average.
Entry price: 4156
First target: 4274
Second target: 4405
Third target: 4583
Don't forget a simple matter: capital management.

#ETH/USDT the Final Push Before the Parabolic Run!#ETH
The price is moving within a descending channel on the 1-hour frame, adhering well to it, and is heading for a strong breakout and retest.
We have a bearish trend on the RSI indicator that is about to be broken and retested, which supports the upward move.
There is a major support area in green at 3900, which represents a strong support point.
We are heading for consolidation above the 100 moving average.
Entry price: 4156
First target: 4274
Second target: 4405
Third target: 4583
Don't forget a simple matter: capital management.
When you reach the first target, save some money and then change your stop-loss order to an entry order.
For inquiries, please leave a comment.
Thank you.

ETH/USD Bearish Retracement from Daily FVG Zonea bearish retracement setup on Ethereum (ETH/USDT) in the daily timeframe. After a strong bearish impulse, the price entered a highlighted Daily Fair Value Gap (FVG) zone — a potential area of supply where sellers may regain control. The projection indicates a likely short-term pullback into the FVG before continuing downward toward Target 1 (≈ $3,601) and Target 2 (≈ $3,399).
