ETHUSD potential reversal!
ETHUSD expected to rise up to 1st resistance at 149.88 where it could potentially react off and drop down to 1st support at 134.42.
*Disclaimer.*
Trading leveraged products carries a high level of risk and may result in you losing substantially more than your initial investment. Pepperstone Group Limited is licensed and regulated by the Australian Securities and Investments Commission (AFSL 414530). Pepperstone Limited is authorised and regulated by the United Kingdom Financial Conduct Authority (FRN 684312). This information is not intended for distribution to, or use by, any person in any country or jurisdiction where such distribution or use would be contrary to local law or regulation.
Ethusdcrypto

ETHUSD potential reversal!
ETHUSD expected to rise up to 1st resistance at 151.50 where it could potentially react off and drop down to 1st support at 135.00.
Trading CFDs on margin carries high risk.
Losses can exceed the initial investment so please ensure you fully
understand the risks.

ETH/USD TA Update (More Upside Challenge?)ETH/USD
ETH broke the inside trend-line resistance around 135 levels and has the potential to retest the much bigger resistance line at 150 regions.
We can see buying volume in the past days and ETH finally started moving upward with the help of BTC moving up too.
EMA cross is likely to happen within the next day to give a signal of an immediate shift in short term momentum.
ETH is about to explode with a few weeks in time.

ETH/USD TA Update (4hr Pullback?)ETH/USD
ETH faced rejection from the key resistance at 138 - 140 area. The price has a pullback to key support between 130 regions. This pullback maybe not be over yet,
We could still 1 more leg down to 127 area. Before attempting to retest again the downward trend-line of resistance coming from peak 157 - 151 levels.
ETH reached an overbought RSI giving extra pressure for a pullback to occur during its recent pump.
I'll be waiting for ETH to consolidate longer between 130 regions before entering a Long position to avoid premature entry.

ETHUSD reversed from resistance, potential drop!
ETHUSD reversed off its resistance at 141.75 where it could potentially drop further to 122.85.
Trading CFDs on margin carries high risk.
Losses can exceed the initial investment so please ensure you fully
understand the risks.

The Ethereum Market is Still in a DowntrendThe Ethereum recovered to the area above $134.00 during early Asian hours, however, the growth proved looks to be unsustainable.
Short-term momentum and trend have a bearish bias, besides the hunt for a probable low is not over. If that is the case the first resistance above is the 25th November low of $131.15. A clear break there could send the price for testing H4 50 and 200 SMAs at 137.90 and $151.
The bearish trend coupled with the high volatility suggested that the downward momentum has the potential to continue. ETH/USD is running closer towards a big $100 return, last seen in February, amid the falling wedge pattern on a daily chart. But before that the bears need to breakout 125.25 (Feb. 2019 high) and psychological $120 support firstly.
What do you think about Ethereum?

Ethereum Struggle With Key ResistanceEthereum is struggling to settle above $148.00, however, with little success so far.
The initial support awaits us at $147.70. It is reinforced by 1-hour 50 SMA and the lower line of 1-hour Bollinger Bands. A clear break here could extend the bearish pressure to the lower line of 4-hour Bollinger Bands at $144.90. Once it is out of the way, the sell-off may continue towards $142 (27th November low) and psychological $140.00.
Once ETH/USD manages to pass an immediate barrier at $148.00 (23,6% Fibo correction on the last fall since 6th Nov.), the upside may be extended towards psychological $150.00 reinforced by a combination of 50 SMA and the upper line of the Bollinger Bands on the 4-hour chart. We will need to see a sustainable move above this area to improve the short-term technical picture.
The Relative Strength Index (RSI) indicator is trending around 37 on the daily chart, next to the oversold zone.

ETHUSD approaching support, potential for a bounce!
ETHUSD is expected to drop to 1st support at 138.80 where it could potentially react off and up to 1st resistance at 158.50.
Trading CFDs on margin carries high risk.
Losses can exceed the initial investment so please ensure you fully
understand the risks.

Simple Adam & Adam double bottomShort term bullish reversal has already begun, testing out and identifying new patterns in chart. Overall still bearish.

ETHUSD formed bullish Shark | A good long opportunityPriceline of Ethereum / US Dollar cryptocurrency has formed a bullish Shark pattern and entered in potential reversal zone.
This PRZ area should be used as stop loss point in case of complete candle stick closes below this area.
I have used Fibonacci sequence to set the targets:
Buy between: 144.93 to 143.26
Sell between: 146.84 to 150.60
Regards,
Atif Akbar (moon333)

ETHUSD Pyramidit looks like a pyramid doesn't it? stuck in a downtrend, shorting to ~130 - 135 is the best option. Looking for a reversal so I can make some new charts..

ETHUSD May drop lower before risingretest of fib level 0 is target, linear regression shows a clear downtrend, major support at ~140 which will most likely hold if this drop occurs, even though hardfork.

#ETHUSD#Ethereum, Boredom celebratesA downward trend without changes.
As long as ETH USD is below the resistance line at $ 158 we recommend selling.
Ichimoku Indicator indicates continued declines
Target: $ 129

#ETHUSD#Ethereum, The bears will continue to celebrateThere was no breaking the resistance at $ 158 like we thought it might be
The last 2 candles were closed in the shape of a star that they would usually appear at the end of the trend and indeed the candle that followed was red
The Ichimoku cloud continues to be a bear cloud and the candles are still below the cloud and the blue line is still above the red line, all of which indicate continued declines.
The price below the 200 moving average line.
Target: $ 131
Ethereum (ETHUSD) Market Outlook | Daily Crypto Market BreakdownETH and other ALT-coins need bullish momentum or we are heading down south. I personally would like to see how low we can go. This will be an interesting month.

Ethereum (ETHUSD) Market Outlook | Daily Crypto Market BreakdownI looks like ETH and other ALT coins are really at a serious make it or break it point. It seems to me that bitcoin is looking healthier than other ALTs for now.

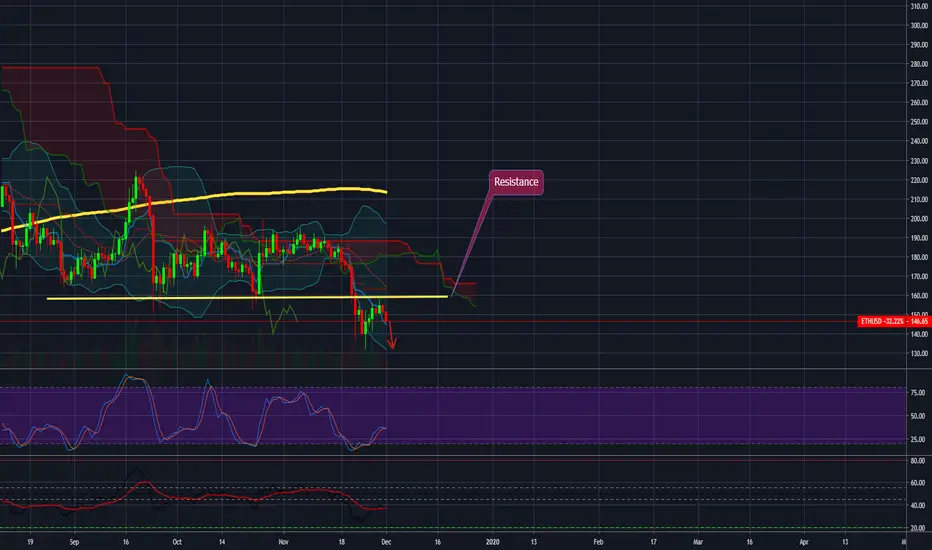
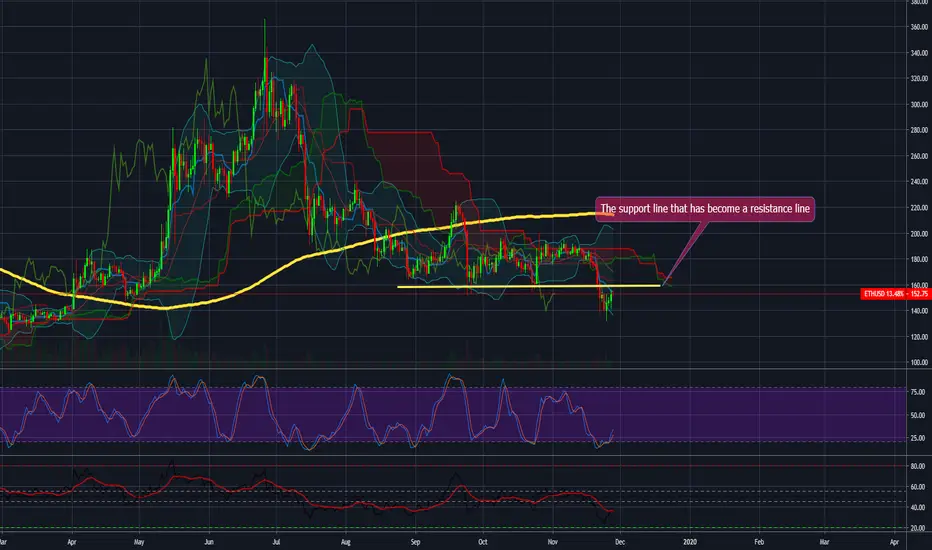
#Ethereum#ETHUSD, Delicate signalThe Ethereum faces a resistance line that used to be a support line.
Judging by Stochastic Indicator and RSI Indicator we are ahead of wave ups.
In the case of breaking the resistance line at $ 160, Ethereum will be able to return to the range between $ 160 and $ 193.
We recommend a very careful purchase with an initial target of $ 161
ETHUSD formed bullish Crab | Upto 46% expectedPriceline of Ethereum / US Dollar cryptocurrency has formed a bullish Crab pattern and entered in potential reversal zone.
This PRZ area should be used as stop loss in case of complete candle stick closes below this zone.
I have used Fibonacci sequence to set the targets:
Buy between: 140.83 to 124.86
Sell between: 153.21 to 183.53
Regards,
Atif Akbar (moon333)

ETHUSD formed bullish Butterfly | A good long opportunityPriceline of Ethereum / US Dollar cryptocurrency has formed a bullish Butterfly pattern and entered in potential reversal zone.
This PRZ area should be used as stop loss in case of complete candle stick closes below this zone.
I have used Fibonacci sequence to set the targets:
Buy between: 177.33 to 173.24
Sell between: 180.50 to 188.12
Regards,
Atif Akbar (moon333)

ETHUSD bounced from support, potential for a further rise!
ETHUSD bounced off 177.23 where it could potentially rise further to 184.80.
*Disclaimer.*
Trading leveraged products carries a high level of risk and may result in you losing substantially more than your initial investment. Pepperstone Group Limited is licensed and regulated by the Australian Securities and Investments Commission (AFSL 414530). Pepperstone Limited is authorised and regulated by the United Kingdom Financial Conduct Authority (FRN 684312). This information is not intended for distribution to, or use by, any person in any country or jurisdiction where such distribution or use would be contrary to local law or regulation.


ANALYSIS ON EthereumANALYSIS ON ETHUSD
Welcome to my analysis
-
DAILY CHart
-
Interesting Point of interest In the ETHUSD pair.
- Price below 200 day EMA.
- price looking to move to test the 158 zone again.
- Expecting more downward momentum.
- MACD showing bearish divergence
Stay Tuned

ETHUSD reversed from resistance, potential drop!
ETHUSD reversed off its resistance at 186.42 where it could potentially drop further to 177.23.
*Disclaimer.*
Trading leveraged products carries a high level of risk and may result in you losing substantially more than your initial investment. Pepperstone Group Limited is licensed and regulated by the Australian Securities and Investments Commission (AFSL 414530). Pepperstone Limited is authorised and regulated by the United Kingdom Financial Conduct Authority (FRN 684312). This information is not intended for distribution to, or use by, any person in any country or jurisdiction where such distribution or use would be contrary to local law or regulation.
