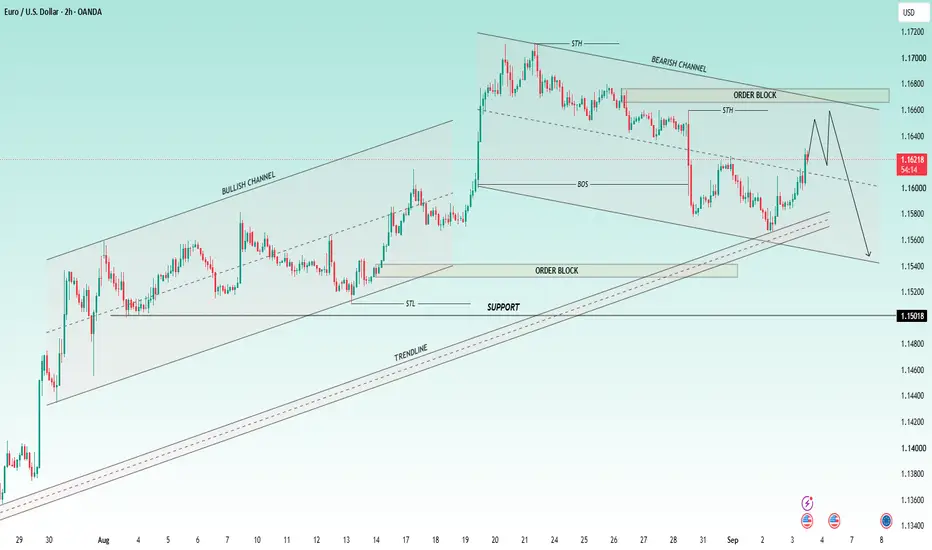
EUR/USD Technical Analysis | 2H Timeframe📊 EUR/USD Technical Analysis | 2H Timeframe
🔍 Liquidity Sweep & Potential Bearish Reversal
📌 Market Overview
EUR/USD is showing a short-term bullish recovery after rebounding from the major support zone around 1.1105–1.1115. Price has moved upward and broken a previous structure, indicating short-term buying momentum.
However, the market is now approaching a significant buy-side liquidity zone around 1.1240–1.1250, where a potential reaction or reversal could develop.
🔹 Key Technical Levels
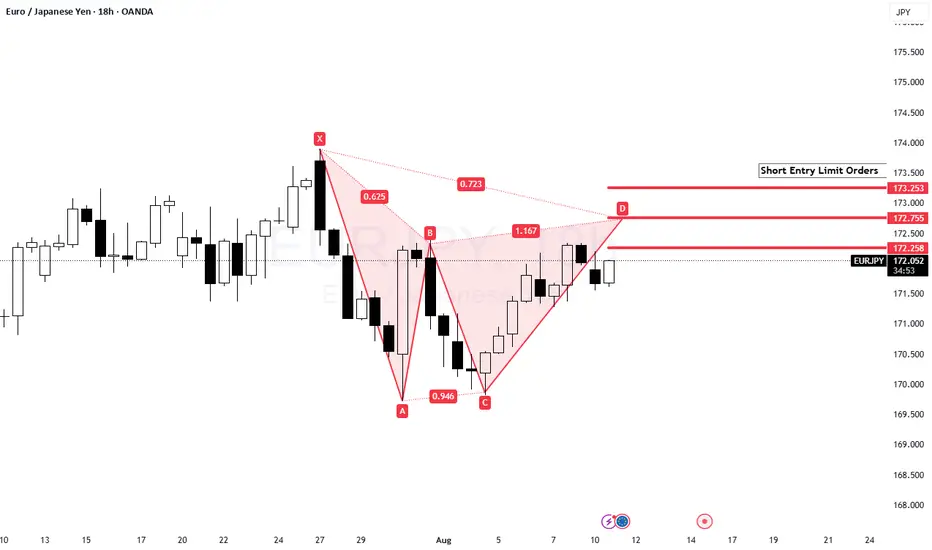
Euroyen
EUR/USD — 4H Bearish Channel & Key Support Zone📊 EUR/USD — 4H Bearish Channel & Key Support Zone
🔻 Market Structure
EUR/USD remains under bearish pressure on the 4H timeframe, trading inside a well-defined descending channel. Price continues to form lower highs and lower lows, keeping the broader structure tilted to the downside.
📉 Current Price Action
Price has moved into the 1.1150–1.1170 support zone after another bearish leg. This area is important because it may trigger a short-term corrective bounce. However, there is no confirmed bu
EUR/USD Technical Analysis | Bullish Recovery Setup from Key Su# 📊 EUR/USD Technical Analysis | Bullish Recovery Setup from Key Support 🟢
## 🔎 1. Market Overview
EUR/USD is currently trading around **1.1188** on the 1-hour chart, showing a recovery after a strong bearish move toward the **1.1150–1.1160 support zone**.
Price has reacted positively from this demand area, suggesting that buyers are attempting to regain control in the short term. However, the broader price structure still shows bearish pressure, and the market remains below several important
EUR/USD 2H — Bearish Channel & Potential Reversal Setup📊 EUR/USD 2H — Bearish Channel & Potential Reversal Setup 📉
🔎 Market Structure
EUR/USD is currently trading inside a well-defined descending channel, with lower highs and lower lows controlling the 2H structure. The price remains below the Ichimoku cloud, which keeps the broader structure bearish.
🟢 Key Support / Demand
Price has reached the 1.1290–1.1320 support zone, where buyers have recently reacted.
This area is important because a strong reaction here could produce a short-term correct
EUR/JPY Has Confirmed a TopThe 168 level - a big line in the sand for EUR/JPY has been decisively broken and successfully re-tested - putting in a bearish engulfing candlestick.
The setup is in place to go short with the new downtrend - targeting Fib extension levels below 165.
The immediate risk is one last sweep through the highs - perhaps to 50-61.8% Fib zone before antoher drop.
EUR/USD 2H — Bearish Structure & Potential Rebound Zone📊 EUR/USD 2H — Bearish Structure & Potential Rebound Zone
🔻 Market Structure:
EUR/USD has shifted from the previous bullish channel into a clear bearish channel, with lower highs and lower lows developing. Price is currently trading around 1.1393, close to the marked support area.
🧱 Key Support:
The 1.1360–1.1390 region is an important support zone. A sustained reaction here could trigger a corrective bounce.
📈 Potential Upside Reaction:
If support holds and buyers regain control, the marked
EUR/USD 1H — PROFESSIONAL TECHNICAL ANALYSIS📊 EUR/USD 1H — PROFESSIONAL TECHNICAL ANALYSIS
Price: 1.14863
Timeframe: 1H
Market Structure: 🔴 Bearish
Key Area: 🟨 1.1500–1.1540 FVG
🔴 Market Structure
EUR/USD remains in a bearish structure, characterized by lower highs and lower lows after the previous consolidation broke to the downside.
Price is currently trading below the descending trendline, so the broader 1H structure remains bearish.
🟨 FVG / Supply Zone
The highlighted 1.1500–1.1540 area is the key zone to monitor.
A retracement
EUR/USD 2H — Professional Market Structure Analysis 📊 EUR/USD 2H — Professional Market Structure Analysis 📈
🔎 Overall Market Bias: Bearish 🔴
EUR/USD is currently showing a clear bearish market structure on the 2H timeframe. After the strong bullish expansion from the lower levels, price reached the 1.1700–1.1720 resistance area and faced strong rejection. Since then, the market has been forming lower highs and lower lows, indicating that sellers are gradually gaining control.
📉 Market Structure
Price previously traded inside a bullish channel,
EUR/USD 2H — PROFESSIONAL MARKET ANALYSIS 🚀 EUR/USD 2H — PROFESSIONAL MARKET ANALYSIS 📊
🟢 OVERALL BIAS: BULLISH 🐂
EUR/USD is maintaining a clear bullish structure with higher highs and higher lows. Price has broken above the previous consolidation and is now holding above the 1.1610–1.1635 premium zone.
However, price is approaching a major resistance, so patience is important here. ⚠️
🔴 MAJOR RESISTANCE
1.17127
This is the key level controlling the next major move.
If price reaches this area and gets rejected:
➡️ 1.1680
➡️ 1.166
EUR/USD 2H Analysis📊 EUR/USD 2H Analysis – Bullish Structure Still Intact 🚀📈
The overall market structure is shifting from a previous downtrend into a developing bullish trend after a confirmed Change of Character (CHoCH). Price is currently consolidating inside a range, holding above the ascending trendline, which suggests buyers are still defending the market. 🟢
🔍 Key Technical Outlook
✅ CHoCH confirms bullish market structure.
📈 Ascending trendline remains valid, keeping the bullish bias intact.
📦 Price is ra
EUR/GBP Intraday Long Setup (30M) – Higher Low ContinuatiThe chart shows a developing bullish structure on EUR/GBP after a period of consolidation. Price action has formed a higher low followed by a series of higher highs, indicating a potential shift toward short-term upside momentum.
After a sharp impulsive move upward, price pulled back in a controlled manner, respecting a rising trendline. This corrective phase suggests accumulation rather than distribution, with buyers stepping in at higher levels.
Trade Idea:
Entry: Around 0.8663 (near current
An 'RSI Divergence Channel' (EUR/JPY)Setup
Bearish - Uptrend very overbought
Monthly chart hit Fib extension level (resistance)
Daily rising channel (broken?)
False breakout above prior high (185.0)
RSI bearish divergence in channel
#NOTE: The channel shows an extended period of slowing momentum but price ignores it for longer than normal because trend is so strong
Commentary
The long term trend has hit a potential Fib extension resistance after 8/10 months green. Broken rising channel not so strong by itself but alongside ove
EUR/JPY: Bullish trendline breakOn the daily chart, there is a clear break of a downtrend line with a confirmed weekly close above it - unlike during the liquidity grab where the price broke higher but then closed the week under the trendline.
This broken trendline and Friday’s low at 161 is now support. Should the price be able to break above the August peak, a next possible upside target is 167.5 (the 61.8% Fibonacci retracement of July-August drop.
But that’s just what we think, do you agree or disagree?
Send us a messag
Joe G2H Trade: Selling EURJPY againTrade Idea: Selling EURJPY
Reasoning: Major resistance on the daily chart, swing failure?
Entry Level: 147.616
Take Profit Level: 146.28
Stop Loss: 148.04
Risk/Reward: 3.08/1
Disclaimer – Signal Centre. Please be reminded – you alone are responsible for your trading – both gains and losses. There is a very high degree of risk involved in trading. The technical analysis , like all indicators, strategies, columns, articles and other features accessible on/though this site is for informational pu
Joe G2H Trade - EURJPY swing failure on the daily?Trade Idea: Selling EURJPY
Reasoning: Major resistance on the daily chart, swing failure?
Entry Level: 147.90
Take Profit Level: 146.41
Stop Loss: 148.66
Risk/Reward: 2.08/1
Disclaimer – Signal Centre. Please be reminded – you alone are responsible for your trading – both gains and losses. There is a very high degree of risk involved in trading. The technical analysis , like all indicators, strategies, columns, articles and other features accessible on/though this site is for infor
Joe Gun2Head Trade - Still below the downtrend on the dailyTrade Idea: Selling EURJPY
Reasoning: Still below the downtrend on the daily
Entry Level: 144.659
Take Profit Level: 142.39
Stop Loss: 145.42
Risk/Reward: 3.2:1
Disclaimer – Signal Centre. Please be reminded – you alone are responsible for your trading – both gains and losses. There is a very high degree of risk involved in trading. The technical analysis , like all indicators, strategies, columns, articles and other features accessible on/though this site is for informational pur
Joe Gun2Head Trade - Short term top on EURJPY?Trade Idea: Selling EURJPY
Reasoning: Short term top on EURJPY? Wave count, top pattern, VPOC.
Entry Level: 143.03
Take Profit Level: 142.00
Stop Loss: 143.32
Risk/Reward: 4.24:1
Disclaimer – Signal Centre. Please be reminded – you alone are responsible for your trading – both gains and losses. There is a very high degree of risk involved in trading. The technical analysis , like all indicators, strategies, columns, articles and other features accessible on/though this site is fo
EURJPY - Bears are in controlEURJPY - Intraday - We look to Sell at 141.65 (stop at 142.50)
Although the bears are in control, the stalling negative momentum indicates a turnaround is possible. We are trading at oversold extremes. A higher correction is expected. Our short term bias remains negative. We look to sell rallies.
Our profit targets will be 139.20 and 138.45
Resistance: 140.90 / 142.70 / 144.85
Support: 139.10 / 136.95 / 133.40
Please be advised that the information presented on TradingView is provide