EUR/USD Structure Intact — Path Higher Remains in PlayHi Everyone,
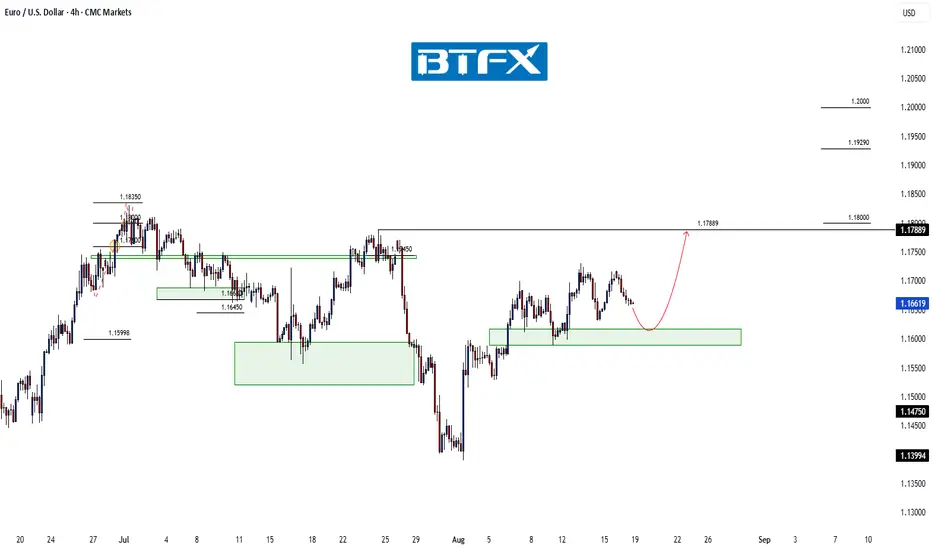
Since the 1st August low, EUR/USD has rallied swiftly back above the 1.16000 level, reclaiming the key 1.16450 zone. If the current consolidation holds above the 1.15888–1.16170 area, this should provide a base for further upside toward 1.17889.
A sustained push into this level in the coming sessions would further confirm renewed buying interest.
Our broader outlook remains unchanged: we continue to expect the pair to build momentum for another leg higher. A decisive break above 1.18350 could open the path toward the 1.19290 area and ultimately the 1.20000 handle.
We’ll be monitoring price action closely to see whether this recovery gains traction and if buyers can maintain momentum through resistance. The longer-term outlook remains bullish, provided price continues to respect the key support zone.
We’ll keep you updated throughout the week as the structure develops and share how we’re managing our active positions.
Thanks again for all the likes, boosts, comments, and follows. We truly appreciate the support!
All the best for the rest of the week.
Trade safe.
BluetonaFX
Eurusdtrendanalysis
Fiber Battle Plan: Bulls Prepare for EUR/USD Uprising🏴☠️💸 EUR/USD "Fiber Heist Plan" – Thief Trader's Bullish Raid! 💸🏴☠️
🔓 The Vault is CRACKED – Time to LOAD UP! 🚀📈💰
🎯 MASTER PLAN:
Asset: EUR/USD ("Fiber")
Direction: BULLISH HEIST 🐂💪
Entry Strategy: Layered Limit Orders (Sneaky thief-style accumulation)
Trigger: Hull MA CROSS confirmed + Price > 1.16300 🎯
Stop Loss: 1.15100 (Guarding the loot!) 🛡️
Target: 1.18000 (Bank it & bounce!) 💰🔥
🕵️ THIEF TRADER’S BREAKDOWN:
💡 "Weak hands shake, WE TAKE!" – This is a high-probability bullish raid with layered entries for MAXIMUM stealth.
✅ ENTRY TACTICS:
Buy Limit Orders stacked near swing lows (1.16300 zone)
Only trigger AFTER Hull MA confirms bullish flip (No early fomo!)
Scale in like a pro thief – don’t dump all bullets at once.
⚔️ RISK CONTROL (MANDATORY!):
SL at 1.15100 (Break this? ABORT MISSION.)
No revenge trading! Stick to the plan or get caught slippin’.
🎯 PROFIT SECURING:
First TP: 1.18000 (Lock in gains!)
Trailing SL option (If momentum stays strong, let it RUN!)
🚨 THIEF’S WARNING:
⚠️ News = Trap Zone! (Avoid fresh entries during high-impact news)
⚠️ No greed! Secure profits before the market reverses on you.
⚠️ Follow the Hull MA like a shadow – if it flips bearish, RE-EVALUATE!
🔥 SUPPORT THE HEIST!
💥 SMASH THAT LIKE & BOOST BUTTON if you're riding with the Thief Trading Crew!
💬 Comment "🚀 LOADED!" if you're in!
We steal smart, trade sharp, and stack profits like bandits. Stay lethal, traders! 🐱👤💸🔥

EUR/USD Shows Optimism Ahead of Trump–Putin MeetingEUR/USD Shows Optimism Ahead of Trump–Putin Meeting
The meeting between the Presidents of the United States and the Russian Federation, scheduled for today in Alaska, is a major geopolitical event with the potential to exert a significant influence on financial markets.
Expectations are mounting that the talks could lead to a cessation of hostilities in Ukraine – a prospect acting as a bullish factor for the euro. As a result, the EUR/USD chart has been displaying an upward trajectory this week (highlighted by the blue channel).
The blue arrow indicates that:
→ Yesterday’s release of the highest Producer Price Index (PPI) figures in three years triggered a sharp strengthening of the US dollar – possibly because market participants assumed the Federal Reserve might postpone monetary policy easing in light of rising producer prices (widely considered a consequence of Trump’s tariff measures).
→ However, the lower boundary of the upward channel prevented further decline, and today EUR/USD is showing optimism ahead of the presidential meeting.
EUR/USD Technical Analysis
On 7 August, we plotted a descending channel based on the sequence of lower highs and lows formed over the summer.
From the bearish perspective, the price is currently near a cluster of key resistance levels, which include:
→ the upper boundary of the descending (red) channel;
→ the 1.17145 level (a historical price interaction zone, as shown by the arrows on the left side of the chart);
→ the median line of the ascending (blue) channel.
Conversely, the bulls could be supported by:
→ the lower boundary of the blue channel;
→ the aggressive buying momentum evident in the sharp EUR/USD rally on 12 August (highlighted by the orange arrow).
The bullish case is further reinforced by the fact that buyers managed to fully recover from the decline that began on 28 July.
Given the above, we could assume some consolidation today as the market awaits the outcome of the presidential talks. The fact that the ADX indicator is hovering near its lows and trending downward underscores the current indecision and caution in the market.
However, Monday’s open could prove highly volatile. Be prepared for sharp EUR/USD movements in either direction, depending on statements made by the US and Russian leaders.
This article represents the opinion of the Companies operating under the FXOpen brand only. It is not to be construed as an offer, solicitation, or recommendation with respect to products and services provided by the Companies operating under the FXOpen brand, nor is it to be considered financial advice.

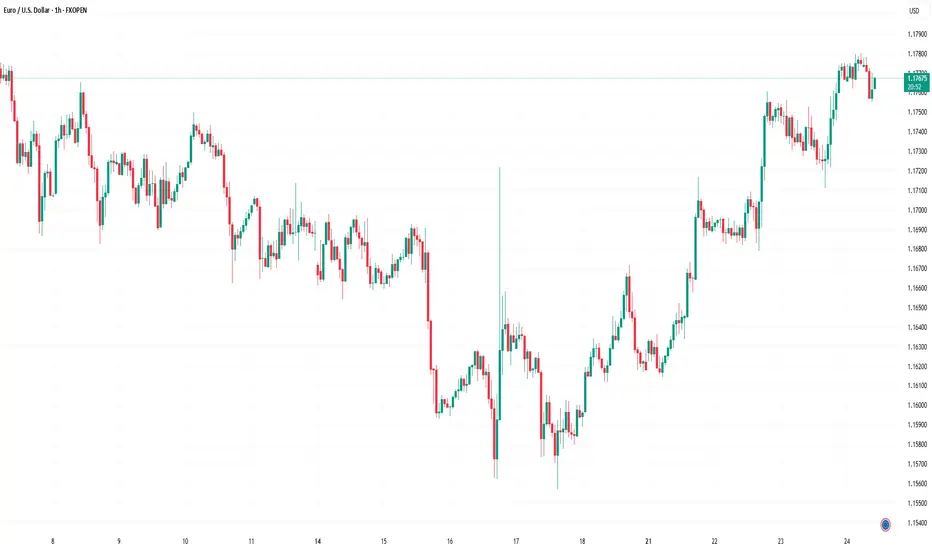
EURUSD after the newsYesterday, EURUSD continued its bullish move, reaching 1,1697.
If the rally continues, the next target is 1,1760.
Some pullbacks are still possible before breaking above the previous high, which could provide opportunities for additional entries.
Focus only on trades in the main direction!

EURUSD retested bearish wedge. Ready to decline?EURUSD retested bearish wedge. Ready to decline?
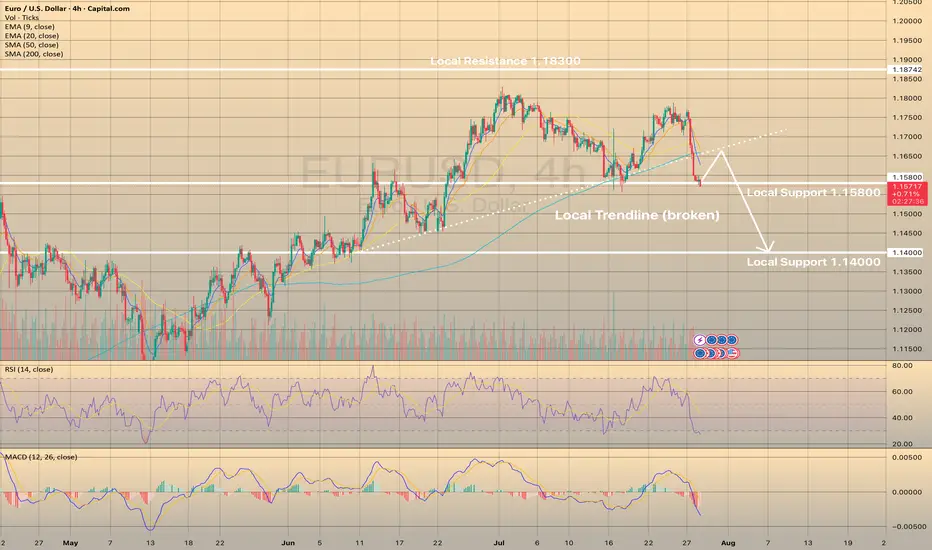
EURUSD has been trading bullish since the beginning of August after disappointing NFP report data came out. By the end of last week price has come to a lower border of the wedge and SMA200 on 4-h chart, but failed to develop bullish momentum and pulled back from it. The asset shows weakness and further decline towards 1.14000 as a first target is expected. MACD is in the red zone.

EUR USD Trade Setup 1 hour timeframe EUR USD has formed a Double Top Break and Retest on the 1 hour timeframe.
additionally, the retest level also align with the 0.618-0.50 Fib Retracement level.
Ensure to wait for entry confirmation on the retest level before selling....

EURUSD - General dynamics and rangesCurrent technical status (Daily/Weekly)
After breaking through the key support at ~1.1445 and then rebounding, EUR/USD is moving up within a steady daily trend, confirmed by the formation of the morning star candlestick pattern, with the short-term target at 1.1800.
The monthly chart shows the development of an upward trend from the October 2025 closing level, with the target of raising prices to 1.1710, but a correction to 1.1588 — the 14.6% Fibonacci retracement level — is possible.
Short-term levels (H1–H4)
Support:
1.1500–1.1480 — the buy zone, from where a reversal has already occurred; the stop level should logically be placed below 1.1440.
Resistance:
1.1600–1.1680 — the near zone, then — 1.1700 and 1.1800 if growth continues.
General dynamics and ranges
The week from August 4 to 8 was characterized by a slowdown in growth, fluctuations in the range of 1.1390–1.1500. The MACD and Stochastic indicators reflect the sellers' momentum, but the oversold situation can provoke a local rebound — growth is possible only with a breakout of 1.1550.
The 1.1650 level is a historically significant barrier. It coincides with the 50% Fibonacci correction and a number of moving averages. Its breakout will open the way to the 1.1700–1.1750 zones. Otherwise, a rollback to 1.1580–1.1530–1.1500 is likely.

EUR/USD Robbery Blueprint Bear Strike Activated!💣🎯Operation Fiber Down: EUR/USD Robbery Blueprint (Day Trade Edition) 💰🔫
🚨 Thieves, Hustlers & Chart Bandits Assemble! 🚨
🌍 Hi! Hola! Ola! Bonjour! Hallo! Marhaba! 🌍
Welcome back to another Thief Trading Operation, where the money never sleeps—and neither do we. Let’s break into the vault of EUR/USD “The Fiber” with surgical precision. 🧠💼🕶️
🧨 THE MASTER ROBBERY PLAN: EUR/USD SHORT STRIKE 🔍💸
💀 Market Bias: Bearish – Trend Reversal + Supply Trap Setup
🎯 Target: 1.14600
🛑 Stop-Loss: Near Swing High (around 1.16700 – 4H chart view)
🕓 Timeframe Focus: 15m / 30m / 3H
🧭 ENTRY ZONE:
👣 Plan your entry from recent high retests—that’s where the big money bulls get trapped.
🎯 Use Sell Limit Orders (DCA style / Layered Limit Orders) like a true thief setting up tripwires.
💼 RISK STRATEGY:
💡 SL should match your lot size and order count—not one-size-fits-all!
📌 Place above key structure or swing level (e.g. 1.16700) based on timeframe.
🔍 BEHIND THE SCENES – THE WHY:
The EUR/USD "Fiber" pair is showing all the classic signs of a trend shift and bear raid setup, including:
📰 Fundamentals weakening the Euro
💣 COT Report reveals institutional exits
🍂 Seasonal Bias points to downward trend
📉 Intermarket Pressure from bond yields & USD strength
📊 Sentiment turning overly bullish = trap zone
⛽ Storage & Inventory imbalances adding fuel
📌 Reminder: Before any robbery, study the layout—Macro, Fundamentals, Sentiment, and Intermarket are your blueprint.
🚨 HEIST ALERT – PROTECT THE LOOT:
🕰️ High-Impact News Events? Tighten up!
💼 Don’t take fresh entries during releases.
🔐 Use Trailing SLs to lock in profits.
🎯 Exit with grace before the sirens start.
⚡🔥JOIN THE CREW, BOOST THE LOOT🔥⚡
💥 Smash the Boost Button 💥 if you're vibing with the Thief Trading Movement.
We ain’t just trading—we’re executing strategic robberies on the market’s weaknesses.
🧠💪 Every like = more power to the crew. Every comment = a new map to a vault.
We rob, retreat, and repeat. Let’s make money with skill, not luck. 🕶️💰🚁
⚠️ LEGAL COVER (For the Lawyers 😏):
This plan is not investment advice, just an organized heist blueprint by chart robbers.
Always manage your own risk and update your plan as the market evolves.
🕶️ Stay ready for the next master plan... Until then, keep your charts clean and your stops tight. 🕶️💣📉
– Thief Trader Out 🐱👤🚀

EURUSD stops at the SMA200, ready to pullback.EURUSD stops at the SMA200, ready to pullback.
The pair has been forming the bearish wedge since the April 2025 till July 2025. At the end of July the lower border of the pattern got broken and the price has rapidly reached the 1.14000 support level. Then the rebound from this level occurred and currently the price is retesting the lower border of the wedge from below. Additionally, the SMA200 is situated just above the current price, which is a fair argument for the price to pullback in the nearest future. The price is expected to decline with a first target of 1.14000.

EUR/USD Rises 2.3% Since the Beginning of AugustEUR/USD Rises 2.3% Since the Beginning of August
As the EUR/USD chart shows today, the euro has strengthened against the US dollar, climbing above the 1.1670 level, compared to the 1.1400 area at the beginning of the month.
Why Is EUR/USD Rising?
According to Reuters, the US dollar's weakness is being driven by:
→ Expectations of a Federal Reserve rate cut, which intensified following last week's disappointing US labour market data.
→ Anticipation of the upcoming US inflation report, scheduled for release on 12 August at 15:30 GMT+3.
On the other hand, the euro is being supported by growing optimism around a possible resolution of the military conflict in Ukraine, as well as the potential meeting between Donald Trump and Vladimir Putin.
Technical Analysis of the EUR/USD Chart
On 30 July, we noted that after hitting its July low, EUR/USD could stage a recovery — which indeed materialised. But does the chart now look bullish?
A definitive bullish outlook is hindered by the sequence of lower highs and lower lows (A-B-C-D), which continues to form a bearish market structure.
At the same time, the descending channel on the EUR/USD chart has become more pronounced. After a brief period of consolidation near the channel’s median line (marked with a circle), the price moved up towards the upper boundary of the channel. It is worth noting that a sharp decline occurred recently from these same levels (highlighted with an arrow), breaking through the blue support line.
Given these factors, it is reasonable to assume that bearish activity may intensify around current levels, potentially slowing further EUR/USD growth.
This article represents the opinion of the Companies operating under the FXOpen brand only. It is not to be construed as an offer, solicitation, or recommendation with respect to products and services provided by the Companies operating under the FXOpen brand, nor is it to be considered financial advice.

EURUSD fails to develop short-term bullish. Here is whyEURUSD fails to develop short-term bullish. Here is why
On August 1 the market received NFP report data. Numbers were so low that EURUSD has rocketed on 1.22% right immediately after publishing. The probability of a September reduction in interest rates is now estimated at approximately 94%, according to CME Fedwatch, up from 63% last week. Market analysts anticipate at least two quarter-point cuts by the end of the year. The odds increased following the release of disappointing non-farm payrolls data on August 1, which caused a decline in stock markets and led to Trump's reaction, firing the head of the Bureau of Labor Statistics and promising to replace her within a short timeframe.
Still, the pair has failed to develop on August 1 bullish momentum and is currently pulling back from the local resistance of 1.15800. If the price fails to hold the EMA20 on 4-h timeframe, then the decline towards 1.14000 is expected.

EUR/USD Intraday Analysis – Bearish Momentum Continues with WeakThe 1-hour chart of EUR/USD suggests continued bearish momentum, though a temporary price bounce may be on the horizon. The pair is currently trading around 1.15589, struggling below the 9-period Simple Moving Average (SMA). This indicates that short-term trend pressure remains bearish.
🔍 Technical Overview
✅ Price Action:
The market recently made a lower low, touching near 1.15400 before showing a minor rebound.
Sellers have clearly been in control, forming a strong sequence of bearish candles.
The SMA 9 is trending downward and is acting as dynamic resistance, confirming bearish pressure.
📊 Indicators:
SMA 9 (close): Price is still trading below the moving average, indicating that the pair is in a short-term downtrend.
RSI 14 (Relative Strength Index): The RSI has dropped below the 40 level, which shows bearish momentum. However, the RSI has started to curl upward, suggesting a minor relief rally may occur — but it’s too early to confirm a reversal.
📈 Possible Trade Setups:
🔻 Sell on Pullback (Preferred):
Sell Entry: Near 1.15750–1.15800 (around SMA resistance)
Stop Loss: 1.16050
Take Profit: 1.15300 / 1.15000
⚠️ Cautious Buy (Aggressive):
If RSI breaks above 50 and price closes above SMA 9, short-term buying could be considered, but overall bias remains bearish until reversal confirmation.
🔧 Support & Resistance Levels:
LevelPriceResistance1.15850Resistance1.16000Support1.15350Support1.15000
📌 Conclusion
EUR/USD remains in a short-term bearish trend, with sellers dominating price action. While a minor RSI bounce is visible, the price still trades under SMA resistance, making “Sell on Rally” the more favorable strategy. Traders should be cautious of any news-driven volatility and wait for strong confirmation before entering aggressive buy trades.

EURUSD FORMED BEARISH PENNANT. THE PRICE IS READY TO DROP.EURUSD FORMED BEARISH PENNANT. THE PRICE IS READY TO DROP.
EURUSD has been trading sideways within the last day, showing lower highs and higher lows. Eventually, the price has formed the pennant chart pattern.
What is a pennant?
A pennant chart pattern is a short-term continuation pattern in technical analysis, resembling a small symmetrical triangle, formed after a strong price movement (flagpole). It consists of converging trendlines, indicating a brief consolidation before the trend resumes. Bullish pennants form after an uptrend, bearish pennants after a downtrend.
The price is expected to decline towards 1.14500 support level

EURUSD REACHED THE TARGET.EURUSD REACHED THE TARGET.
EURUSD has reached the 1.14500 level and even broke it down. Currently the price consolidates slightly below this level. If the price forms a false breakout of 1.14500 level, this will mean the end of short-term decline in the pair. Stay cautious.

EUR/USD Hits Lowest Level Since Early JulyEUR/USD Hits Lowest Level Since Early July
As the EUR/USD chart indicates today, the euro has fallen below the 1.1550 mark against the US dollar, reaching the lows of June 2025. As a result, July may become the first month in 2025 to record a decline in the currency pair.
Why Is EUR/USD Declining?
There are two key factors driving the euro’s weakness relative to the US dollar:
→ Anticipation of the Federal Reserve Meeting. At 21:00 GMT+3 today, the Fed’s interest rate decision will be released. According to Forex Factory, analysts expect the Federal Funds Rate to remain unchanged at 4.25%-4.50%.
→ Market Reaction to the US-EU Trade Agreement. The trade deal signed last weekend between the United States and Europe is being critically assessed by market participants.
As noted in our Monday analysis, signs of a bearish takeover emerged on the chart following the agreement’s signing. Since then, EUR/USD has declined by approximately 1.3%. The question now is whether the downtrend will continue.
Technical Analysis of the EUR/USD Chart
The upward channel that had remained valid since mid-May was decisively broken by bears this week. The nature of the breakout (highlighted by the red arrow) was particularly aggressive, with the price dropping from the 1.1710 level to the D point low without any meaningful interim recoveries.
Key observations include:
→ The drop has resulted in a classic bearish A-B-C-D market structure, characterised by lower highs and lower lows.
→ On the 4-hour timeframe, the RSI indicator has fallen into oversold territory, reaching its lowest point of 2025 so far.
→ Notably (as highlighted by the blue arrow), there was a strong rebound from the 1.1455 support level earlier. Bulls demonstrated significant strength at that time, breaking through the R resistance line.
Given these factors, we could assume that after this week’s sharp decline, EUR/USD may attempt a short-term recovery from the support zone (highlighted in purple). Should this scenario unfold, potential resistance may emerge near the 1.1630 level, as this area aligns with:
→ The 50% Fibonacci retracement of the C→D decline;
→ The breakout point of the lower boundary of the previous ascending channel, indicating a shift in market balance in favour of the bears.
This article represents the opinion of the Companies operating under the FXOpen brand only. It is not to be construed as an offer, solicitation, or recommendation with respect to products and services provided by the Companies operating under the FXOpen brand, nor is it to be considered financial advice.

Market Analysis: EUR/USD Dips FurtherMarket Analysis: EUR/USD Dips Further
EUR/USD extended losses and traded below the 1.1600 support.
Important Takeaways for EUR/USD Analysis Today
- The Euro struggled to clear the 1.1800 resistance and declined against the US Dollar.
- There is a key downward channel forming with resistance at 1.1575 on the hourly chart of EUR/USD.
EUR/USD Technical Analysis
On the hourly chart of EUR/USD at FXOpen, the pair failed to clear the 1.1800 resistance. The Euro started a fresh decline below the 1.1720 support against the US Dollar.
The pair declined below the 1.1660 support and the 50-hour simple moving average. Finally, it tested the 1.1520 level. A low was formed at 1.1519 and the pair is now consolidating losses. The market is showing bearish signs, and the upsides might remain capped.
There was a minor increase toward the 23.6% Fib retracement level of the downward move from the 1.1770 swing high to the 1.1519 low. Immediate resistance on the upside is near the 1.1575 level.
There is also a key downward channel forming with resistance at 1.1575. The next major resistance is near the 1.1665 zone and the 50-hour simple moving average or the 50% Fib retracement level.
The main resistance sits near the 1.1770 level. An upside break above the 1.1770 level might send the pair towards 1.1800. Any more gains might open the doors for a move towards 1.1850.
On the downside, immediate support on the EUR/USD chart is seen near 1.1520. The next major support is near the 1.1465 level. A downside break below 1.1465 could send the pair towards 1.1350.
This article represents the opinion of the Companies operating under the FXOpen brand only. It is not to be construed as an offer, solicitation, or recommendation with respect to products and services provided by the Companies operating under the FXOpen brand, nor is it to be considered financial advice.

EURUSD - STRONGEST DECLINE FOR THE LAST COUPLE OF MONTHSEURUSD - STRONGEST DECLINE FOR THE LAST COUPLE OF MONTHS
EURUSD has lost 1.32% yesterday on the U.S. - E.U. trade deal. Experts suggest that the relief felt by the United States and the European Union upon reaching a trade agreement has been overshadowed by worries about the potential economic harm caused by a 15% tariff on EU imports. The dollar has recently experienced a positive trend, and this trend could continue if U.S. economic data, including Friday's employment figures, indicates a strong economy. The investors who had previously made substantial bets on the euro's appreciation are now reversing their positions, causing the euro to weaken.
Technically, the asset broke down the local trendline and is currently trying to rebound from the local support level of 1.15800. RSI tells us that the asset is oversold, so the most possible outcome here is the EURUSD to rebound from current level, retest former trendline and continues downwards movement.
EURUSD LOSSES BULLISH MOMENTUM. WHERE TO GO?EURUSD LOSSES BULLISH MOMENTUM. WHERE TO GO?
The asset didn't reach the local resistance of 1.18300 and started to consolidate before reaching this level. RSI shows weakness of the impulse on 4-h chart, as well as MACD is in the red zone. Therefore, we expect the price to slowly decline towards local trendline, where SMA200 is situated.

Europe and the US Sign Trade Agreement, EUR/USD DeclinesEurope and the US Sign Trade Agreement, EUR/USD Declines
The past weekend was marked by the official signing of a trade agreement between the United States and Europe, as announced by US President Donald Trump and President of the European Commission Ursula von der Leyen following their meeting in Scotland.
According to reports, the agreement is based on a 15% baseline tariff on goods exported from Europe to the United States, with certain exemptions. As previously reported, a trade agreement with a 15% baseline tariff had earlier been concluded between the US and Japan.
According to President Trump:
→ under no circumstances did he allow the baseline tariff for Europe to fall below 15%;
→ the European Union committed to investing in the US economy, purchasing weapons, and importing energy resources.
The financial markets’ reaction to this news is noteworthy:
→ European stock indices opened the week with a bullish gap, reflecting relief that previously feared tariffs of up to 30% did not materialise;
→ the EUR/USD pair is exhibiting bearish momentum this morning.
Technical Analysis of the EUR/USD Chart
As indicated by the black arrow, bearish sentiment intensified on Monday morning, pushing the pair towards the 1.1700 level, which had previously acted as resistance in mid-July.
From the perspective of the ascending channel (shown in blue), its median line is currently acting as a resistance level – following contact with it, a short-term rally was broken (highlighted in purple). This reinforces the notion that bears are currently in control.
Given the above, we could suggest that, should bearish sentiment persist on the EUR/USD chart, we may soon witness an attempt to break through the 1.1700 support level. A successful breach could open the path for further downside movement of the euro against the dollar, towards the lower boundary of the channel.
This article represents the opinion of the Companies operating under the FXOpen brand only. It is not to be construed as an offer, solicitation, or recommendation with respect to products and services provided by the Companies operating under the FXOpen brand, nor is it to be considered financial advice.

ECB Interest Rate Decision: What to Expect and How Could React📊 ECB Interest Rate Decision: What to Expect and How EURUSD Could React
This week’s spotlight is on the European Central Bank (ECB) Interest Rate Decision — a key market driver that could shape the near-term direction of the euro and broader European markets. Here's what to expect. 👇
🔔 Key Event to Watch
📅 ECB Interest Rate Decision
🕐 Date: July 24
⏰ Time: 12:15 p.m. UTC
📉 Forecast: Hold at 2.15%
📌 Economic Context
The European Central Bank is expected to hold interest rates steady on Thursday, likely marking the end of its current easing cycle after eight consecutive cuts that brought borrowing costs to their lowest levels since November 2022.
🔒 Main refinancing rate: 2.15%
💰 Deposit facility rate: 2.00%
Policymakers are likely to adopt a wait-and-see approach as they monitor the impact of persistent trade uncertaintyand potential U.S. tariffs on economic growth and inflation.
Adding to the cautious stance, inflation finally reached the ECB’s 2% target in June, and is now forecast to dip belowthat level later this year. This drop is expected to be sustained over the next 18 months, driven by:
A strong euro 💶
Falling energy prices 🛢️
Cheaper imports from China 🇨🇳
Markets are currently pricing in just one more rate cut by December, with around a 50% probability of that happening in September, before a possible tightening cycle resumes in late 2026.
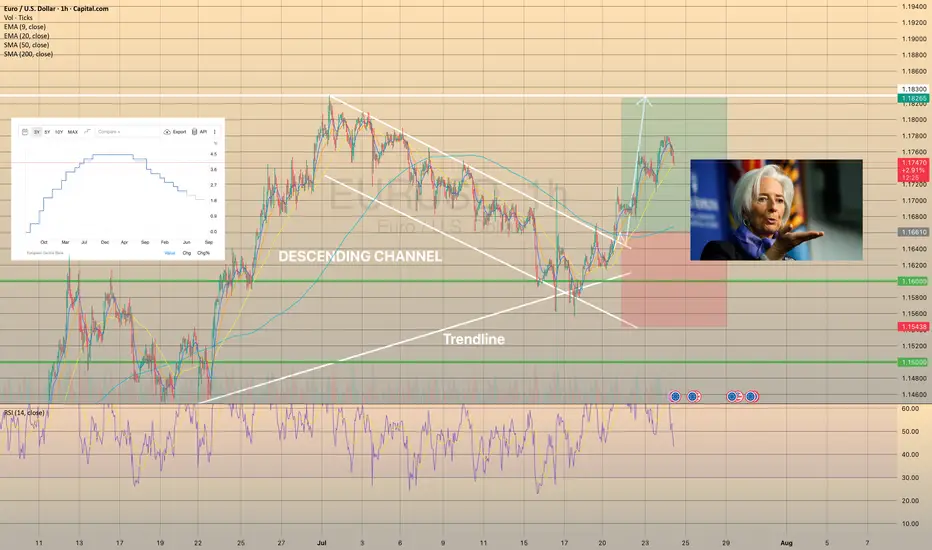
📈 EURUSD Technical Outlook
EURUSD has been trading within a descending channel since early July. However, it recently rebounded from trendline support, backed by bullish RSI divergence. The pair is approaching a breakout above the 1-hour SMA200, signaling a potential continuation of the uptrend. 🔼
A minor pullback is possible before a stronger move
Bullish momentum may continue if resistance is cleared
🎯 Target range: 1.18250 – 1.18300
🧩 Summary
The ECB is likely to keep rates unchanged at 2.15%, adopting a cautious tone amid easing inflation and global trade risks. This outcome could support the euro, particularly if U.S. rate expectations soften.
With technical indicators aligning with fundamental stability, EURUSD may be setting up for a bullish continuationin the coming sessions. 📊💶
EUR/USD Rises to 2.5-Week High Ahead of ECB MeetingEUR/USD Rises to 2.5-Week High Ahead of ECB Meeting
Today at 15:15 GMT+3, the European Central Bank (ECB) will announce its interest rate decision, followed by a press conference at 15:45 GMT+3. According to Forex Factory, the main refinancing rate is expected to remain unchanged at 2.15% after seven consecutive cuts.
In anticipation of these events, the EUR/USD exchange rate has risen above the 1.1770 level for the first time since 7 July. Bullish sentiment is also being supported by expectations of a potential trade agreement between the United States and the European Union. According to Reuters, both sides are reportedly moving towards a deal that may include a 15% base tariff on EU goods entering the US, with certain exemptions.
Technical Analysis of the EUR/USD Chart
From a technical perspective, the EUR/USD pair has shown bullish momentum since June, resulting in the formation of an ascending channel (marked in blue).
Within this channel, the price has rebounded from the lower boundary (highlighted in purple), although the midline of the blue channel appears to be acting as resistance (as indicated by the arrow), slowing further upward movement.
It is reasonable to assume that EUR/USD may attempt to stabilise around the midline—where demand and supply typically reach equilibrium. However, today’s market is unlikely to remain calm. In addition to the ECB’s statements, volatility could be heightened by news surrounding Donald Trump’s unexpected visit to the Federal Reserve.
This article represents the opinion of the Companies operating under the FXOpen brand only. It is not to be construed as an offer, solicitation, or recommendation with respect to products and services provided by the Companies operating under the FXOpen brand, nor is it to be considered financial advice.
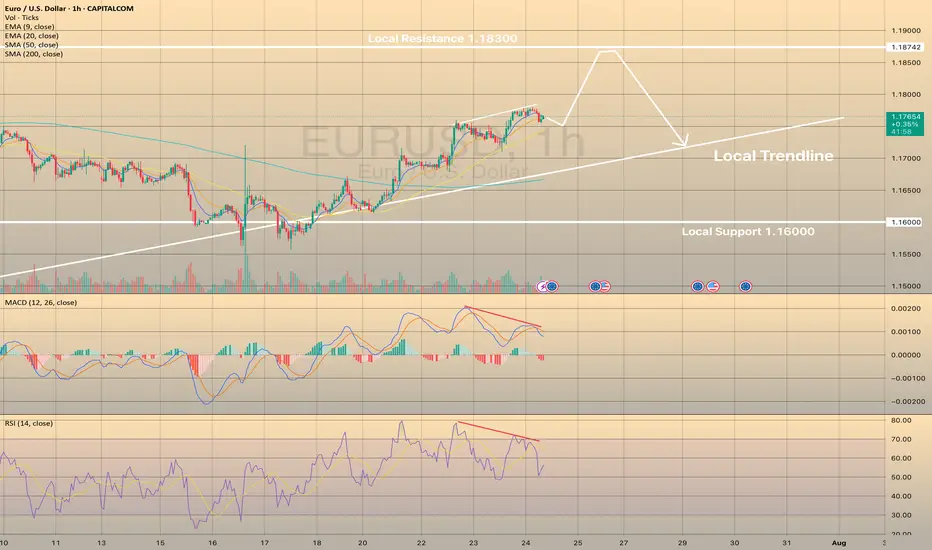
EURUSD IS ON ITS WAY TO LOCAL HIGHSEURUSD IS ON ITS WAY TO LOCAL HIGHS
EURUSD successfully rebounded from local support of 1.16000 and since then continues to rise towards local resistance of 1.18300. Recently the price has started to show the bearish divergence on RSI and Macd indicators. MACD went into the red zone.
What is the bearish divergence?
Bearish divergence is a technical analysis pattern where the price makes higher highs in an uptrend, but a momentum indicator (e.g., RSI, MACD) forms lower highs, signaling weakening bullish momentum and a potential downward reversal. To trade, identify the divergence in a clear uptrend with the indicator showing lower highs (e.g., RSI above 70). Sell or short when the price confirms a reversal (e.g., breaks below a support level or trendline) with increased volume. Set a stop-loss above the recent high. Target the next support level.
Generally speaking, it doesn't necessarily mean that EURUSD will drop immediately, the price may even grow a bit. However, it highlights some short opportunities.
#EURUSD: Still Extremely Bullish! Let's see how it goes! EURUSD is currently making minor correction and it is likely to reverse in coming days. We have to area from where price could reverse from. we advise you to read the chart and also do your analysis before making any decision.
Like and Comment For More!
Team Setupsfx_
