Fakeout

ETHUSD - Range trading, the next re-accumulation in progress! Hello traders, investors and community, there is an amazing example for pattern recognition forming with ETHUSD, i want explain to you. Looking on the daily chart we can see that ETHUSD formed several re-accumulation periods in the past before breaking out of the range. This process brought the price of ETHUSD from 160 USD to 340, almost a doubling in price. There is still room to go for ETHUSD, i detected that we are in a new re-accumulation right now. You can see it in my chart, highly possible there will be a break-out in this range again.
There is a correlation between the declining volume before each of the break-outs, volume declines before the break-out happens. This happens because volatility and interest gets lower in each re-accumulation while price is moving sideways. You can see it marked in my chart.
Short-term: A bounce from the 340 to 370 USD range is expected while stochastic RSI is forming an bullish divergence (over-sold)
Middle-term: After the bounce to the 370 USD range there will be a pull-back in the 340 USD range just like seen in the re-accumulations before, giving traders the opportunity to open LONGS in this level. After this pull-back happened there has to keeped an eye on the possible break-out coming after the re-accumulation finished, this will be the perect spot to open new LONGS because the market confirmed the pattern as seen before.
Long-term: There is still way to go for ETHUSD as the cryptocurrency market is in an steady up-trend, i do not think this will quit so soon. To earn in this market is not so difficult as some people propagade it is BUT it must be made SMART!
On the other hand this must not 100 % play out, there is also an other option for the market... to reverse in this level, i will do another analysis on this second scenario, which for my turn isnt the more likely one. So why do i call this re-accumulation?! There are several factors which point out that these ranges are re-accumulation periods, please leave a comment if you want a detailed analysis on this.
This pattern can be traded in several ways, short-term traders can make use of the range we are trading in taking care of the possible top coming in the re-accumulation period, the aggressive approach would be to open a LONG position here before the break-out happened, the conservative approach is to wait until the break-out happens and open a LONG position. Be aware, there is always an fake-out in these ranges seen before.
Thank you everybody for watching, love you all! Its ok to give me an like or follow, supporting my future analysis friends. Have a nice day!

GBPAUD - EDUCATION - 23. JUNE. 2019Welcome to DACapitalTrading, We provide any kind of Technical and Fundamental Analysis
for Forex and Crypto-Currency Markets every day!
-
1 HOUR
Sideways waving market looking for a takeout direction.
4 HOUR
Heading down, I see a break below previous week lows.
DAILY
Bullish market found its top and resistance now, we need a pullback to takeout long holders.
OVERALL
Waiting for a break below/above a main level. Expecting market to form new weekly lows and head back up
into main price movement area before heading further down or making new highs overall. There should be a
lot of market movement this week. Will update as soon as something happens.
Good luck
-
Leave us a comment or like to keep our content for free and alive.
Have a great week everyone!
ALAN

Bitcoin's Possible Failure and RetracementCurrently, the price objective of the broadening wedge has not been hit, that is bitcoin's failure. If the top of the broadening wedge does not hold, then it will most likely retrace.
In White, there was a small ascending triangle/Double top on the 4 hour time frame, and it broke out to the down side, it is possible that BTC will retest the top of the broadening wedge, which is around 10100 to 10000, failure of this area to hold will most likely indicate a retracement to the 6k levels as previously mentioned. This would also void the previous analysis of the parabolic move.
There is still ample space in the 4hr RSI to fail, however, a bounce off of anything above 40 would still be indicative of bullish moment, however, if it fails to bounce in that region, then the daily must be analyzed to identify, whether bearish moment has seeped into a larger time frame. In addition, there is a bearish divergence, however, this may only be worth noting on this time frame.
Previous Analysis:

EURUSD - EDUCATION - 15. JUNE. 2019DACAPITALTRADING V2.0:
Welcome to DACapitalTrading, We provide any kind of Technical and Fundamental Analysis
for Forex and Crypto-Currency Markets every day!
-
1 HOUR
Very bearish price action on friday with a strong negative closure for last week.
4 HOUR
Pullback after forming a med-timeframe Double top with a strong reaction.
DAILY
Bearish waving market turned bullish with a strong reaction and pullback afterwards.
OVERALL
Bullish market with over 50% Pullback of previous week price action + wave formation,
expecting market to drop below previous week lows and rise very strong instantly afterwards.
Very good setup with high probability, we patient to get good entries next week :)
Good luck
Leave us a comment or like to keep our content for free and alive.
Have a great week everyone!
ALAN

EURUSD - EDUCATION - 08. JUNE. 2019DACAPITALTRADING V2.0:
WELCOME TO DACAPITAL TRADING, WE PROVIDE ANY KIND OF TECHNICAL AND FUNDAMENTAL ANALYSIS
FOR FOREX AND CRYPTO-CURRENCY MARKETS EVERY DAY!
-
1 HOUR
Strong bullish market right now forming new highs.
4 HOUR
Bullish breakout with strong buyers pressure.
DAILY
Over 60% pullback of previous elliott wave and range.
OVERALL
Very strong market right now, I expect market to form new highs at the beginning of this week and pullback
towards our psychological level midweek/end of this week. Depending on market open if price gaps down there might be
a strong selloff on monday impacted by npfs on thursday.
I will update you as soon we get some price action :)
Good luck
LEAVE US A LIKE AND COMMENT TO KEEP OUR CONTENT FOR FREE AND EVERYONE!
HAVE A GREAT WEEK
ALAN

CAD/JAP: Swingtrade-Opportunity#SELLHey tradomaniacs,
welcome to another free signal!
Important: Wait for the BREAKOUT through the trendline and sell!
-----------------------------
Type: Swingtrade
Sell-Limit: 80,438
Stop-Loss: 81,134
Target 1: 79,558
Target 2: 79,036
-----------------------------
LEAVE A LIKE AND A COMMENT - I appreciate every support! =)
Peace and good trades
Irasor
Wanna see more? Don`t forget to follow me.
Any questions? PM me. :-)

BTC Retracement to 6,000 - before the next bull runAs you can see, BTC has gained a lot of selling pressure over the last few days. Perhaps due to bigger participants taking profits after we hit the psychological number of 9,000.
The ADX shows buyers are starting to gain dominance, indicated by the red line crossing the green line. And volatility is starting to pick up.
Furthermore, i have taken a previous move from the last major bullrun which is a mirror image of the current move.
History tends to repeat itself.
Furthermore, this matches up with a 50-61.8% retracement.
For even more confluence this would tap the psychological number of 6,000.
I will be cashing out my BTC into stable coins for the meantime, before a rentry after more confluence.
As it is still possible this could be a major fakeout, even though that is unlikely, i like to consider all options.
Conclusion -
Bearish momentum to the downside (6,000) before a nice upside move.
BULL MARKETS ARE BUILT ON BEAR BLOOD.
BEARS WILL BE SELLING SELLING SELLING. THE MASSES WILL FOLLOW...
THEN THE BULLS COME BACK TO FIGHT.
Happy trading.

9500-11k? Or fakeout?I could be incredibly wrong, but this setup looks like the perfect storm for a fakeout after we test 8500. Even if we do make new highs, ill be incredibly cautious to open any more new long positions. Even though trading view says my investment strategy is shorting, im not interested in opening any new short positions either. I wanted to clarify that, I want to go long but now is certainly not the time.
If we break new highs, people start fomoing into long positions only to realize we don't have the fuel to break resistance we haven't yet even touched. In order for leverage trading to be directional to price action, there needs to be more people actually trading spot. For instance, if everyone is going long, market makers can just use that to cause the market to move in the opposite direction if there aren't the same amount of positions open on spot.
I think we are due to at least test 8500 once, but with everyone in the same mindset that if we break new highs, were FOR SURE going to 10k. This is bad thinking and just another example of why it's good to be a contrarian. The moment we create a new local high, every oscillator will be screaming divergence. I can't imagine this being algorithmic, it would have to be 100% market maker participation.
Bitcoin as of recently has not been a technical market, it has been 100% emotional. At this moment, It's a contrarian's market and has been since we capitulated below 6k back in November 2018.
Market makers have 1 job, that is to make a market and they have been doing a good job creating a ton of emotions along the way.
The real question is... when will people stop longing the dips rather than actually buying the dips? This is going to be interesting.

4hr h&s could trigger but could still be a bear trap.4 hr h&s in play on btcusd. if it validates we will drop to the double reinforced support of the 4hr 200ma and the 7427 horizontal support. Even if this happens there's still plenty of ime left i the new candle for it to still be a bear trap / fakeout....act accordingly set smart limit sells and limit buys based on these zones...is what I would do myself *not financial advice*

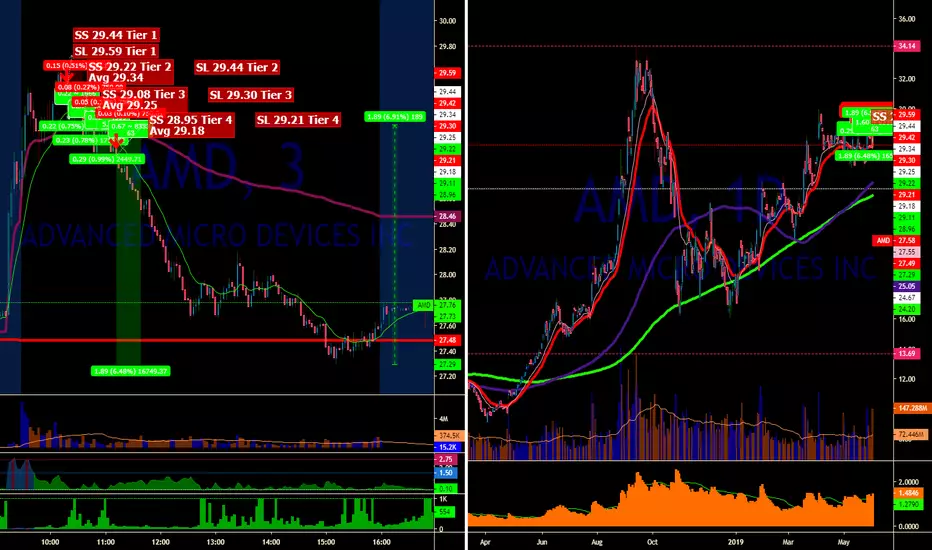
Fake out leads to a drop! Lower lows and VWAP AMD another Home Run trade. When breaking out new highs the price has to sit to the higher levels confirming an area of confluence and stabilization. If it gets back to breakout levels it could then just drop at least retesting VWAP. 29.60 / 29.95 has been an important level on AMD. Touched and heavily sold today 29.62 has been shorted again! Price confirmed the down trend fading off the 13eMA perfectly. First take could have been just at the first time price crossed the 13eMA. Second take at the break of 28$ and one more piece could have been closed at next cross. Last one simply let it go break even. And in this case would have produced another nice movement in our favor closed at 27.50
US 30 Near Pivot? Or Lower? Calls or Puts?!? Or Cash!?!See TLs in chart. Might be setting up for a bear rally like the two spikes we saw in Nov & Dec; or might still head lower to the long-term TL beneath.
Appears like the A-B-C pattern may be nearing completion; unless it's another fakeout and we enter a real Wave 3 downtrend... so chancy now. Expected a bit lower but no massive selloff yet; market holding its breath, a tweet could spark rally from here, or break it. Lately more tough tweets than sweets...
Fed probably won't ease or tighten atm, IMO. Trade war will likely continue through the 2020 election cycle- both sides want to look tough, no faceloss.
If it cascades to give a double bottom there will likely be a significant rally from area of Dec lows. Really uncertain now; can do either; might do both!
Sidelined in cash atm guardedly brooding; whither hence?!? See if we get consolidation over this week at these prices... wait and see safest bet atm IMO.
Just an idea... not any kind of investing advice; trade at your own risk- GLTA!


Fomo/Manipulation Fake Out? Lower highs, Lower lowsHey dudes!
I can't help but look at it in the bigger picture.
I agree since our last low in December that it has been looking bullish but overall I still see lower highs and lower lows.
If the Bull run has started wouldn't it be confirmed by getting a new high ABOVE $7,300 which was in theory the last high we have had. And after closing above $7,300 we would need a new low ABOVE the previous low of $3,100.
NVT over bought
RSI over bought
Fear and Greed index: Extreme Greed
Congressman talks of bitcoin Ban
Tether and Bitfinex Scandal
Binance Hack
Yet price is pumping through resistance like it's nothing.
Is this just a big fake out being fueled by whales, tether/bitfinex and ignorant moon boys?
Is it being fueled and pumped to soon come crashing down with the strength of a thousand suns to wreck havoc once Tether goes down?
Or has the bull run genuinely started and we are off to the moon?

BTC which way will you go?Hi,
We can see BTC/USD has broken it's symmetrical triangle to breakout of the long term downtrend. it has now created a bull flag or ascending triangle. As we know BTC is great at painting pictures and then going the other way.
If it breaks up and runs whole length of the flag pole we are looking at it breaking back into the previous resistance area, if it breaks down with one of its famous Bart Simpson fractals (possible double top inside the ascending triangle to watch also) and also runs the length of the flag pole we are back down into the previous support area.
note the Golden Cross looking to happen on the daily chart, yes this is a great bullish sign but does most certainly not mean that it will sky rocket to the moon. many times after a massive downtrends will indexes, stocks and alt coins cross back with a Death Cross only to rally slowly in the upward direction to show strength and long term rigidity.
up to you. not advice just an opinion.
enjoy the charts,
Boo Cha.

AUDJPY Range Breakout May Be A FAKEOUT!
Look at the attached image where price is confined in a channel of a weekly chart. We can see the presence of the weekly 50 EMA which often acts as dynamic support and resistance in most cases. The price did breakout from the range but however it failed to close above weekly 50 EMA! The price is now headed back to test the range's resistance and most of the traders would think its a good opportunity to enter at this stage.
Well fundamentally its a good setup to enter as the trade deal is almost done which usually helps the AUD in this case however looking at the technical perspective we have to be concerned that the price has NOT yet closed above the weekly 50 EMA! so what can we do to trade this pair cautiously?
Well logically we should wait for the weekly candle to close above the weekly 50 EMA and go LONG from there with the upper end of the weekly channel as our primary target. As for now i want to see where the weekly candle closes and how does the price behave in the coming weeks before i take this pair LONG.
Hope you find this analysis useful, if you do please leave a LIKE and FOLLOW me if you want to receive future trade analysis. cheers and thanks

UJ Go with the Trend UPThere is a good probability for UJ to go UP and continue the trend from January!
At least 3 signs...
Fake Breakout
Bollinger...
Wicks not closing under line


EURUSD - (Bearish) Inside Bar / Pin Bar Fake-OutThe EURUSD has formed a bearish inside bar / pin bar fake-out. This has formed on the weekly charts. There are a number of things to really like about this setup: not only is the pattern itself large and well defined, it is also setting within a larger overall bearish trend, and has formed just beneath some key resistance levels. It really checks all of the boxes for things I look for in a good setup. One of the negatives of this trade is that price is sitting just above a local support level. Due to that fact, we may see price retrace a bit higher early next week before attempting to break lower.

QUICK HIGHER TF DXY ANALYSISPRICE FAILED TO CONTINUE BULLISH MOMENTUM AFTER MONTHLY FIB BREAK (FAKEOUT) .. TIME TO ADJUST AND LOOK FOR SHORTS AND ADJUST ALL ASSOCIATED PAIRS.. IF PRICE FAILS TO BOUNCE 96.50 TO 96.00 AREA THEN IM SHORT UNTIL NEXT MONTHLY FIB SUPPORT 2ND WEEK OF MARCH

Crypto Total Market Cap Breakout/FakeoutIt looks like we may be experiencing a technical breakout of the downtrend on the total crypto market cap and possible reversal of the great "Crypto Winter"/Bear Trend of 2018.
The downtrend in blue has just been breached and we see a very rapid and sharp increase in volume over these past few months. This could be read as a potential capitulation/accumulation signal.
Ideal longs were placed and entered 2-3 months ago for swing trading with BTC around $3,500 level, ETH under $120, and LTC under $30, but traders waiting for technical signals that confirm the breakout to enter should watch closely.
There is a moderate risk that this could also be a "fake-out" breakout by the market maker so make sure we see some real volume onthe break before entering any sizeable positions. A fall back under the trend-line with no volume to back up the break could leave a lot of margin longs with their pants down.
As always, D.Y.O.R. and happy trading!

Last Kiss or Fakeout?its friday and quadruple witching day in the markets... cad is dead lol
read higher tf PA will be watching this closely :))

EurCad approaching major level... break? fakeout?coming to major level here very strong, cad is completely dead this morning lol
probably a break and will be watching for the retest, beware cuz its friday and quadruple witching day (google) so it may be a fakeout and give large large wick
i will be waiting for last kiss or that big fat fakeout
read higher tf PA :))
