GBPUSD - 61.8 FIB LEVEL 🚀the GBPUSD price is on fibonacci support 🔥
i predict a bullish move 🚀
🧐 waiting for a RETEST🔥
Fib

XNO NANO - RE-LISTING ON BINANCEHello people!
For the last few days NANO was delisted from Binance because the NANO foundation changed the ticket from $nano to $XNO to fit better the financial naming standards.
Today the chart is back on and super fresh. Some people managed to sell it for 3.9, which is extremely profitable considering that at this moment the price sits at 2.13 usdt.
I think that the fib sped fan helps us observe some interesting points of contact for short term operations.
Have a great week, people!

Symmetrical Triangle - UpdateHD catching my eye here after it bounced off the long-term uptrend it has been holding- Currently sitting right on its 200-day EMA, seemingly looking to reclaim and close above the .786 FIB level, MACD cross on the 4-hour, forming a big symmetrical triangle while also starting to break out of a falling wedge on the hourly timeframe. Additionally, HD formed a massive bullish shark harmonic pattern- Personally am bullish and will be looking for a breakout here (Broader Market Conditions Permitting) Just some FIB levels & RSI-based supply and demand zones to keep an eye on in the meantime - Previous charts are attached below
- Bullish Shark Harmonic Pattern
- MACD Golden Cross on the 4-Hour Timeframe (Not Pictured)
- Breaking out of a falling wedge on the hourly timeframe (Not Pictured)
- Sitting on the 200-day EMA as well as the .786 FIB level
- RSI starting to get out of oversold territory with buyer volume picking up
PT1- $360.68
PT2- $361.17
PT3- $362.12
PT4- $354.20
--Previously Charted--


MSFT earnings and long term predictionI am going to long MSFT for these reasons
~We have officially touched the 0.786 fib retracement which is a great sign to go long again
~MSFT earnings on Tuesday. MSFT bought out Activation Blizzard, so it will be interesting to see how they announce their plans.
~ALSO A while back, Mojang merged Minecraft launchers with Microsoft. SO now all minecraft java users use Microsoft login instead of mojang login.
~On the 4 hour chart there is VERY CLEAR BULLISH DIVERGENCE
~From the last ATH MSFT has pulled back 15 percent, which is a really big pullback.
~We are also on the bottom of the downward wedge, meaning that this will be a good zone to set enter with a SL below the support. As it is a very small loss. With downward wedges, it most likely will break on the up.

Canara Bank Long Term View Positive Canara Bank Long Term View Positive Can give long target as shown in chart

#BTC Short After falling we seen retracement 50% and now we see Fib Extensions
Entry Short: $36,000
StopLoss: $37,750
Final Target: $30,000

BabyDoge All possible support and resistance Lines BabyDoge All possible support and resistance Lines lets see which trend line is following , fib retracement working perfect

CRYPTO.COM COIN (CRO) FIB RETRACEMENT SCENARIO EARLY FEB 2022As you can see, BITTREX:CROEUR is still in a clear downtrend with a correction end-December 2021, CRO looks like is going to make a new correction/retracement, here is my scenario:
What makes CRO Long (for the next weeks, globally still in a downtrend)?
Strong bullish candle
Crossed RSI for the first time since last retracement
Till where is the to coming retracement to go?
Last retracement reversed at around 50%-61.8% fib level
To coming retracement is very likely to reverse around the same levels
Retracement or Trend Reversal?
movement looks like a retracement,
BUT, Crypto.com has recently made an NFT marketplace, and built a Stadium
Crypto.com has big upcoming projects
Therefore, new investors may buy CRO and pump the price
What about long term?
Crypto.com has huge potential to hit >10$ maybe it might be within the next five years and with inflation creeping up people are looking for places to put their money to hold its value and coins like CRO will always attract
attention as they market their brand and project very well.
You don't need to buy the current dip, there will certainly be many other possiblilities
Is the price likely to pump again like it did in November 2021?
Most likely NOT, in the next months, maybe in the future
------------------------------------------------------------------------------------------------------------------------------------------------------------------------------------------------
If you enjoyed this post and agree with me, a like and a sub would be very nice : )
Stay updated for more content
Have a nice Day : ) Bye!
-----------------------------------------------------------------------------------------------------------------------------------------------------------------------------------------------

BTC/USD Bull Market PredictionBased on the chart history of BTC, the initial flash crash of 30% - 40% indicates a more than likely bear market. If so, BTC should bounce off the next support range and retrace to the .5 - .702 fib. After the retrace we should expect an 80% - 90% crash during the bear market. This similar structure can be seen in the past and I am strictly copying the historical data. This should be expected until new events and data prove otherwise. This bull run has been similar to the past bull runs.

ALGOUSDT W time-frameA very strong project, coming to nice entry point area.
fib channel bottom line.

EURUSDEURUSD
short trade for eurusd
reason for long position
price is respecting the 4H trendline
1H chart price could not break the 61 fib
bullish engulfing candle close

XAUUSD Elliot Wave Forecast - Wave 2The chart illustrates a regular flat within the longer term correction which consists of a 3-3-5 wave sequence (A,B,C). Currently unfolding is the subdivision of Wave C which began from the November high of 1877.14.
Wave 2 is typically 38.2%, 50%, 61.8%, 76.4%, or 85.4% of wave 1.
Sustained pressure saw an eventual break of the resistance at the 0.618 fib level before halting at the 76.4% level. The pull back could extend further to the 85.4% towards 1859 before resuming the final stages of the correction. On the contrary, wave 2 is now potentially complete.
I hope you found this useful, do leave your thoughts in a comment below. As always, a 'like' and 'follow' provides encouragement to share further ideas.
Thank you for taking the time.
BeyondEdge
Your Edge Is Your Perception. Go Beyond.

Uno/USDT 0.36 $Swimming against the water is sometimes smart
FA:
Low MCAP
Recently partnered with SYS
The world’s first reinsurance trading platform powered by Polkadot.
The platform removes barriers to entry for investors with regards to capital and regulations, while also encouraging the people to take part in the process of insurance and reinsurance.
Uno/USDT 0.36 $

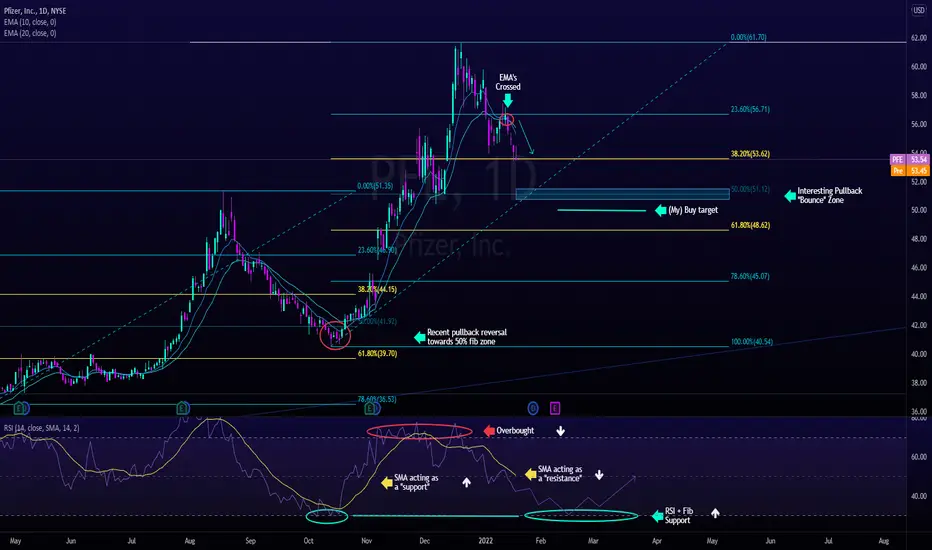
PFIZER (PFE) BUY STRATEGY TA SCENARIO IDEAI made a personal TA on NYSE:PFE using FIB retracements to define when to buy the current pullback reversal.
PFE is currently in a very clear uptrend an its previous pullbacks "reversed" at aroung 50%-61.8% FIB so i think that this current pullback is going to reverse at around 50%.
Before buying:
Check Rsi bounceoff and SMA positionning to form a support
Check if EMA's are likely to cross (strong uptrend)
Dont wait to buy at exactly 50% fib level, price may reverse earlier and you miss the dip/opportunity, or you miss a lower dip at around 61.8%
If price drops further down, may be a sign of a trend reversal !
!! This is not investing advice, you shouldn't (At all) follow my buy setup, this is a personal TA which may differ from yours.
------------------------------------------------------------------------------------------------------------------------------------------------------------------------------------------------
If you enjoyed this post and agree with me, a like and a sub would be very nice : )
Stay updated for more content
Have a nice Day : ) Bye!
-----------------------------------------------------------------------------------------------------------------------------------------------------------------------------------------------
GU ShortsCurrently price is in a bearish trend and is making LL and LHs. We have just stepped out of this trend by not creating a new LL. however NY and LDN sentiment has been bearish the past few sessions at these levels we are pushing up into now so I'm looking to try and get an entry at the 78.6% retracement and then for the NY session to have a bearish sentiment pushing us down to form a new LL. We are following the trendline nicely and have just had a BOS to the downside.

XAU/USD SellsGold sells into the FVG. Entry is a on a wick rejection from the 78.6% retracement after the BOS to the downside. Another confluence was that our entry was inline with the current OB in the market for the last downside push and we just broke the daily low which has invalidated the current range and presents a bearish outlook to me.

#BITCOIN Scalp SetupIn this chart we are trying to find a LONG opportunity.
A way to find a possible scalp or pivot point is to look for where bottom or top of trends align with horizontal support & FIB levels like 0.382, 0.5 & 0.618.
When trading I give horizontal support with the most respect followed by the FIB's 0.618 being the strongest.
I do not trade diagonal trend support and resistance lines on their own as they can be subject to bias depending on how you place. To avoid bias in the diagonal trend lines you can mark the most touch points possible while keeping as much width as possible.
However when all these line up you might be looking at an opportunity. this works both long and short.
the blue circles shows all the times the white horizontal line has acted as support resistance. you can see early on in this pattern it was very active.
All these supports, trends and FIB's lining up with each other makes this a possible thesis on the very least being a scalp long here if not a price pivot.
remember to keep stop loss close but not to close to get caught in a stop hunt.
bank roll preservation is key. you ill be wrong more than right but you only need to be right once to make up for all the wrongs if you keep stop loss tight.
Going back to my earlier hidden bullish divergence thesis adds confluence as well to more strong bull case forming long term.
good luck trading
for more follow @brooklynboy436

Falling Wedge- BullishWatching SOL closely here, treading lightly in the crypto space with all of the FUD surrounding pending regulations. However, SOL is looking quite nice here and is currently sitting right on its 200-Day EMA. Additionally, SOL is holding a big falling wedge with a little cup and handle at the end. Bullish on SOL long-term and will be watching closely for a breakout from this wedge- just some FIB levels along with some RSI based supply and demand zones to keep an eye on in the meantime
- Falling Wedge
- Cup and Handle
- Sitting right on its 200-Day EMA & Bounced off the .00 FIB Level
- Bollinger Bands are Squeezing (Not Pictured)
- Slight Bullish Hidden Divergence on the RSI on the 4-Hour Timeframe (Not Pictured)
- Buyer Volume Picking Back Up


LTC - resistance lineForgotten by many LTC, it is currently battling resistance at $ 146, breaking this point could be a good turning point for the green candles. As you can see after leaving the downtrend channel, a new channel has been created, announcing increases.

GBD / USD Downtrend Weekly RetraceWeekly Chart.
Breaking out towards 1.40 Resistant with possible rejection.
No Diversion.
Extended correction down the Gann Angles to 0.618 Fib Retrace level at 1.25.

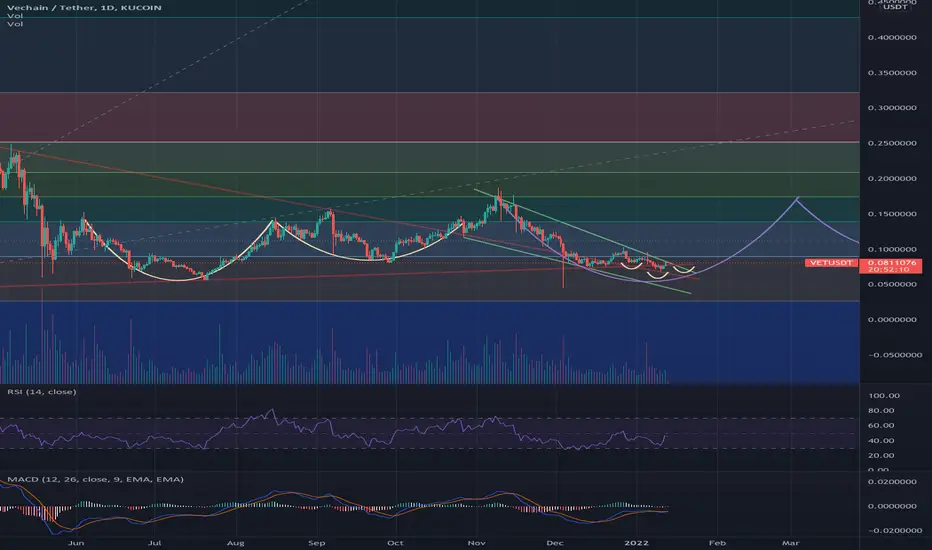
$VET H/S Forming to begin right wall of cup (followed by handle)*THIS IS NOT FINANCiAL ADVICE*
Overall, I am bullish for VET's 2022.
If you take into consideration their niche, and their current partnerships, you'd be bullish on VET also...
If we take the April - May '21 run-up to the .20 cent range, we can consider the top there to be the .786 fib line on a larger scale.
Otherwise, on a smaller scale, it is the .236 "top" fib line but we currently sit under the .786 which acts as resistance.
If you zoom in, you can see the potential formation of an inverse Head and Shoulders which could act as a retest for the green upper trend line.
If it flips it for support, expect a retest / completion of the 2nd shoulder + the starting of the cup wall up to the .618 and .5 fib lines.
If the .5 fib line is flipped when finishing the handle I do not expect much resistance at .382 line... but if there is, expect the handle to be formed.
Or, it could just be a hell of a year for Vechain itself, and none of these lines matter, and we go to $1 and beyond with ease 🤷🏻♂️