XAU/USD (Gold) – 1H Chart Analysis UpdateMarket Structure
The chart is trading inside a rising channel, which indicates that the broader short-term trend remains bullish.
At the same time, a descending trendline is controlling recent price action, showing a temporary pullback within the larger uptrend.
This creates a trend vs. correction scenario where traders watch for either a breakout or a rejection.
Key Technical Observations
1. Ascending Channel
Price continues to respect the upper and lower boundaries of the channel.
As long as
Foerx
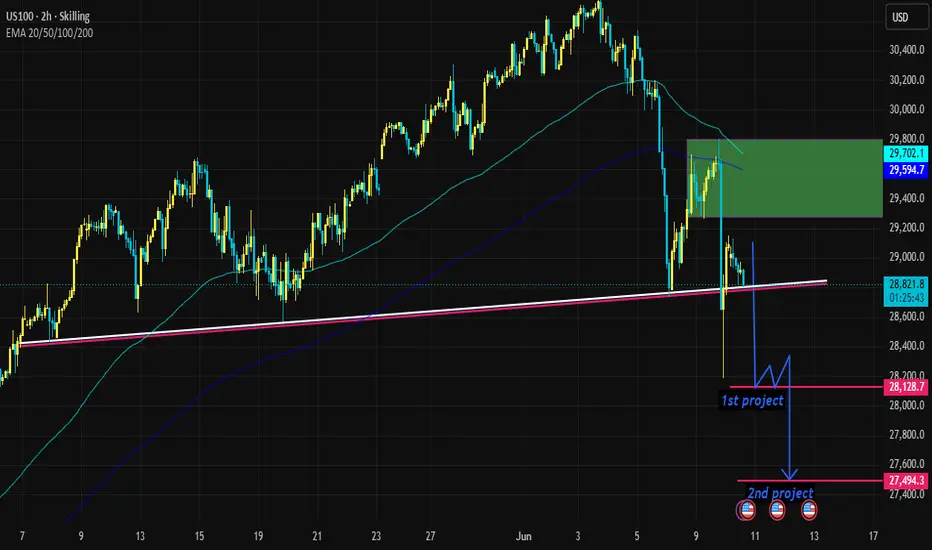
US100 2H: Supply Zone Rejection Signals Further Downside PotentiUS100 2H: Supply Zone Rejection Signals Further Downside Potential
US100 | 2H Educational Analysis
The market has rejected a key supply zone and is currently trading below major moving averages, indicating continued bearish pressure.
🔹 Resistance / Supply Zone: 29,250 – 29,700
🔹 Current Price Area: 28,800
🔹 First Target (TP1): 28,128
🔹 Second Target (TP2): 27,494
Educational Trade Setup:
• Entry Area: Bearish rejection below 29,250
• Stop Loss (SL): Above 29,750
• Take Profit 1 (TP1): 28,128
Gold is waiting for news from the CPI indexThe international gold marketplace final week constantly acquired critical records, inflicting costs to constantly reverse. Notably, at the final buying and selling day of the week, the marketplace suffered shocks that prompted costs to constantly "plunge". In simply 1 day, gold misplaced greater than 3.5%, marking the most important intraday sell-off considering 2020. In the cutting-edge context, maximum analysts agree with that gold costs might also additionally check aid stage of 2,two hundr
gold awaits the Fed interest rate meetingGold fell sharply from $2,159 to $2,146 because the USD turned into supported with the aid of using growing US authorities bond yields earlier than turning up aGold fell sharply from $2,159 to $2,146 because the USD turned into supported with the aid of using growing US authorities bond yields earlier than turning up and finishing the day around $2,one hundred sixty because the USD leveled off. Precious metals can't escape as monetary statistics continues to be correct and the Fed hobby charge o
gold compared to the closing level of last week's trading sessioDuring yesterday's trading session, gold prices fell slightly as traders were still looking forward to US economic data and focusing on the situation in the Middle East.
According to Richard Snow, Strategist at DailyFX, gold prices show signs of falling due to calls for efforts to reduce escalating tensions in the Hamas-Israel conflict.
Reuters quoted Jim Wyckoff, senior analyst at Kitco Metals, as saying some took profits earlier in the session and then traders came in to buy when prices fell
Cad ShortWill be waiting for the market close to decide whether i trade this, if it closes below the weekly support line that has been holding since the 9th of feb then this will be a good intraday trade and price will have further downside until it reaches the next cleangr support level. This one is a trade of patience wont be making a move until the market decides where price is going i will be expecti a slight pullback before fruther downwards movement and that is when i will enter with RR at 3:1 this
AUD/USD - Strong Support At 0.7600 - 2/3/2017AUD/USD 's topside was contained between 0.77 and 0.78 for entire year during 2016. So far it is very similar story like in the beginning of 2016. AUD/USD has strong start of the year by climbing 1000 pips - from 0.68 to 0.78. Thus it's natural for current uptrend to pause near the same level. Whether we will see 0.80 in coming sessions will depend upon how 0.76 and 0.75 holds. As we kept on buying AUD/USD and NZD/USD during decent pullback during last year to accumulate more than 1000 + pip