FTTUSDT Forming Bullish Pennant#FTT
The price is moving within a descending channel on the 1-hour timeframe; it has reached the lower boundary and appears poised for a rebound, suggesting a potential upward move upon retesting this level.
The Relative Strength Index (RSI) indicates a bearish trend, but an upward breakout is likely due to oversold conditions on the 1-hour chart.
An orange trend line supports the potential upward rebound.
There is initial support at 0.2005, acting as a primary support zone.
A key support z
FTTBTC
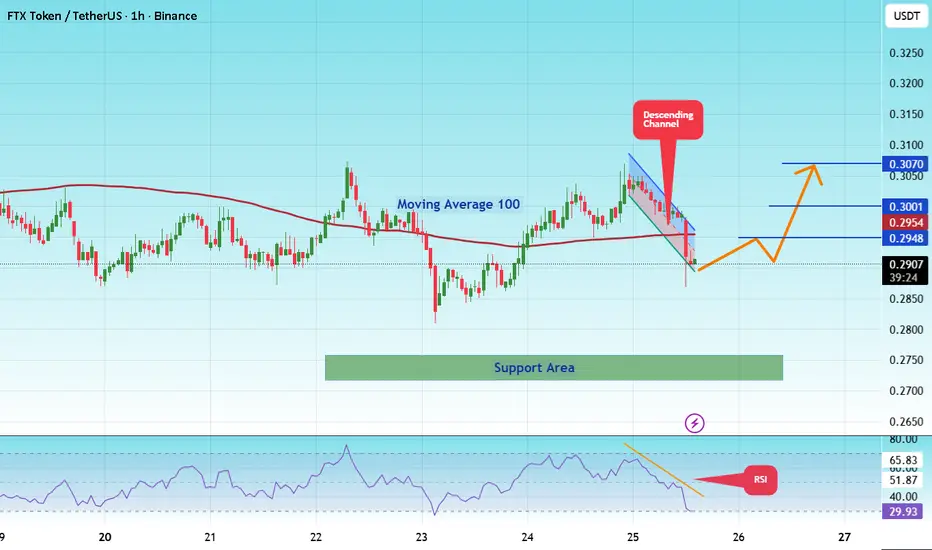
#FTTUSDT — Descending Triangle: Ready for Takeoff or Breakdow#FTT
The price is moving within a descending channel on the 1-hour timeframe and has reached the lower boundary. It is now poised for a bounce and is expected to retest this boundary.
The Relative Strength Index (RSI) indicates a downward trend, which is likely to continue given the overbought conditions.
There is a key support zone (in green) at 0.3066, and the price has bounced off this zone several times, making it a strong support level.
The price is trending towards the 100-period movin
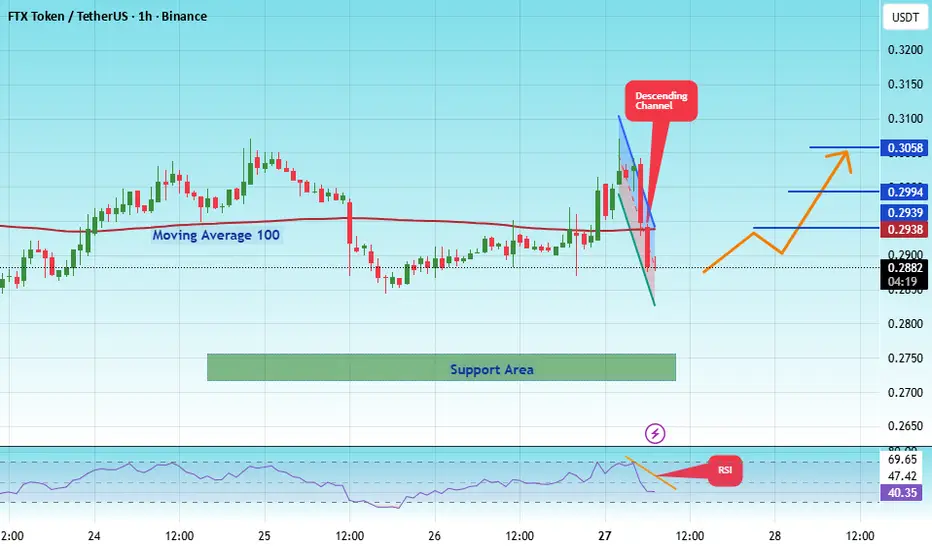
#FTTUSDT — Descending Triangle: Ready for Takeoff or Breakdow#FTT
The price is moving within a descending channel on the 1-hour timeframe and has reached the lower boundary. It is now poised for a bounce and is expected to retest this boundary.
The Relative Strength Index (RSI) indicates a downward trend, which is likely to continue given the overbought conditions.
There is a key support zone (in green) at 0.2720. The price has bounced off this zone several times, making it a strong support level.
The price is trending towards the 100-period moving av
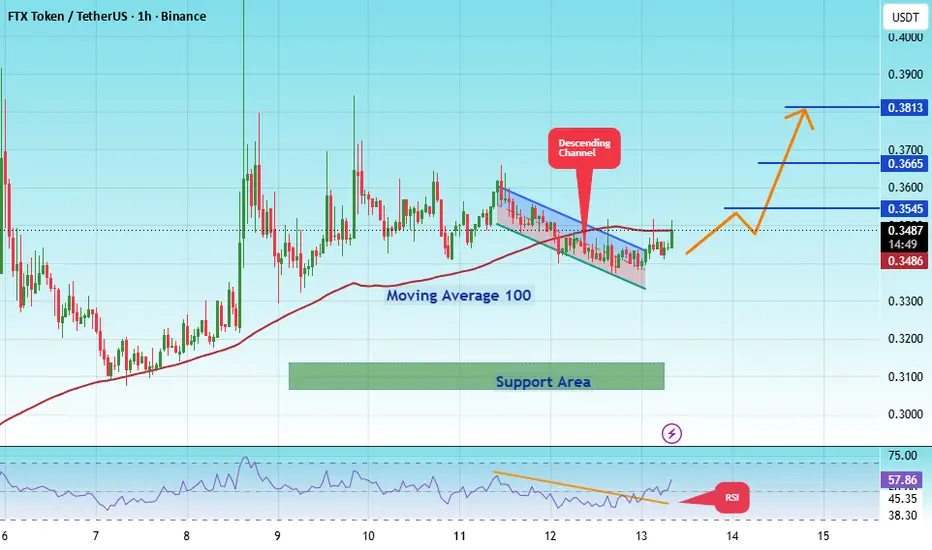
#FTTUSDT — Descending Triangle: Ready for Takeoff or Breakdow#FTT
The price is moving within a descending channel on the hourly timeframe. It has reached the lower boundary and is trending towards a bounce. A retest of this boundary is expected.
The Relative Strength Index (RSI) indicates a downward trend, and this trend is likely to continue due to the overbought condition.
A key support zone has been identified in green at 0.2713. The price has bounced off this zone several times, making it a strong support level.
The price is trending towards the 1
FTTUSDT Forming Bullish PennantFTTUSDT is forming a clear bullish pennant pattern, a classic bullish continuation signal that often indicates an upcoming breakout. The price has been consolidating within a narrowing range, suggesting that selling pressure is weakening while buyers are beginning to regain control. With consistent volume confirming accumulation at lower levels, the setup hints at a potential bullish breakout soon. The projected move could lead to an impressive gain of around 140% to 150% once the price breaks a
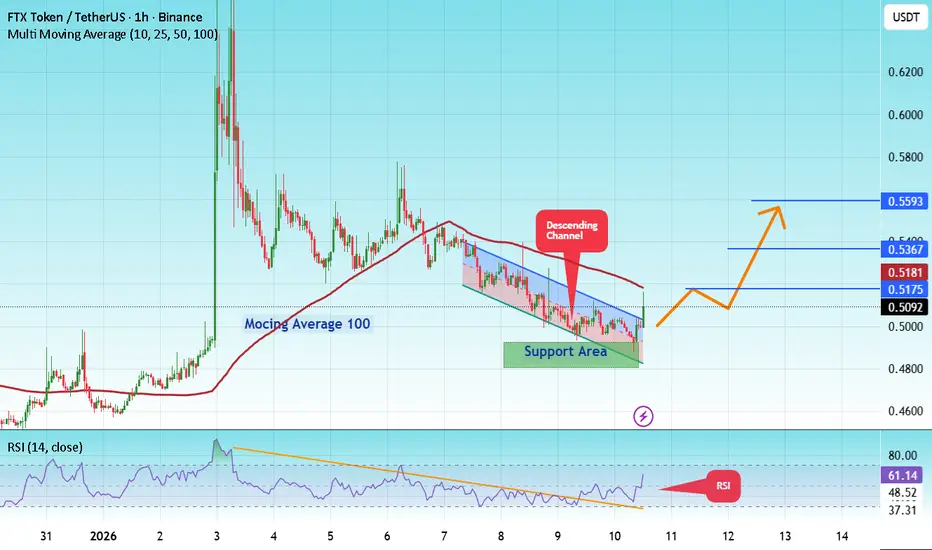
#FTT/USDT : Go to work, it's good#FTT
The price is moving within a descending channel on the hourly timeframe. It has reached the upper boundary and is heading towards breaking it. A retest of this boundary is expected.
The Relative Strength Index (RSI) is showing an upward trend, as it has approached the upper boundary. A bearish reversal is expected.
There is a key support zone in green at 0.4850. The price has bounced from this zone several times and is expected to bounce again.
A consolidation trend is observed above th
TTUSDT Forming Falling WedgeFTTUSDT is currently forming a falling wedge pattern, a bullish reversal setup that often signals a strong breakout ahead. This pattern indicates that selling pressure is fading, while buyers are gradually regaining control. The price has been consolidating within a narrowing range, and with good trading volume returning to the market, the setup looks primed for a potential breakout to the upside. If the momentum continues, a 90% to 100%+F gain could be achievable in the coming weeks.
The falli
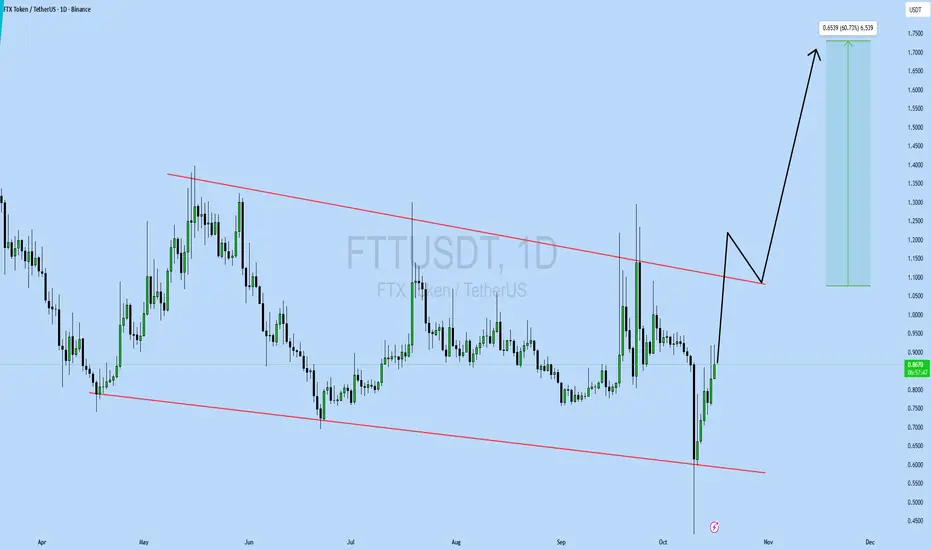
FTTUSDT UPDATE#FTT
UPDATE
FTT Technical Setup
Pattern: Bullish falling wedge pattern
Current Price: $0.870
Target Price: $1.523
Target % Gain: 60.73%
TSX:FTT is breaking out of a bullish falling wedge pattern on the 1D timeframe. Current price is $0.870 with a potential target near $1.523, showing around 60% upside potential. The breakout suggests growing bullish pressure and possible continuation toward higher resistance levels.
Time Frame: 1D
Risk Management Tip: Always use proper risk management.
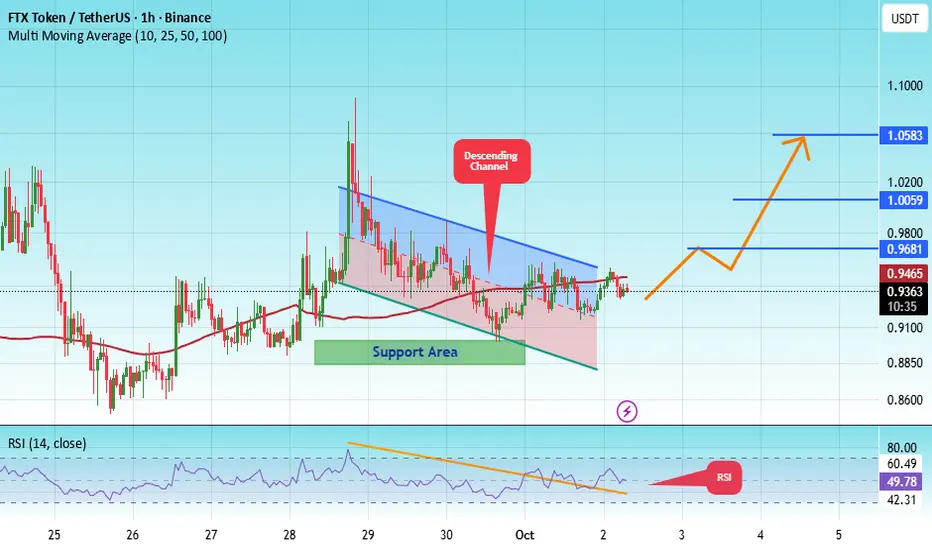
#FTT/USDT : Go to work, it's good#FTT
The price is moving within a descending channel on the 1-hour frame, adhering well to it, and is heading for a strong breakout and retest.
We have a bearish trend on the RSI indicator that is about to be broken and retested, which supports the upward breakout.
There is a major support area in green at 0.8890, representing a strong support point.
We are heading for consolidation above the 100 moving average.
Entry price: 0.9360
First target: 0.9681
Second target: 1.000
Third target: 1.0
FTTUSDT Forming Falling WedgeFTTUSDT is showing a falling wedge pattern, which is considered one of the strongest bullish reversal setups in technical analysis. This pattern often appears after a downtrend, where price narrows down between two converging trendlines, eventually leading to a breakout to the upside. With good trading volume supporting this structure, the technical outlook suggests that FTT could be preparing for a strong recovery rally.
The expected gain of 70% to 80%+ makes this setup particularly attractive
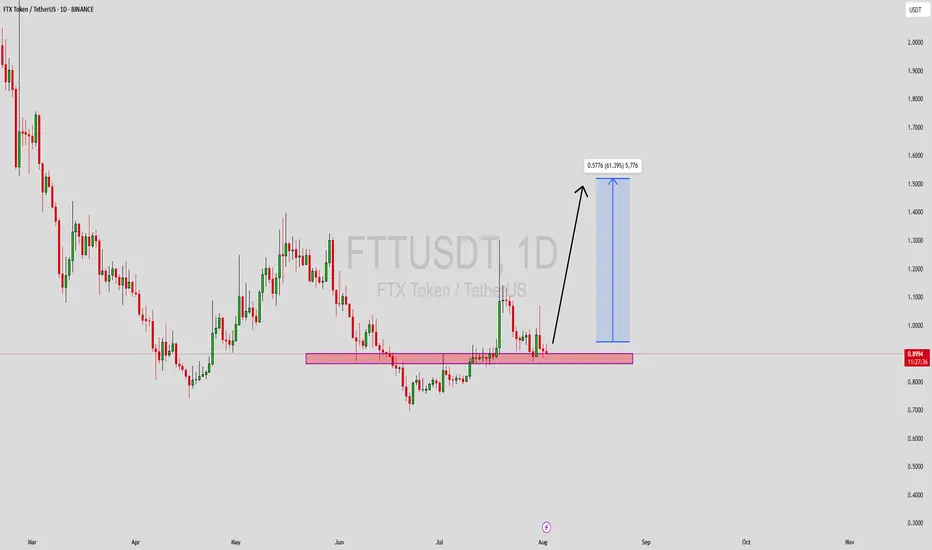
FTTUSDT Forming Bullish MomentumFTTUSDT is showing renewed strength with a clean breakout setup, supported by good volume and strong technical structure. The current chart reveals a clear horizontal support zone that has been tested multiple times and held firmly, indicating buyers are stepping in with confidence. After the recent consolidation, the price appears ready to move higher, potentially offering a 40% to 50% upside in the near term. This setup attracts attention from technical traders looking for confirmation through
Breaking: FTT Has to Break This Price Levels to Start A BullrunThe defunct platform native token TSX:FTT has been on a falling wedge lately losing about 50% of value as the long lasting lawsuit against her founders most especially Sam Bankman-fried is showing no signs of ending.
The token has long been oversold with the RSI at 38.45 further solidifying our thesis and in order for TSX:FTT to start a trend reversal to recent highs it has to break through the 78.6 and 38.2% Fibonacci retracements levels respectively in other to pave way for a bullish spr
$FTT FTT ftx 2 year consolidation between 0.9 - 2.8.... Uptrend?TSX:FTT Ftt Ftx consolidation has spanned from Nov. 2022 till now
A 2-year consolidation between price range 0.9-2.8
Current price: $3.1
My SuperAI just confirmed a super Uptrend on the 3day Timeframe.
A break out from this range will lead up to major resistance 5.5, 6.4
A continuous uptrend can lead up to $21
Invalidation of this #FTT idea is under $2.7
FTTUSDT %378 Daily Volume Spike FTTUSDT has recorded a 378% daily increase in trading volume.
To capitalize on this increase:
I will closely observe the price movement toward the blue boxes on the chart.
I will evaluate potential upward breakouts in lower time frames from these regions to identify entry opportunities.
This strategy allows for careful monitoring and reduces unnecessary risk.
Let me know if you want further edits or additions!
I keep my charts clean and simple because I believe clarity leads to
FTT is about to riseFrom the point where we placed the green arrow on the chart, it seems that FTT has initiated an ABC pattern or a more complex structure. Wave B also appears to be a triangle that is nearing completion.
We expect FTT to soon enter a major wave C.
As long as the green zone is maintained, it can pump toward the TPs.
Closing a daily candle below the invalidation level will invalidate this analysis.
For risk management, please don't forget stop loss and capital management
When we reach the first
FTT , FTX and SAM vs. CZPeter Brandt just post a head and shoulders pattern for FTT!! anyway...
in the hours before FTX secured rescue from Binance, it sought a bailout of more than $1 billion from Silicon Valley and Wall Street billionaires. By midday Tuesday the hole appeared far deeper closer to $5 billion to $6 billion. SBF wrote in a message to staff sent on Tuesday morning, “in the last 72 hours, we’ve had roughly $6b of net withdrawals from FTX”. Withdrawals at FTX are “effectively paused”, he wrote, adding tha
FTT is bearishFTT correction seems to be a diametric. Now it seems that wave D is over and price can enter wave E
From the red range, it can be rejected downwards.
Closing a daily candle above the invalidation level will violate the analysis.
For risk management, please don't forget stop loss and capital management
When we reach the first target, save some profit and then change the stop to entry
Comment if you have any questions
Thank You
FTT: trade in renge📊Analysis by AhmadArz:
🔍Entry: 1.84
🛑Stop Loss: 1.72
🎯Take Profit: 1.95-2.05
🔗"Uncover new opportunities in the world of cryptocurrencies with AhmadArz.
💡Join us on TradingView and expand your investment knowledge with our five years of experience in financial markets."
🚀Please boost and💬 comment to share your thoughts with us!