AAPL GEX – ATH Breakout, 360 Call Wall Confluence in FocusAAPL has broken to a fresh all-time high and is now trading just below 360, the dominant call wall in the December 18 cumulative GEX profile.
The ATH breakout confirms strong price momentum, but 360 has not yet been cleared. It is the key decision point for the next move.
🔶 Regime Context 🔶
Price is above both the 347.5 HVL and 355 cTrans, placing AAPL in a positive GEX regime.
GEX History shows every tracked horizon aligned in positive gamma. The short-dated and M1 profiles have cooled from
Gammalevels
NVDA – Below 170 Put Wall Ahead of Earnings, Momentum in FocusNVDA has broken below the 170 put wall (P1) on the December 18 cumulative profile, with price trading near 168 and earnings due next week (November 17, after the close).
This is not the first break in this area. A previous push lower was bought back, so the break alone is not the story — acceptance below 170 is.
🔶 Regime Context 🔶
Price is well below HVL (192) and below pTrans (175), keeping NVDA in a negative GEX regime. With P1 now broken, price has entered the negative gamma extension
ORCL – Bounce from the 120 Put Wall, 131 HVL OverheadORCL is bouncing from the 120 put wall on the December 18 cumulative profile (45 DTE). Today's low reached 121.35, at the start of the put cluster, and the session reversed to about 125.5, up 5.23%.
The close is back inside the transition zone, below HVL at 131. The bounce is a reaction at the dominant put wall. HVL is still overhead.
🔶 Regime Context 🔶
The put cluster starts at 122 and runs down through the dominant put wall at 120. From 122 up to 135 is the transition zone, with HVL at 131 a
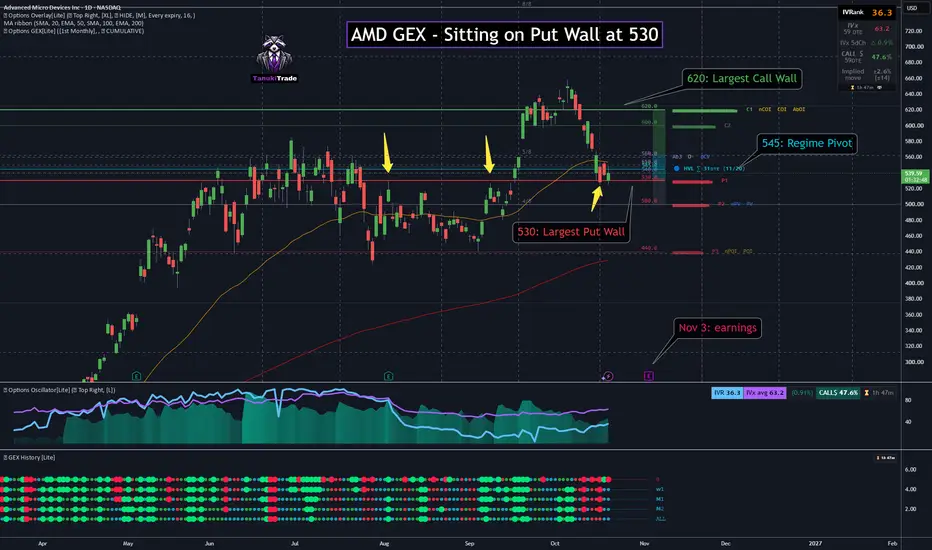
AMD GEX - Sitting on the 530 Put WallAMD has pulled back to the 530 put wall on the November 20 cumulative profile. After the rejection from 620, price is back in the band that capped the chart before the last push higher. That former ceiling can act as support on this retest. Whether it holds is still open.
Spot is near 542, so the close is just above 530 and just under the 545 regime pivot. The level that matters is the reaction at 530.
🔶 Regime Context 🔶
On the November 20 cumulative profile (31 DTE), price is inside the trans
SPX GEX - Under 7775 HVL, 7940 Call Volume SpeculativeSPX is back under the 7775 HVL after the session reached about 7796, and price is now near 7724 on the October 23 cumulative profile (7 DTE).
That high lined up with the start of the call cluster at 7795, then failed. The 7700 put wall is still the dominant downside reference. The live question is whether price can climb back above 7775. Until that happens, the 7940 call-volume print stays speculative.
🔶 Regime Context 🔶
Price is inside the put cluster: below the 7775 HVL, where that cluster a
QQQ GEX - Hot CPI, Negative GEX, 730 Put Wall in FocusQQQ backed off a test of 740 after a hotter-than-expected CPI print, and the 10-year yield is pushing higher with it. PPI is due tomorrow.
Near 737, on the October 23 cumulative profile (9 DTE), price is inside the put cluster and still above the largest put wall. 730 is the level in focus.
🔶 Regime Context 🔶
HVL is at 746. Below it, QQQ is in a negative GEX regime, where price tends to be less stable than above the pivot. The put cluster starts at 742 and runs down through 740 and 734 towar
JPM – Holding Above HVL into Earnings, 345 Call Wall in FocusJPM is holding the bounce from the 330 HVL regime pivot on the daily chart, with earnings due Tuesday. Spot sits in a positive GEX regime above HVL, just through the start of the call cluster, with the dominant call wall still overhead at 345.
🔶 Regime Context 🔶
Price is trading above 330 – HVL , keeping JPM inside a positive GEX regime. The call cluster starts at 332.5 (cTrans) ; spot is just above that line and still below C1. GEX History on the daily is aligned positive across 0 / W1 / M1
NVDA GEX - 240 Call Wall in Play Above the May HighNVDA is pressing into the largest call wall on the daily chart. On the November 20 cumulative profile (46 DTE), that wall is 240, and price is only a few points below it — inside the call cluster, not through it yet.
The May swing high near 235 is no longer overhead. Price has moved back through that prior peak, and 235 is also the third call wall on this profile. The old high and C3 land on the same strike. The decision level now is 240.
🔶 Regime Context 🔶
The call cluster starts at 230 and e
AAPL GEX – Bounce from 330 HVL, 340 Call Wall OverheadAAPL is attempting to turn a controlled pullback into continuation after reclaiming the 330 volatility regime pivot. On the November 20 cumulative GEX profile (51 DTE), price near 337 remains above HVL but below the dominant 340 call wall.
This places AAPL inside the positive side of the transition zone. The immediate test is whether momentum can convert the bounce into acceptance above the concentrated options structure at 340.
🔶 Regime Context 🔶
Holding above 330 keeps AAPL in a positive GEX
MSFT GEX – Fourth Test of 510 as IV and Call Skew RiseMSFT is pressing the 510 call wall again after three previous attempts stalled around the same level. Higher lows continue to preserve the ascending trend, while spot at 509 is now only one point below the dominant November 20 cumulative call wall.
This repeated pressure makes the next reaction especially important. A clear break and hold above 510 would turn the wall from resistance into support and open the positive extension zone, with gamma squeeze potential toward 530 and then 550. Another
QQQ GEX – Rejected at 745–750, Watching the 730 HVLQQQ has been rejected from the 745–750 call-wall zone. The October 2 cumulative profile places C1 at 745 and C2 at 750, making this a layered resistance area rather than a single level.
At the 740.84 profile reference, price is back below cTrans at 742 and inside the 730–742 transition zone. It nevertheless remains above the 730 HVL, so the positive side of the regime pivot has not yet failed.
🔶 Regime Context 🔶
GEX History remains mixed: two of the five tracked expiries have turned negative,
INTC GEX – Testing 110 Multi-Confluence Call WallINTC is pressing into 110 on the daily chart after a strong momentum expansion. Spot is only marginally above the level, so this remains a test rather than confirmed acceptance.
The October 16 cumulative GEX profile makes 110 the central decision point. It is the highest call wall and also overlaps a technically important reaction area visible on the daily chart.
🔶 Regime Context 🔶
With price above the 97.5 HVL and the 100 call-cluster boundary, INTC remains in a positive GEX regime.
GEX Hist
SMCI GEX – Testing the Consolidation Ceiling at 42SMCI is tightening inside a sideways consolidation and is now testing the upper boundary of that range near 42. The current October 16 cumulative GEX profile places the dominant call wall at exactly the same level.
Strength across sector peers provides a supportive tape backdrop, but 42 remains the structural decision point. Price is near 40.95, above the 39 call-cluster boundary and well above the 36.5 HVL.
A clear break and hold above 42 would move SMCI into the positive extension zone, open
QCOM GEX - Above Call Wall @ 185QCOM is extending its daily recovery after establishing a sequence of higher lows from the August low.
At 187.71, price remains above 180—the start of the call cluster—and above the 185 C3 wall. The immediate test is now the strengthened 190 reaction zone, only 2.29 points above spot.
The dominant 200 call wall remains the larger upside decision point. Until 200 is cleared and accepted, QCOM has not entered the positive extension zone.
🔶 Regime Context 🔶
Price remains well above the 162.5 HVL
GC GEX – Testing the 4405 Put Wall AgainGold futures are returning to a familiar decision zone on the daily chart.
The October 16 cumulative GEX Profile places the strongest put wall at 4405 , directly where rising technical support now converges. Previous tests around this structure produced meaningful reactions, making the latest retest especially important.
🔶 Regime Context 🔶
GEX History shows 0, W1, M1, M2 and ALL aligned in negative GEX . This is a volatility backdrop rather than a directional signal: price movements can beco
MU – Breakout Above 1000 C1, 1050 Call Wall NextMU has broken above 1000 , which serves as both the start of the call cluster and the dominant call wall in the cumulative October 16 profile. With spot near 1017.56 , price has entered positive gamma extension after consolidating above its rising 50-day moving average.
The role of 1000 has now changed from resistance to the first breakout-support test. Holding above it keeps gamma-squeeze potential open toward 1050 C2 , followed by 1100 C3 .
🔶 Regime Context 🔶
MU remains well above the 9
INTC – Bounce from 85 Put Wall, Watching 100 Call WallINTC is bouncing off the 85 put wall on the daily chart, with price now holding near 95.61 after reclaiming the 90 HVL. On the October 16 cumulative GEX Profile, that keeps INTC in a positive GEX regime (spot above HVL) and inside the call cluster above 93 (cTrans). The 100 call wall is still overhead — this is not yet a positive-extension story on that swing profile.
🔶 Regime Context 🔶
Price is trading above HVL at 90 , so the regime read is positive. GEX History on the daily is an all-gr
Gamma levels are not fixed: SPY call wall moved 9 pointsA common assumption: gamma levels are set for the week. You note the call wall on Monday and trade against it until Friday.
Here is what SPY's weekly call wall - same ticker, same expiry - actually did on 2 September 2026.
The three lines on this chart are the same level, read at three different times of the same day.
00:30 UTC (overnight) - price 761.8 - call wall 772 - put wall 765 - net gamma -3,848M
12:30 UTC (cash open) - price 762.4 - call wall 763 - put wall 760 - net gamma -1,277M
15:
ORCL GEX – 140 Put Wall Holds, 160 Call Wall in FocusORCL continues to defend 140 after several tests, making this the central level in the current structure.
In the October 16 cumulative profile, 140 is more than the strongest put wall. It also carries the largest absolute gamma and the dominant put-volume strike, creating a clear reaction zone.
🔶 Regime Context 🔶
Spot at 144.98 is above the 143 HVL, keeping ORCL on the positive side of the GEX regime pivot. However, price remains below cTrans at 149, so it is still inside the transition zone r
QCOM – Holding Above HVL, 170 Call Wall in FocusQCOM bounced from the 157.5–160 support area and is now trading inside the call cluster above 165.
🔶 Regime Context 🔶
The October 16 cumulative profile places HVL at 157.5. Holding above it keeps QCOM in a positive GEX regime.
🔶 Key Levels 🔶
170 – C1 + Ab1 + COI + AbOI : major upside reaction zone
175 – C3 + call-volume peak : next reference if 170 clears
160 – put OI and put-volume cluster : recent bounce zone
157.5 – HVL : regime pivot
155 – P1 : strongest put wall
🔶 Option
AAPL GEX – 320 Breakout, Momentum Toward 330?AAPL is testing acceptance above the major 320 call wall. At 321.44, price is only 0.45% above this level, so momentum and volume still need to confirm the breakout.
🔶 GEX Structure 🔶
Confluence at 320 — 09/18, 21 DTE cumulative:
C1 + Ab1 — primary call wall and largest absolute gamma
COI / AbOI — major open-interest concentration
CV + D+ — call-volume and positive delta concentration
Holding 320 would turn the former ceiling into support and keep AAPL in the positive extension zone.
NVDA GEX – Market Structure Map Before EarningsNVDA reports after today’s close, with the August 28 options market pricing an approximately ±14-point move through Friday. From spot near 210.15, that frames a rough 196–224 event range.
That range is not a directional forecast or a hard boundary. It does, however, align closely with the current GEX structure: the upper boundary crosses the 220–222.5 call cluster, while the lower boundary reaches through 200 toward 195.
🔶 Earnings / Positioning 🔶
NVDA is trading almost exactly at the 210 HVL,
GC GEX - Breakout Above 4690Gold futures are extending a strong daily rally, with price near 4731 after clearing the 4690 call wall. That strike was the largest call NETGEX on the map — resistance that has now flipped into the first support of the breakout.
The bid is not only technical. Last week the bond market set the cross-asset tone. The 10-year finished near 4.73% and the 30-year moved toward 5.27% , the highest area since 2007. After that selloff, the Treasury said it would at least double selected long-d
GOOGL GEX - Relative Strength at HVLWhile the broader tape is selling off today, GOOGL is showing clear relative strength — barely red, and sitting right on the 342.5 HVL.
Spot is 342.83, only a few ticks above the regime pivot. That is not a wide cushion. GOOGL is pinning the flip while the rest of the market is being offered.
🔶 Regime Context 🔶
Price is holding 342.5 HVL on a down tape. Remaining above HVL keeps GOOGL inside a positive GEX regime, but this is a test of the flip, not an established hold well above it. Between 3