GMT Ready to Explode? Breakout Setup Forming (12H)A key trendline has been decisively broken, signaling a potential shift in market structure. In addition to that, we are now seeing a bullish Change of Character (CH) on the chart, which further supports the idea that momentum is starting to favor the buyers.
At the moment, GMT is trading around an important flip zone a level that previously acted as resistance and is now attempting to act as support. If price manages to hold above this area, it increases the probability of continuation to the
GMTUSDT
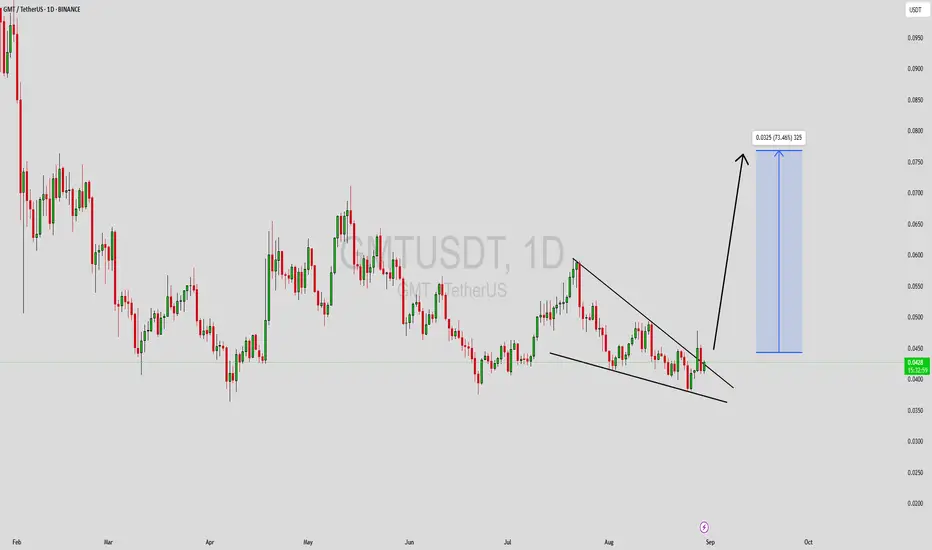
GMTUSDT Forming Bullish MomentumGMTUSDT is forming a clear bullish momentum pattern, a classic bullish wave signal that often indicates an upcoming breakout. The price has been consolidating within a narrowing range, suggesting that selling pressure is weakening while buyers are beginning to regain control. With consistent volume confirming accumulation at lower levels, the setup hints at a potential bullish breakout soon. The projected move could lead to an impressive gain of around 70% to 80% once the price breaks above the
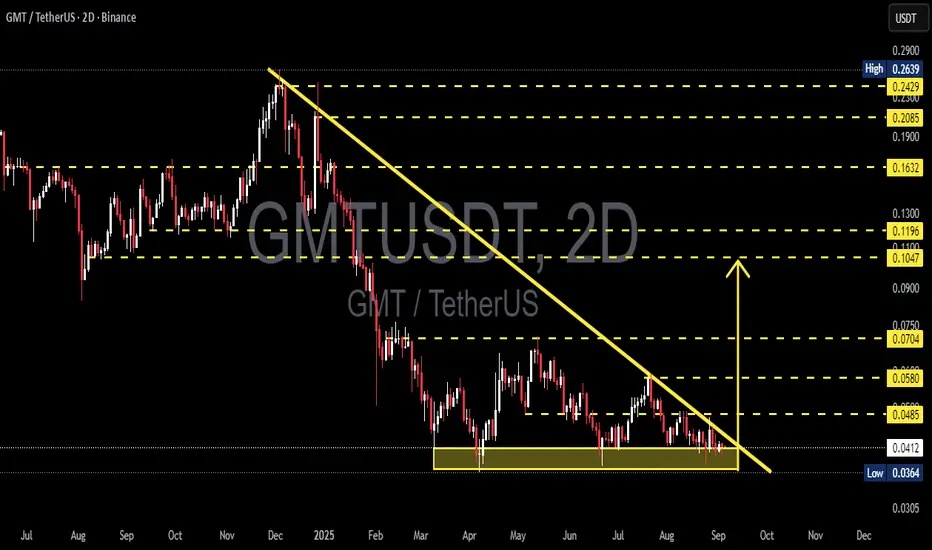
GMT/USDT — Massive Breakout or Another Rejection?The GMT/USDT chart on the 2D timeframe is currently showing a very interesting phase 👀 after spending months under medium-term bearish pressure 📉. Price is now approaching a major descending resistance trendline that has been holding the market down since mid-2025 🔻
If this resistance is successfully broken 💥, GMT could potentially start a much larger trend reversal 🚀. However, if the breakout fails ❌, bearish pressure may continue to dominate the market 🐻
━━━━━━━━━━━━━━━━━━
📊 GMT/USDT Chart
GMT: Real Move or Another Trap?💎Yello, are you about to get caught on the wrong side of GMT just before the real expansion phase begins?
💎#GMTUSDT has clearly completed a full Wyckoff accumulation range. The initial phase started with a strong selling climax, followed by an automatic rally and a secondary test, confirming that demand began to step in. This created the foundation for accumulation, where smart money quietly positioned itself while retail traders lost interest.
💎As the price developed further, we saw a clear s
GMTUSDT Forming Descending ChannelGMTUSDT is forming a clear descending channel pattern, a classic bullish reversal signal that often indicates an upcoming breakout. The price has been consolidating within a narrowing range, suggesting that selling pressure is weakening while buyers are beginning to regain control. With consistent volume confirming accumulation at lower levels, the setup hints at a potential bullish breakout soon. The projected move could lead to an impressive gain of around 70% to 80% once the price breaks abov
GMTUSDT UPDATE#GMT
UPDATE
GMT Technical Setup
Pattern: Falling Wedge Pattern
Current Price: 0.02143$
Target Price: 0.03060$
Target % Gain: 112.84%
Technical Analysis: GMT is breaking out of a falling wedge pattern on the 1D timeframe, signaling a bullish reversal after an extended downtrend. Price has pushed above the descending resistance trendline and is showing follow-through strength, suggesting buyers are gaining control. The projected upside target is derived from the height of the wedge, pointing
GMTUSDT UPDATEGMT
UPDATE
GMT Technical Setup
Pattern: Falling Wedge Pattern
Current Price: $0.0142
Target Price: $0.03000
Target % Gain: 111.27%
Technical Analysis: GMT is forming a falling wedge pattern on the 1D chart, indicating bullish potential if price can break and hold above the wedge’s resistance trendline. The current consolidation near support shows buyers defending levels, and an eventual breakout with volume could push price toward the $0.03000 target zone. The setup becomes more valid as
GMT - STEPN 1D - 1W TF Not sure about others, but personally I really like CCI indicator.
Looking at its historical performance especially on the weekly timeframe it has proven to be extremely precise in signaling key market reversals and momentum shifts.
Currently, we can see a triangle pattern forming on the chart.
If this triangle plays out as expected - targets are marked on the chart and I’d dare to assume those could represent the final highs before a major correction or potential “scam phase”
GMT/USDT — Descending Triangle: Breakout or Breakdown?📝 Market Overview:
Since the early 2025 peak, GMT has been in a clear downtrend, consistently forming lower highs along the descending trendline (yellow).
Price is now consolidating within a major support zone at 0.0364 – 0.0413, which has been tested multiple times.
The structure forms a Descending Triangle: flat support + lower highs. Statistically, this pattern carries a bearish continuation bias, but a reversal scenario is not ruled out if bulls manage to reclaim key levels.
---
🔎 Patte
GMTUSDT Forming Bullish WaveGMTUSDT is showing signs of strength as the price structure forms a bullish breakout setup. The chart indicates that after a prolonged period of consolidation, the pair is attempting to push higher, supported by good trading volume. This increase in buying activity highlights that market participants are positioning themselves ahead of a potential trend reversal. If momentum sustains, GMTUSDT could enter a new bullish wave in the coming sessions.
With an expected gain of 60% to 70%+, this setup
GMT/USDT Breakout Alert! Major Downtrend Broken🔻 End of a Long-Term Downtrend?
GMT has been in a strong downtrend since late 2024. A clearly defined descending trendline has acted as strong resistance—until now. The price has bounced from the major support zone between $0.0364 and $0.0425, which has held multiple times since March 2025.
🚀 Breakout Confirmation in Progress:
The chart shows a potential breakout from the descending trendline (yellow). A confirmed breakout with volume would indicate the start of a bullish reversal pattern.
🎯 K
GMT New Update (The bullish wave is continuing) 12HThis analysis is an update of the analysis you see in the "Related publications" section
The previous setup is canceled due to the risk of being left behind.
The wave structure has been reanalyzed. It appears that GMT is in a large corrective pattern, likely a diametric, and wave F has completed. Wave F was a symmetrical structure that has now ended.
As long as the POI zone holds, the price can move toward the targets. The targets are marked on the chart. This movement is considered wave G of
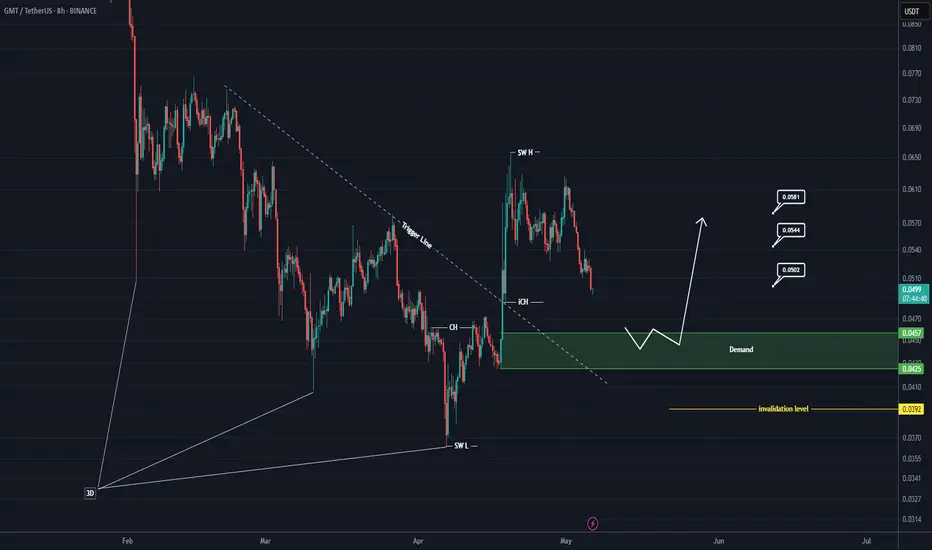
GMT Rebuy Setup (8H)Given the broken 3D pattern at the bottom and the trendline break, our demand zone is considered highly valuable. Therefore, we will look to enter a buy position within the green zone, which has been the origin of a strong move.
The price is currently in a support zone, but we will only enter a position if it reaches the green zone marked on the chart.
A daily candle closing below the invalidation level will invalidate this analysis.
For risk management, please don't forget stop loss and capi
GMT Daily Analysis | Bearish Continuation Toward Key Support👀 Welcome to my Trading View Analysis and Trading Channel Here , we share the latest market analysis, trading signals, and key insights together .
Ready for smarter trades ? ⭐️
🧠 Technical Analysis of GMT Coin – Daily Timeframe
This analysis reviews the recent price behavior of GMT coin on the daily chart. Based on the current market structure, there are multiple technical signals suggesting the continuation of the downtrend and a possible entry into a consolidation phase.
1. 🚀 Sharp Uptre
GMTUSDT – Trendline Breakout, and Potential for Continuation!GMT has finally shown signs of strength after a prolonged downtrend. The pair has broken out of its descending trendline, a key structure that had been capping price action for weeks. This breakout is more than just a technical event — it signals a potential shift in market sentiment 🧠.
One of the most important developments is the break above the previous lower high, which confirms a short-term bullish market structure. With this structure change, bulls have gained the upper hand — at least fo
GMTUSDT Analysis: Resistance and StrategyIn GMTUSDT, the red boxes represent key resistance zones . However, caution is essential as the price is currently in a strong bullish trend .
Key Highlights:
Red Boxes as Resistance: These zones are significant but require lower time frame confirmations for short entries.
Bullish Momentum: The price shows strength, aligning with my general long position target of 102k$ .
Hedge Strategy: I will consider these levels for hedge shorts while maintaining a broader long bias.
Co
GMTUSDT - Sorry but Still Not Looking GoodCheck out our latest GMTUSDT analysis which is on %80 profit right now.
GMTUSDT is currently facing some challenges, and it’s not looking particularly favorable in the short term. The red boxes are acting as significant resistance zones, where the price has struggled to break through in the past. As we know, these levels are likely to continue attracting selling pressure, so we need to be cautious here.
From a strategic standpoint, I’m still maintaining a bearish outlook until proven otherwi
GMT Buy/Long Setup (2H) RiskyFirst of all, be aware that this setup is not low-risk. However, the invalidation level is close to the entry zone, and if it gets hit, the setup will be stopped.
There are two liquidity pools on the chart, one above and one below. We anticipate that the upper liquidity pool will be collected first, and then the price will be rejected from the order block above this pool.
From a wave count perspective, we have completed wave A and are now in wave B, which is a diametric pattern. We are current
GMT looks like a rocket (1D)GMT, unlike other altcoins, is in a valuable range.
We have a symmetrical pattern with time-price similarities. Each bearish wave has dropped approximately 80%. Now, the last bearish wave of this symmetrical pattern has also dropped 80%.
The green zone is considered a valuable range for this coin.
The bullish legs of this pattern have usually exceeded 200%.
Since we are in the final bearish wave of this pattern, we should expect a post-pattern move.
This move will be sharper and faster than
#GMT (SPOT-INVEST) entry ( 0.0850- 0.0910) T.(0.9500) SL(0.0846)BINANCE:GMTUSDT
#GMT/ USDT
Entry ( 0.0850- 0.0910)
SL 3D close below 0.0846
T1 0.3500
T2 0.5400
T3 0.7900
T4 0.9500
3 Extra Targets(optional) in chart, if you like to continue in the trade with making stoploss very high.
______________________________________________________________
Golden Advices.
********************
* collect the coin slowly in the entry range.
* Please calculate your losses before the entry.
* Do not enter any trade you find it not suitable for you.
* No FOMO - No Rush
#GMT (SPOT) entry ( 0.1400- 0.1960) T.(0.9500) SL(0.1300)BINANCE:GMTUSDT
#GMT/ USDT
Entry ( 0.1400- 0.1960)
SL 1D close below 0.1300
T1 0.3500
T2 0.5400
T3 0.7900
T4 0.9500
3 Extra Targets(optional) in chart, if you like to continue in the trade with making stoploss very high.
______________________________________________________________
Golden Advices.
********************
* collect the coin slowly in the entry range.
* Please calculate your losses before the entry.
* Do not enter any trade you find it not suitable for you.
* No FOMO - No Rush