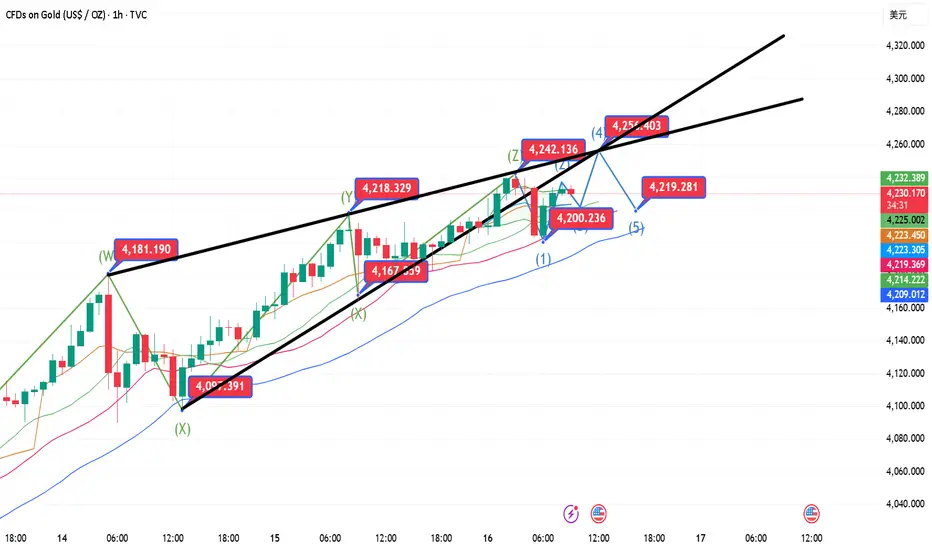
10.16 Gold Short-Term Operation Guide!!!Three key points to watch today:
1. Position. Today's target is the 4200 area (previously, it started at 4000, then 4090, and yesterday was 4140).
The 4200 mark is today's early trading low. Using this as a dividing line, we're looking to sweep the $40 range above and below. A breakout will open up further opportunities.
2. Channel. The lower band of the channel overlaps with yesterday's low at 4140, while the upper band currently overlaps at 4220-4225.
Today's Asian session saw continued gains, breaking through the small channel range and extending gains by approximately $20 to 4242. However, after the breakout, the price fell back to 4203, retesting the previous high. If the market falls back into the channel, the support and resistance levels will shift again to the 4220-4225 area.
If it successfully holds above the support level, look for the 4200 area. If it breaks below, look for the 4180 and 4165 areas, with the 4145-4140 area exceeding the range.
Similarly, if it breaks above 4240, and the profit margin is halved according to the principle of equal distance, the next resistance level will be the 4270-4290 area.
3. Although the current result is an upward trend, the process has been characterized by significant ups and downs, with each initial move ranging from approximately $60 to $80.
So, regardless of whether you are long or short, regardless of the direction, at this moment, timing is more important than direction. Once confirmed, To determine a trigger, the first consideration is at least $60-80. Within this range, stick to one direction. If it's right, reap the rewards; if it's wrong, exit. Regardless of whether you're long or short, don't dwell on it.
The current market trend is extremely chaotic. In this chaotic situation, perseverance is more important than choice.
In summary, for gold today, Thursday, focus on the 4200 mark as a spatial boundary. From this boundary, we can see a range of $40 above and below.
Two key resistance levels: the upper limit of the 4220-4225 channel and the equally spaced upper limit of the profit margin at 4240-4242.
Using these two levels as resistance, we can see downward pressure on the price, looking for the 4200 area.
If it falls below 4200, Two key support levels are moving downward:
First, 4180, a support point that was repeatedly consolidated in the US market last night. Second, 4165-4160, the bottom of yesterday's sharp drop in the European market.
Of course, if the price does fall to the second support level, it will be easy to find the lower limit of the small channel at 4140, which is also yesterday's low.
Based on this idea, the European market price met expectations. Under pressure from 4242, a decline to 4203 helped to profit from the short position. The rebound continued, but the price slightly exceeded the range.
If the price exceeds the range, then the second confirmed high of 4242-4245 area is still a short position, with a stop loss at 4253 and a target of 4220-4200. If it falls below, look for 4180 and 4165.
Goldtradingview
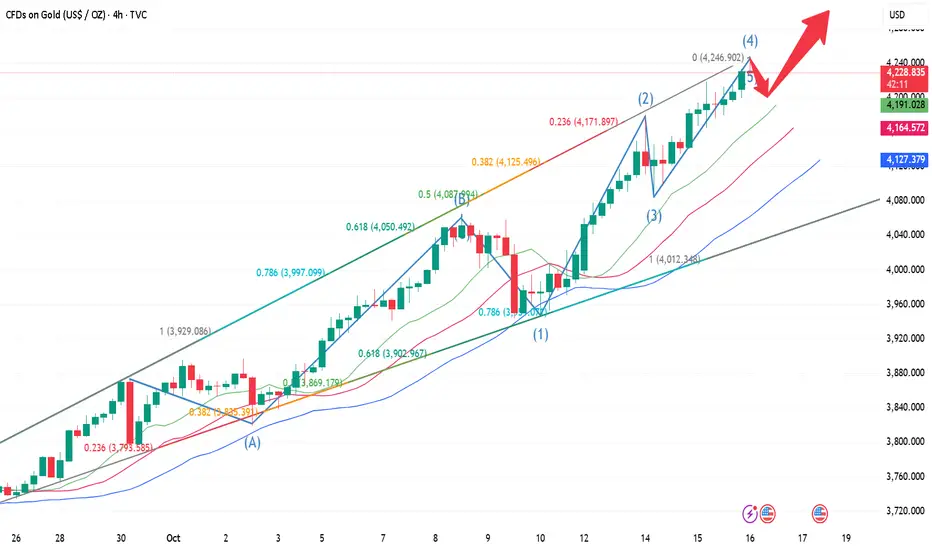
10.16 Gold maintains the upward trend in the Asian session!!!From a multi-period analysis perspective, first observe the monthly chart's rhythm. From a long-term perspective, 3130 represents a watershed in the long-term trend. Above this level, consider a long-term bullish approach. From a weekly perspective, the current bull-bear watershed is 3585. Above this level, consider a medium-term bullish approach. From a daily perspective, focus on the 3997 support area for now. Above this level, consider a short-term bullish approach. From a four-hour perspective, which we've consistently emphasized, support currently lies at 4175. Above this level, consider a short-term bullish approach. On an hourly basis, prices are also currently bullish, but short-term divergence is occurring. Therefore, be mindful of short-term bullish risks in the event of further upward movement. Meanwhile, today's early trading session saw another surge in gains, with the early morning low serving as a watershed for the day. Above this level, consider a short-term bullish approach. Focus on the 4235-4266 area as an upward move.
Gold's Asian session low of 4199.73 marks the intraday watershed. Above this level, bullish momentum is expected to continue. (Also, a divergence is occurring in the hourly chart, so be aware of the risks associated with a short-term rally.)
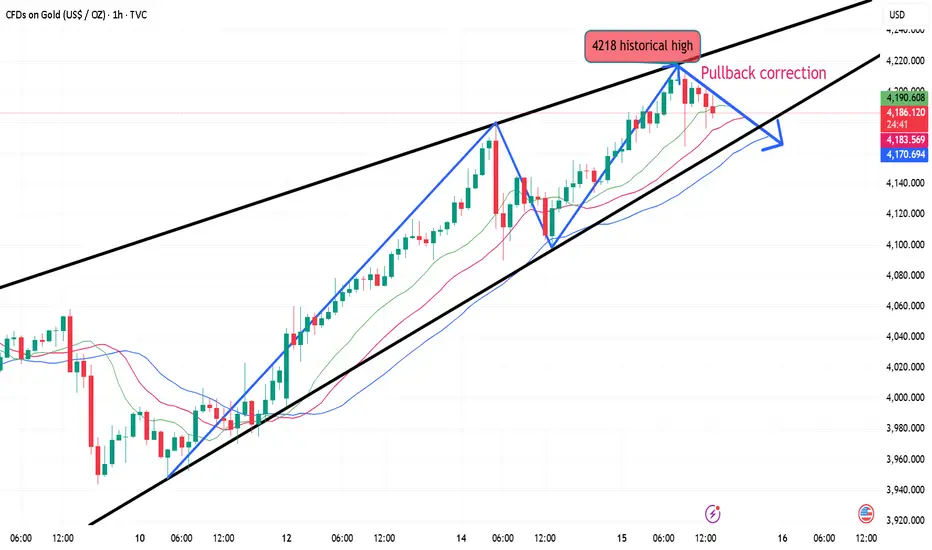
Profit Both Ways — Double the Trades, Double the Thrill !After gold hit above 4210, it showed obvious signs of stagflation. First, after gold touched around 4218, it retreated to around 4164; secondly, after gold touched around 4212 during the rebound, it retreated again to around 4179.While the two pullbacks were limited, they also indicate that after gold's strong rally, the market is beginning to diverge and diverge.
We can use the ABC rule to determine the position of D. Based on the chart composition, D is around 4160. That is to say, in the short term, gold has the need to retreat to around 4160 again, and this area is also a strong defense line for bulls. If this defense area is broken, gold may continue its downward trend and test the bull-bear dividing line of 4140-4130.
So after a clear rejection signal appears, I think we can continue to try to short gold in the 4205-4215 area. The retracement target area is first located in the 4180-4160 area; and once gold retreats to the 4160-4150 area, we can wait for an opportunity to rejoin the gold long trade!

10.15 Gold continues to rise, beware of a pullbackGold 4-hour chart level: Asian session directly pulled up strongly. The overnight closing itself was not at a relatively high level, and it was still 40 meters away from the previous high. After a short squeeze and strong pull, it did not stop until the European session reached the upper track of the yellow channel 4218 in the figure, and then there was a sharp drop, with the lowest point at 4165. The high point of this wave of suppression was predicted in place (4215 was prompted in advance to pay attention to the resistance pressure), but the low of 4165 was only touched for a few seconds, so only 4180-4190 can be chosen; Judging from the current trend, the US session tends to see a strong consolidation at a high level. The resistance is still the derivative of the upper track of the yellow channel, which will move up to 4220-25. The support is the middle track 4170, which is also the retracement point of the previous red channel line; after approaching both sides, we will look for pressure or support signals to try to make a shock;
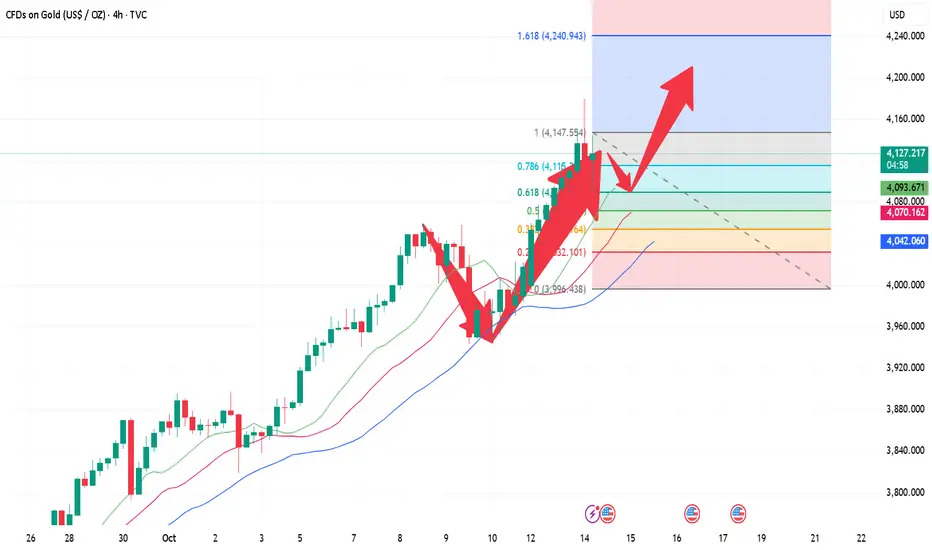
Explosive Battle Ahead — Can Gold Smash Through 4180 Again?Gold retreated $90 from 4180 to around 4090, then hit the 4100-4090 area twice before rebounding, and is currently consolidating around 4150. Although the short-term retracement of gold is not small, it is obvious that it has not destroyed the upward trend and pattern structure. However, it has exacerbated market differences to a certain extent and also increased short-term volatility. First, 4160 represents the 23.6% retracement level. Next, we must closely monitor two areas. First, 4160 represents the 23.6% retracement level of the recent short-term rally. If gold fails to break through this area during its subsequent rebound, it could form a technical M-shaped double top with the 4180 high in the short term, favoring a downward trend for gold and potentially leading to a further correction.
Second, we must pay close attention to the area around 4125, which represents the 61.8% retracement level of the recent short-term rally. If gold remains above 4125 during its subsequent pullback, it indicates that the bullish trend in gold has not ended and that it may continue to reach new highs.
Based on the above considerations, regarding short-term trading:
1. First, we can consider shorting gold in small quantities in the 4150-4160 area, and then patiently wait for gold to retrace.
2. Once gold retreats to the 4125-4115 area, we can try to go long again, and then patiently wait for gold to rebound further, or even retest the recent high near 4180.

10.14 Tariffs and interest rate cut expectations resonate!Judging from the current 4-hour chart:
4100 is essentially the current hurdle for gold.
It's also the most important support level today.
Gold opened today in the 4100-4110 range. Although it recently retreated to around 4090, the real-world price still closed above 4110.
If we analyze the trend from last week's low of 3950 to the current 4180 level, we can see that the 618 support level is precisely around 4090.
4090 also happens to be the low point of the recent retracement.
According to wave theory, if the retracement does not exceed 618, new highs are inevitable. If it breaks through 4180 again, the next target may be around 4230.
Gold breaks out to new all-time high!!!After breaking through the previous resistance band on the 4-hour chart, gold's candlestick chart continues to maintain a strong upward trend along the short-term moving average. There are still no signs of a peak in the short term, so focus on the support band around 4080. Currently, a purely technical correction in gold is unlikely to lead to a significant decline. The most likely scenario is a sudden sell-off or a rapid surge and then a decline to release bullish pressure, which may lead to some decent short-selling opportunities. On the hourly chart, the candlestick chart maintains a slight upward trend along the short-term moving average. Intraday pullbacks do not provide much room for improvement. Watch for short-term corrections in the closing market. Consider long positions around 3080-1.
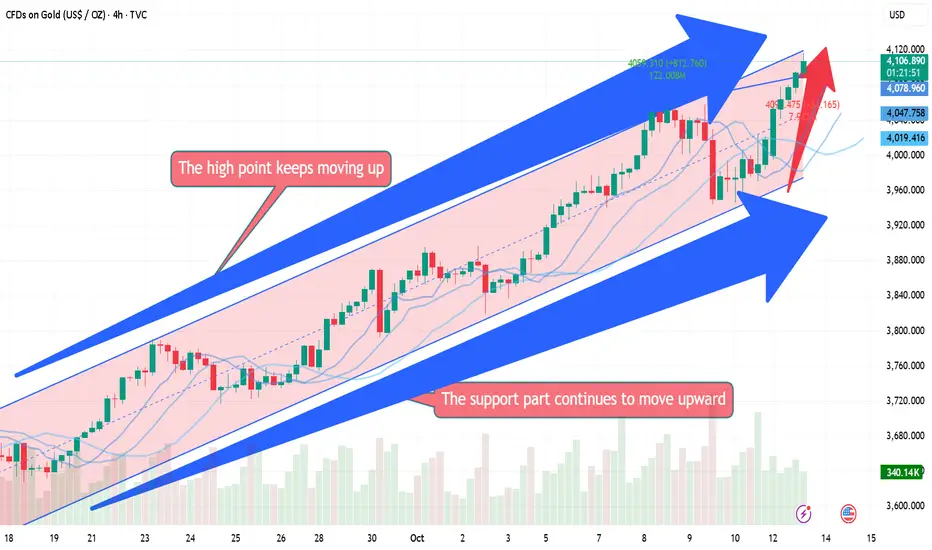
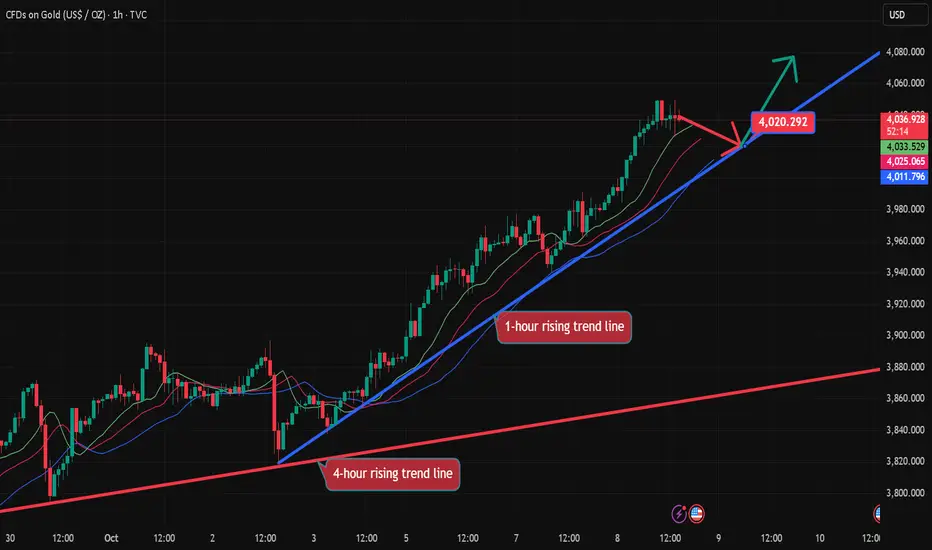
Monday's Gold Operation Analysis Guide!!!Gold has broken through its previous high, which is a standard continued upward trend and V-shaped reversal. The original horizontal pressure of 4060 has become a thing of the past. We can only focus on the expected decline opportunity of the trend line to buy!!!
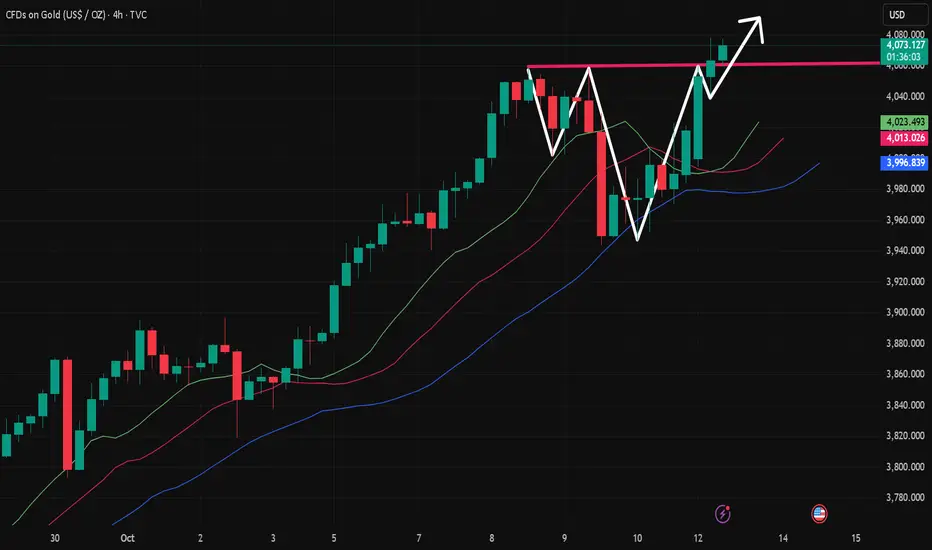
Gold will continue to rise at the end of the week!!!Gold is currently consolidating at a high level on the daily chart, nearly forming an engulfing pattern at a high level, making today's daily close crucial. On the 4-hour chart, prices are currently fluctuating at a low level, finding support around 3950. On the hourly chart, after continuous fluctuations, the technical pattern is gradually adjusting. The short-term moving average is gradually diverging upward, and the K-line chart is slowly crossing the short-term moving average. The short-term trend is gradually strengthening, suggesting further upside potential. Keep an eye on the resistance zone around 4010.
Trade Recommendation: Buy around 3975-6, with a stop-loss at 3966.
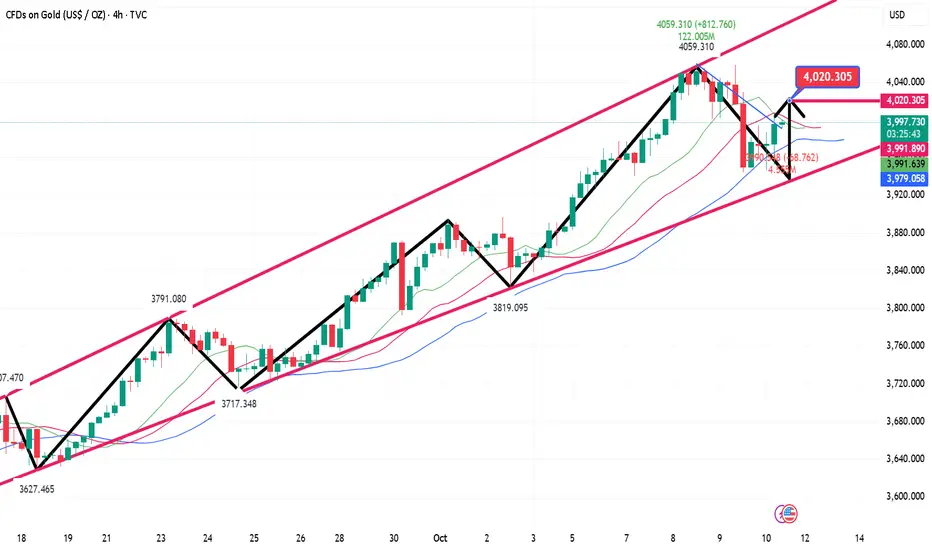
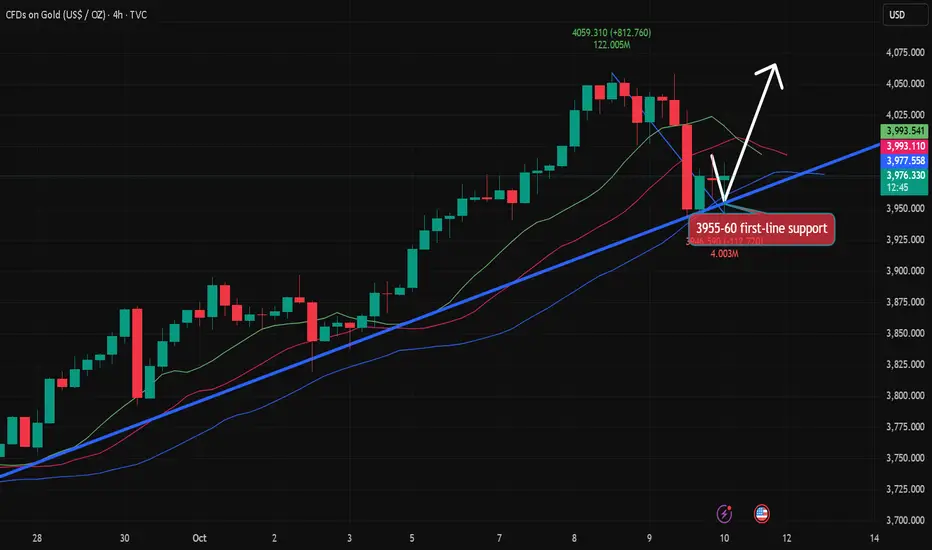
10.10 Gold pullback continues to be bullish!!!Looking at the 4-hour market trend, watch for the important support level at 3957-3960. The bulls are rising strongly and there's no end in sight. Trading strategies should prioritize buying on dips. In the middle, be cautious and watchful when buying.
Gold Trading Strategies:
1. Go long on gold at 3957-3960, with a stop loss at 3948 and a target of 4015-4020. Hold if it breaks through!
Gold rebound is still a good opportunity to short!Judging from the current trend, gold was affected by the easing of geopolitical situation, and the risk aversion sentiment temporarily receded. After falling below the 4000 mark, it quickly extended to around 3944. The daily line closed with a medium-sized negative line, almost completely engulfing the previous day's gains. The short-term indicators formed a death cross at a high level, and the momentum weakened significantly. The focus of the day is on the gains and losses of the 4000 mark, which is also the key position for the recent top and bottom conversion. In the 4-hour cycle, the price rose and fell again and closed lower. The big negative line broke through the middle track support. The previous strong unilateral bullish pattern was broken and the market entered a pullback correction stage. Therefore, it is expected that there will be room for repeated adjustments today. The upper pressure focuses on the 3980-3995 area, and the lower short-term support focuses on the 3945-3940 area. If it stabilizes and does not break, you can consider trying to go long on gold with a light position. If it breaks further, pay attention to the bullish defense zone in the 3930-3920 area, and then consider going long on gold. In terms of overall operations, maintain the idea of main short and auxiliary long, wait for the key point confirmation signal, enter the market steadily, strictly control the risk, and execution is still the key to profitability.

Accurate sniping, gold is shorted all the way.Who else has continuously arranged short orders from above 4050 and gone down all the way. Before the market closed yesterday, we arranged in advance at 3990 and accurately set a limit short order. During the opening rebound, gold only touched 3994. After perfectly activating the limit short order, it quickly fell and hit the target near 3970 in one fell swoop, with a steady profit of 200pips on a single transaction. This wave of operations is not only a manifestation of technology, but also a perfect combination of rhythm and plan execution. It once again verifies our core concept of planned trading and strict risk control, precise analysis, advance layout, and steady cashing. Looking back at the entire market, since above 4050, we have clearly stated that there is a risk of periodic correction in gold, and have repeatedly suggested the idea of shorting on the rebound. Facts have proved that planning in advance and decisive execution are better than chasing ups and downs afterwards. The rhythm of this round of decline is clear, and the short-selling-dominated pattern is obvious. We decisively enter the market in the key interval. Every high-level short order is fast, accurate, and ruthless, and we win in a steady manner.
From a technical perspective, gold completed a structural breakdown at the 4000 mark. Short-term support is focused on the 3945-3940 area. If it continues to break down, it will open up downward space to the 3920 line. The upper pressure is focused on the 4000-4015 area. Rebound pressure is still the focus of shorting at rallies. The overall rhythm is still bearish, and short-term operations are mainly based on rebound shorting.
The market never waits for anyone. Profits belong to traders who have plans and execution capabilities. Congratulations to all my friends who are paying attention. Once again, I have steadily realized profits. Strength is not something that can be expressed with words, but is the result of precise implementation of each order. Next, I will continue to track the gold fluctuation structure and lead everyone to steadily grasp the next key market opportunity.

Gold short positions above 4050 have achieved another success!Today we have been emphasizing that gold may usher in a major adjustment. In the end, gold fell below the 4,000 mark. This position is exactly the important medium-term bullish and bearish turning point that we have been adhering to for a long time. Gold broke through and fell directly during the U.S. trading session. We participated in short orders throughout the process. Gold fell sharply as expected. At present, gold has fallen below the key mark. It is likely to be mainly adjusted in the short term. There is a lack of new positive news stimulation in the near future. The market may enter the bearish home court next. The gold 1-hour moving average has turned, indicating that the bullish momentum has weakened significantly and the rebound strength is limited. The trading ideas in the future are still clear. The rebound is under pressure in the 3985-4000 area, which are opportunities to short at highs. We never do stubborn longs or shorts. Once the long and short key positions are broken, the trend has turned. Only by following the trend can we be invincible.

The golden rhythm is in your hands!Today's gold trend once again perfectly verifies our strategic predictions. The market has entered the stage of falling under high pressure as expected. We have been shorting from above 4050 to the bottom. The rhythm is clear and the execution is in place. It can be said to be another god-level operation, with stability and precision coexisting. The value of planned trading is once again reflected. It is not a blind prediction, but a steady progress based on structure, rhythm and logic. Congratulations to my friends who are paying attention.
From the current gold trend analysis, although it rebounded to above 4050 during the US trading phase, it can be clearly seen from the 4-hour chart structure that the gold price entity still closed below 4045. This is also the main reason why I asked my brothers to arrange short positions in advance. 4045 is still an important suppression position at the stage, and the 4000 mark below is still a key support position. Once this mark is held, gold will most likely remain in the 4050-4000 range of shock and consolidation. On the contrary, if it falls below 4000 again, the downward space is expected to extend to around 3985-3980. On the contrary, if the market stabilizes without breaking 4000 and successfully breaks through and stands firmly above 4050, the emergence of a new high is only a matter of time. Therefore, the current core observation range is within the 4000-4050 area. Before the breakthrough, it is recommended to maintain the strategy of selling high and buying low. Once the price effectively breaks through the boundary of either side, following the trend is the best strategic direction.

10.9 Gold US Market Operation Guide!!!Looking at the 4-hour market trend, watch for the important support level of 3990-4000 below, and the bull-bear watershed of 3980-85. The bull market is rising strongly and there is no end in sight. Trading strategies should focus on buying on pullbacks. In the middle, be cautious about following orders.
Gold Trading Strategies:
1. Buy gold at 4000-4010, and add to long positions if it retraces to 3985-3993. Set a stop loss at 3977 and target 4045-4050.
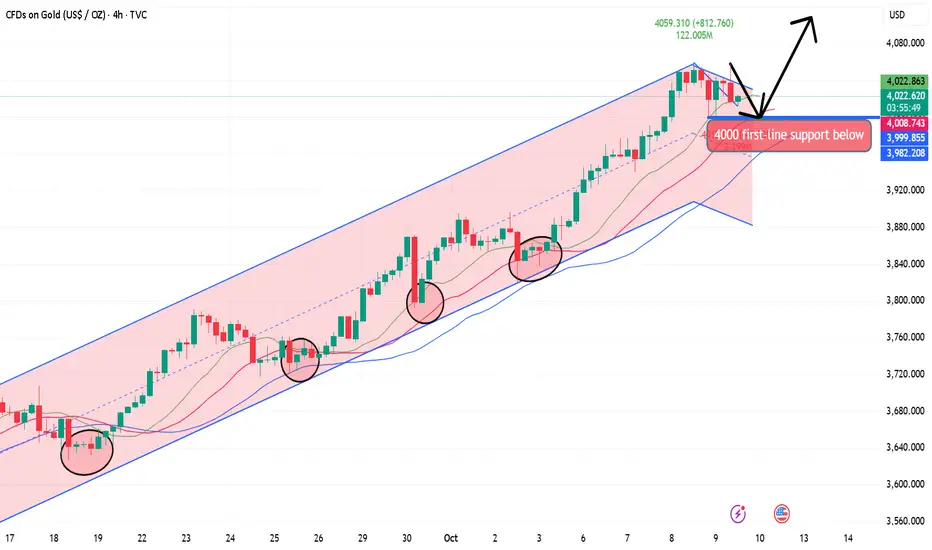
Gold accurately grasps the rhythm!Yesterday, a historic breakthrough took place, with gold prices exceeding $4,000 per ounce for the first time and surging to around $4,060 at one point, while also driving silver prices to a record closing high. This strong rally was mainly driven by market risk-averse buying triggered by escalating geopolitical tensions. However, the market took a significant turn on Thursday, with Hamas and Israel suddenly reaching a ceasefire agreement in the Middle East, and market risk aversion quickly cooled, causing gold prices to fall from their highs. This dramatic "roller coaster" market clearly shows that the core logic currently dominating the gold market is still the change in geopolitical risk preferences, and its volatility has therefore been sharply amplified, sounding the alarm for the market.
From a technical perspective, after hitting a high near $4,060, gold prices retreated to key support near $4,000 in late New York trading, perfectly exemplifying the "buy bulls, don't chase the gains; reposition upon a pullback to key support" trading strategy. Currently, the $4,000 mark has become a key dividing line between bulls and bears in the near term. From an operational perspective, we recommend maintaining a medium- to long-term bullish approach, but emphasize entry timing and risk management. Specifically, we should consider the $4,000 level as a key defensive level, patiently awaiting dips and long opportunities after a pullback and stabilization. The initial upside target is the previous high near $4,060. If gold can successfully break through and hold this resistance area, it will open up further upside potential, potentially challenging $4,100 or even higher. Conversely, if repeated attempts to reach $4,060 fail, short-term bulls should appropriately take profits and exit positions, wary of the risk of price consolidation at high levels or a deeper technical correction.

Gold Awaits Powell's Speech: Sell $4052 or Buy $3977?Hello TradingView community!
The Gold market is entering a pivotal phase. After an impressive rally, prices are pausing at a critical resistance zone, and the market sentiment is holding its breath for tonight's main event: the speech by Federal Reserve Chairman Jerome Powell.
This is a moment where a few words can determine the direction of an entire trend. Let's outline a detailed action plan.
1. Macro Context: Jerome Powell in Focus
"Aftershocks" from the FOMC Minutes: The market is still "digesting" the FOMC meeting minutes released yesterday. The minutes revealed a somewhat more "hawkish" tone than expected, as many members remain concerned about inflation. This is putting slight pressure on Gold prices.
Main Event: Fed Chair Powell Speaks.
This is when all eyes are on him. Traders will scrutinize every word of Powell's for clues about the future interest rate path.
If Powell maintains a hawkish tone, emphasizing that the fight against inflation is not over, the USD will strengthen, and Gold may undergo a deep correction.
Conversely, if he makes "dovish" remarks, expressing concerns about economic growth, it will be a "green light" for Gold to break out.
2. Technical Analysis: Action Plan
Our chart clearly outlines the key "battle lines":
Main Resistance Zone (Bearish OB - Zone):
This is the "stronghold" of the Bears, where profit-taking and short-selling pressures are concentrated. With a somewhat hawkish macro backdrop, this is a very strong resistance zone. The scenario forecasted on the chart shows prices may rebound to this area and be rejected. This is a critical area to watch for sell signals.
Primary Buy Zone (Bullish OB - Buy Zone):
This is the safest and most ideal "stronghold" for the Bulls. It is the order block that created the previous strong upward wave. A perfect scenario is Powell's speech driving prices to adjust to this zone, creating a good buying opportunity to follow the main trend.
Breakout Target (Liquidity):
If Powell unexpectedly turns "dovish," Gold could break through the $4,052 resistance zone and head straight for the liquidity target at the previous peak.
Trading Strategy
Before the speech (19:30): The market may be unpredictable. It's best to stay on the sidelines to avoid price "sweeps."
Preferred strategy: Based on the adjustment scenario drawn on the chart, patiently waiting for a buying opportunity at a strong support zone will be safer.
Specific plan:
Sellers (Risky): Look for clear reversal signals at the $4,052 zone during or after the speech.
Buyers (Safe): Wait for a price push down to the $3,977 zone and look for confirmation signals to buy.
WHAT'S YOUR PLAN?
Do you predict Chairman Powell will be "hawkish" or "dovish" tonight? And is your plan to Sell $4,052 or wait to Buy $3,977?
👇 Share your thoughts in the comments and don't forget to Like 👍 and Follow the channel!

Volatility = Opportunity—Short Gold Now!Although gold is still maintaining a bullish trend, it has repeatedly fallen back to around 4030 after approaching or touching the 4050-4060 area many times, and has shown multiple high points with upper shadows in the candlestick chart. It can be clearly seen that after accelerating its rise, gold showed obvious signs of stagflation near the trend line resistance area of 4050-4060, and there were obvious signs of retracement after touching this resistance area.
In addition, from the short-term structure, we can see that the current high is near 4059, and the left high is near 4050. If gold cannot effectively hold above 4050 during the next rebound, there will be signs of forming a head and shoulders top in the short term. Combined with technical divergence and overbought conditions, gold may usher in a good retracement in the short term. Combined with technical divergence and overbought conditions, gold could experience a significant pullback in the near term. We should first focus on the support below at 4030-4020, followed by 4000-3990.
So in short-term trading, I still will not give up short trading to gain short-term retracement profits. Therefore, I still advocate considering shorting gold in the 4045-4055 area. As long as gold can effectively fall below 4030, it will inevitably continue its downward trend to the 4010-4000 area.

How to correctly grasp the gold trading opportunitiesGold is still maintaining a bullish rhythm, the daily structure is stable, and the bullish trend has not been destroyed. Although it is slightly tired after the continuous rise, there is no obvious peaking signal yet. The hourly chart is still an oscillating upward structure. There is buying every time it falls back, indicating that the bullish force in the market is still dominant. From the four-hour cycle, the moving average system maintains a bullish arrangement, and the price runs above the moving average of each cycle. Although the RSI has entered the overbought range and there is a need for a short-term correction, the overall trend is still strong. The upper 4050-4060 area is the key pressure zone. If it can effectively break through and stand firm, the upper space will be further opened. We recommend that you continue to prioritize buying on pullbacks. Short-term support is in the 4020-4010 area, with stronger defense near the 4000 mark. As long as it stabilizes, there is still an opportunity for bulls. However, we should also be aware that after the continuous rise in gold, there is a possibility of a short-term correction. Aggressive investors can continue to consider shorting with a light position near 4060, with the initial target of 4030-4020-4010. Be sure to control risks, and shorting is only a supplementary strategy. Next, focus on US fiscal dynamics and Federal Reserve policy signals. These news factors will directly affect the short-term fluctuation rhythm of gold. Conservative investors should wait for support confirmation before entering the market, while aggressive investors should gamble with a light position and respond flexibly.

The US market fluctuates at a high level, and long orders fall bGold prices continued to fluctuate at high levels in the early stages of the U.S. trading session on Wednesday (October 8), with the potential for further gains. At the same time, the current price increase has already reached a large extent. Pursuing long positions at the current price is not the best opportunity. Waiting for a pullback to trade long positions at support points, with small stop-loss orders and a large expected profit range, spot gold broke through the $4,000 mark during the day, reaching a record high of $4,049.43 before retreating slightly. The current rise in gold prices is driven by strong safe-haven demand, driven by factors including the U.S. government shutdown, falling Treasury yields, and political turmoil in Europe and Japan.
Gold’s Swings Offer Bears a Profitable EdgeGold has currently reached a high of around 4050, but after reaching this area, the upward trend has been suppressed, and the upward momentum has weakened. Gold needs to retreat in the short term. Gold is currently under pressure in the 4050-4060 area. If gold shows obvious signs of stagflation in this area, then gold may usher in a good pullback at any time.
However, because gold is currently in a strong upward trend, its structure and form are in an obvious bullish trend. Therefore, even if the gold market pulls back, the pullback is not expected to be too large in the short term. We should first focus on the support area below, 4000-3990.
Therefore, in volatile markets, even if gold is in a strong bullish trend, gold shorts still have good profit opportunities due to volatility. So in the short term, we can consider trying to short gold in the 4050-4060 area, first aiming at the target area: 4010-4000 area.
If you're short gold like me, we must be among the first to reap the benefits of a market correction. If you'd like to continue following my trading strategies and signals, be sure to follow me!

10.7 The bullish trend of gold remains unchanged! Follow the treCurrent Market:
1: Technical Analysis - The bullish trend remains unchanged, so follow the trend. Trading Methods - Follow sideways trading and pullbacks! Avoid headwinds and avoid heavily shorting! Focus on following the trend!
2: Fundamentals - The probability of an October Fed rate cut continues to increase! The Russo-Ukrainian war remains stalemated! The outlook for the Middle East remains uncertain! Global central banks continue to increase their gold holdings! The overall fundamental environment is bullish for gold.
To sum up: From both a technical and fundamental perspective, gold is primarily bullish!
US Trading Timeframe:
1: 1-hour trading, sideways resistance at high levels, with support near 3940; the Stochastic and MACD lines are temporarily blunting!
2: 4-hour trading, the Stochastic has formed a death cross, and the MACD lines are blunting! From a morphological perspective, the short-term top-bottom reversal support level is around 3940.
3: In the daily K-line, the stochastic indicator blunted and retraced to a golden cross, signaling a bullish trend. The MACD double lines continued to cross upward, indicating a bullish trend.

Pullback Alert: Gold Feeling the Heat at 4000As expected, gold continued to rise to the 3985-3995 area, reaching a high of around 3991, just a hair away from 4000. According to my calculations, the current resistance area of gold is located in the 3985-3995 area (for the specific calculation process, please refer to the previous trading idea). Therefore, I believe that within this range, we can begin to test the top and short gold.
Moreover, from the short-term performance, although gold still maintains a bullish trend, the short-term rise has been suppressed and the recent rise has weakened. Moreover, after the continuous rise in gold prices, the risk of chasing the rise has increased significantly. We must be cautious about the current rise and guard against signs of profit-taking at market highs. Moreover, gold has repeatedly reached highs in the 3980-3990 area. Repeatedly reaching highs in a limited area is likely to mean that gold will usher in a wave of irreversible pullbacks in the short term.
In addition, we need to focus on the area near 3960. If gold can still stay above 3960 during repeated pullbacks, then gold will still maintain its current strong position, or at least maintain high-level fluctuations; if gold falls below the area near 3960 during the pullback, then gold may continue the pullback trend and is expected to continue to 3930, or even around 3900.
So for the current short-term trading, I think the time is ripe to short gold, and I have already shorted gold according to the above trading plan. Now I just need to wait patiently for gold to pull back and make a substantial profit!
