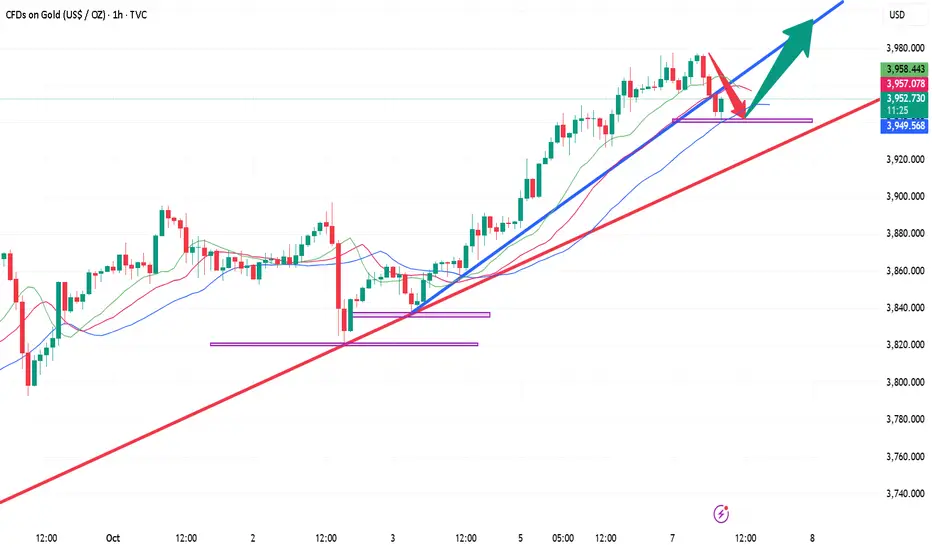
10.7 Gold Intraday Short-Term Operation Guide!!!Gold typically enters a correction phase on Tuesday after a strong rally on Monday. Maintain a bullish outlook for the day, with the primary support area being the 3955-60 range (which encompasses the early morning low, opening price, and high trading volume). Bulls are expected to mount a counterattack here. Today's market will not simply replicate Monday's unilateral surge, but will likely exhibit a pattern of "high-level fluctuations, false breakouts, and subsequent declines, followed by a test of the bottom and subsequent upward movement." Trading strategies should be abandoned in favor of buying at the bottom of the market fluctuations.
Goldtradingview
Ride Both Sides:Short Now, Long Later!Gold continues to rise and hit new highs, and the current high has reached around 3977. There is no doubt that the current gold market maintains a strong bullish trend. From the perspective of market sentiment, the only high point worth paying attention to in the short term is the 4,000 mark. There are currently no other high points that can be used as an effective reference. However, given the extreme highs, caution is advised regarding the current rally, and be wary of signs of profit-taking at market highs.
Two key support areas of note are currently located between 3930 and 3920, and between 3905 and 3895.If gold cannot effectively fall below these two key support areas, gold will continue to maintain a strong bullish trend and may hit 4000 in a short period of time; once gold falls below the above two key support areas during the retracement process, gold may continue to repair the retracement trend to the 3880-3860 area.
Therefore, in terms of short-term trading, because gold will fall back every time it hits a new high, remember not to go long on gold directly at a high level. You should grasp the rhythm of gold fluctuations. You can consider shorting gold in the 3965-3975 area, and then wait for gold to retreat to the area around 3930-3920 before considering going long on gold appropriately.

XAUUSD | Sustainable Price Rise: Where’s the Next Optimal Entry?Hello TradingView community! 🚀
Gold (XAU/USD) is in an extremely sustainable upward structure. Instead of lengthy analysis, let's dive straight into the action plan: Where is the optimal entry point and what target is Gold aiming for? Check out the details below.
1. Market Structure Analysis: The Strength of the Bulls 🐂
Looking at the chart, the first thing that catches our eye is a series of "BoS" points (Break of Structure).
Every time Gold breaks a previous peak, it not only creates a Higher High but also confirms that the uptrend is very strong and sustainable. This indicates that buying power is completely dominant and shows no signs of weakening. Smart Money is continuously pushing the price higher, and our job is to ride this "wave."
2. Potential Buying Zones - Where to Catch the Wave? 🧐
To optimize profits and minimize risks, finding a beautiful entry point after a price correction is crucial. Based on the chart, we have 2 notable potential buying zones:
Buying Zone 1 - Fibonacci Confluence ($3885): This is an extremely ideal "Buy Zone," coinciding with the golden Fibonacci ratio of 0.618. In technical analysis, this is a very strong support level where prices tend to reverse and continue the main trend. Professional traders always hunt for pullbacks to this zone.
Buying Zone 2 - Exploiting FVG ($3914 - $3933): Slightly higher, we have the FVG (Fair Value Gap) area at $3914 and the "Buy Scalping" zone at $3933. These are "price gaps" created by supply-demand imbalances when prices rise too quickly. The market tends to return to fill these gaps before continuing its journey. This could be an opportunity for those wanting to catch an earlier wave.
3. Conquest Target - What's Gold's Next Destination? 🎯
Once we have a buying position, where will our target be?
Short-term target: The "Sell Scalping FVG" zone around $3969 could be a minor resistance point where some traders will take profits.
Main target: The ultimate destination this structure is aiming for is the "Sell Gold Liquidity" zone at $3998. This is a critical "liquidity" area, concentrating many stop-loss orders from the Sellers. Prices are often attracted to these zones like a "magnet" to sweep liquidity before making further moves.
Summary & Advice
Main trend: UP.
Primary strategy: Buy on dip when prices correct to key support zones.
Potential buying zones: $3885 (Fibonacci) and $3914 - $3933 (FVG).
Price targets: $3969 (short-term) and $3998 (main target).
Always remember, risk management is the key to surviving in the market. Set reasonable Stop-loss for every trade.
WHAT DO YOU THINK ABOUT THIS PLAN?
Will Gold retrace to the Fibonacci zone $3885 or react right at the FVG zone $3914? Leave your thoughts and perspectives in the comments below. Let's discuss together to find the best opportunities!
👇 Don't forget to Like 👍 and Follow my TradingView channel to not miss daily Gold analysis!

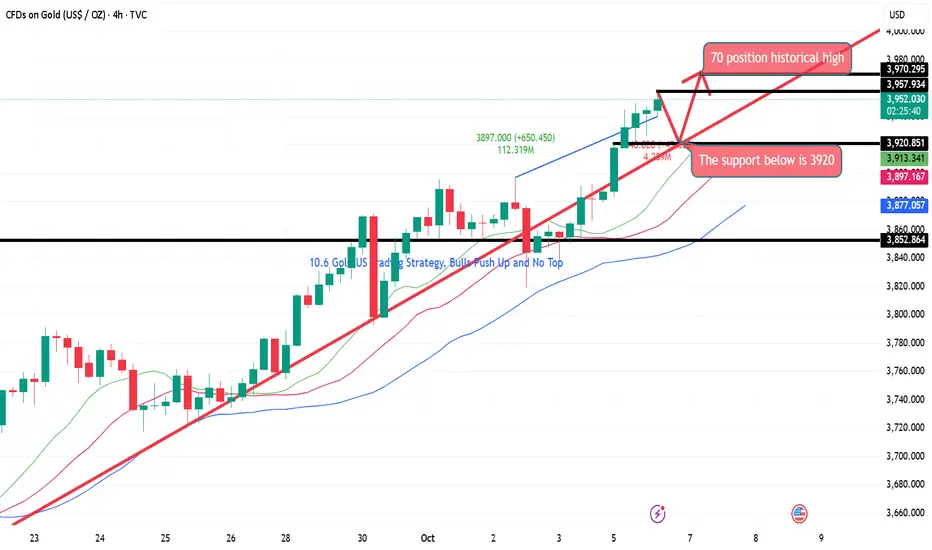
10.6 Gold US Trading Strategy, Bulls Push Up and No TopLooking at the 4-hour market trend, we are watching for short-term support at 3920, with a focus on the 3895-3900 support level. The bulls are rising strongly and there is no end in sight. Trading strategies should focus on buying on pullbacks. For intermediate positions, we should be cautious in chasing orders and patiently wait for key entry points. I will provide detailed trading strategies during the trading session, so please pay attention.
10.6 Gold falls back and continues to go longGold prices are currently moving out of a narrow range of highs on the daily chart. The K-line chart continues to maintain a relatively stable upward trend along the short-term moving average. Watch for any pullbacks on the daily chart to confirm a secondary upward trend. Focus on the support zone around 3900 in the short term. On the 4-hour chart, the price broke through the previous resistance zone, and the short-term moving average began to diverge upward, indicating a relatively strong short-term trend. On the hourly chart, the intraday pullbacks were neither strong nor prolonged, and the K-line chart continues to maintain a relatively strong trend along the short-term moving average. Some divergence is showing on the short-term chart, so watch for short-term adjustments.
Trading Strategy:
BUY: 3910 TP1:3925 TP2:3940
SELL: 3940 TP1:3910 TP2:3900
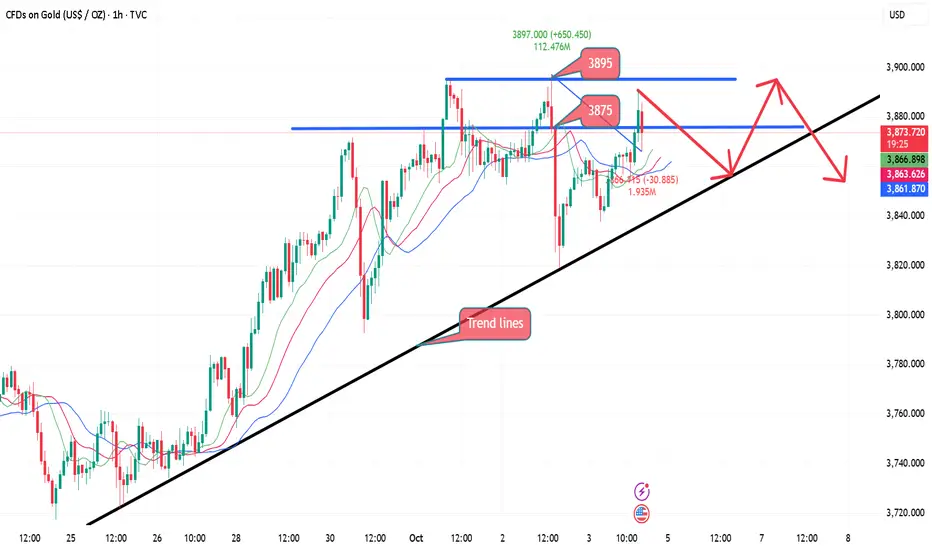
10.3 Gold US Market Technical Analysis!!!Our overall judgment on gold in October is "bumpy", that is, the market has turned from the steady slow bull market in September to a fluctuating rise. There will be a tug-of-war between long and short positions, and there will be a tug-of-war between highs and lows and a rapid rebound. However, this does not mean the end of the bull market, but only a change in the rising rhythm. We should pay attention to this pattern change in the short term. We will still view it as a strong rhythm during the day. After the volatile upward trend in the Asian and European sessions, we will choose to follow up with a bullish trend after a pullback. Pay attention to the suppression around 3874 and 3895 on the upside. At the same time, due to the uncertainty of the non-farm payroll results, whether it is announced or not will have a greater impact on today's operations.
9.3 Gold awaits non-farm payrolls!!!Gold's daily candlestick chart continues to fluctuate slightly higher along its short-term moving average, with prices currently under pressure around 3900. Tonight's non-farm payroll data may not be released as expected, adding some uncertainty to the market. On an hourly chart, after a period of narrow range-bound trading, the technical pattern is gradually recovering. With prices slowly breaking through the previous resistance zone, there may be some short-term rebound potential. On a four-hour chart, the short-term moving averages are essentially flat, suggesting continued high-level fluctuations and repairs. Watch for short-term corrections.

9.2 Gold Short-Term Technical Analysis Guide!!!Gold prices naturally retreated after hitting a new high on Wednesday, but the candlestick chart remains oscillating upward (with higher lows). If prices fall below the midline of the trend channel at 3869, the market is likely to shift towards the 3850-35 range. Currently, gold prices are showing this trend. Conservative investors can consider entering the market based on whether the 3834/35 support levels are broken (a rebound could reach as high as 50; if it falls below, the market is bearish and could reach 3810).
Reference support levels: 3849, 3834, and 3794.
Reference resistance levels: 3880, 3903, and 3917.
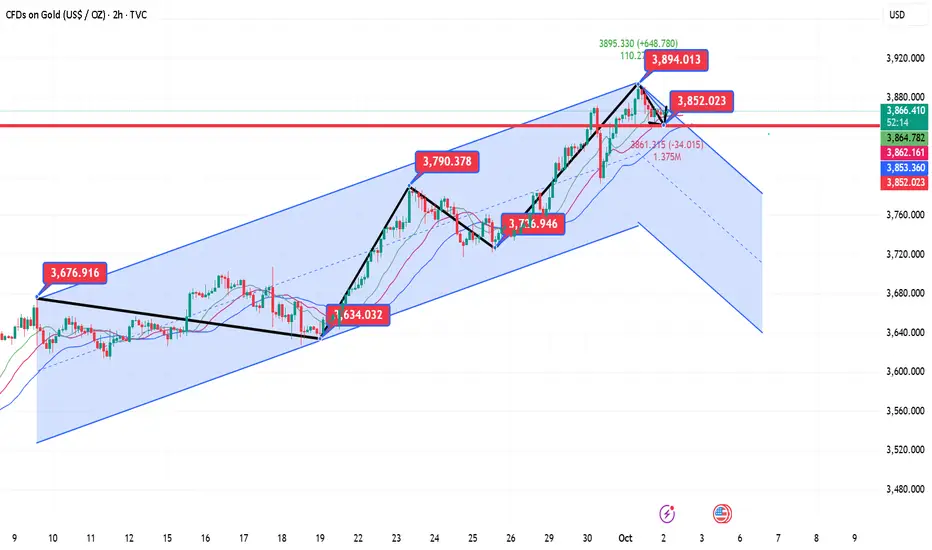
Bearish Momentum Builds: Gold Aims for 3850–3840Gold touched around 3895 during its rise and then began to retreat, reaching a low of around 3856. Currently, gold is fluctuating in a narrow range around 3870. According to the current trend, gold will not continue to maintain its strong position in the short term, and because of the US government shutdown, there may be no economic data in the short term. Out of caution, the market may also press the pause button on gold to ease the upward trend!
From a technical perspective, gold fell from around 3872 to around 3793 yesterday, with a retracement of as much as $79; while today gold only fell from 3895 to around 3856, with a retracement of only $39. Judging from the adjustment space and testing cycle, the gold correction is not sufficient and there is still demand to continue to fall, at least to the 3850-3840 area.
As gold retreats, it may be difficult for the bullish momentum to regain its strength in the short term. Under the counterattack and pull of the bears, the high-level volatility trend may be exacerbated. In the short term, gold is under pressure in the 3870-3880 area. If it is difficult for gold to break through this area in the short term, gold may continue to fall to the 3850-3840 area through this resistance area. Once it falls below this area, gold may continue to fall to the 3820-3810 area.
So in terms of trading, I still think we can continue to try to short gold in the 3870-3880 area, first looking at the retracement target area: 3860-3850.

How to accurately grasp gold trading opportunities?The market keeps falling, but we have no worries about taking profits. 3720 is the key short-term support level. Once it is effectively broken, gold is expected to accelerate its downward trend. For two consecutive days, we publicly suggested to arrange short orders near 3780 and 3760. Now the market has fallen sharply to the 3725 line, and we have achieved steady profits again. For two consecutive days, we accurately arranged short orders at the intraday high and steadily realized profits.
At present, gold is no longer in a unilateral upward trend, and the technical side has entered a repair stage. The operation idea is mainly to follow the trend, and the focus is on grasping the rhythm of bulls and bears. The most frequently asked questions recently are whether a big drop has begun and whether gold has peaked. From a structural point of view, although the daily line has been under pressure continuously, it closed in the negative yesterday and even formed a tombstone K-line pattern on the previous trading day, indicating that the short-term has encountered obvious suppression, but this cannot directly determine that the major trend has peaked. The weekly line is still dominated by bulls, and the short-term repair market has not destroyed the overall upward trend.
In terms of operation strategy, we still insist on shorting on rebound and long on pullback as a supplement. The lower support of the 4-hour chart focuses on the 3715-3700 area, and the upper pressure focuses on the 3760-3770 range. It is not advisable to blindly chase orders at the middle oscillation position. It is recommended to watch more and do less, and wait patiently for the key points to be confirmed before entering the market to seize the high winning rate opportunities.

Correction Not Enough,The Real Drop Is Yet to ComeGold began to retreat from 3778 yesterday, breaking through the key support levels of 3755, 3740 and even 3730, and hitting a low of around 3717, a drop of $60. In view of the recent continuous upward trend and the fact that it is near the 3800 mark, this is undoubtedly another heavy blow to the bulls.
From the perspective of morphological structure, gold may form a new downward trend channel with the help of high points near 3790 and 3778. If gold cannot successfully break through the 3755-3765 area during the rebound, it means that the gold downward trend channel may be successfully constructed, which will further stimulate gold to continue to decline.
As for the rising channel, gold is currently facing resistance in the 3760-3770 area. Before breaking through this area, gold bulls may still be weak. Then due to the technical resonance of the two channel resistances, it may be difficult for gold to easily break through the 3760-3770 resistance area at present.
So for short-term trading, we can start shorting gold at 3755-3765. If gold continues to rise within a limited space, we can consider adding positions.The short-term support area below is first focused on the 3740-3730 area, followed by the 3715-3705 area.

Gold's rise encountered resistance and launched adeep correctionGold maintains high-level fluctuations at the daily level, but the short-term trend shows weakness. The price on the 4-hour chart has fallen below the previous fluctuation range and is currently obviously constrained by the 3760-3770 pressure zone. The K-line continues to run below the short-term moving average. The overall structure shows a weak and volatile pattern. The recent rebound has approached the previous key pressure area. It is expected that the downward trend will most likely continue after the rebound repair is completed. Although a V-shaped reversal has formed in the smaller cycle, the price has stagnated near the pressure zone. The technical indicators show a top divergence signal, indicating that the short-term momentum is gradually weakening and there is a tendency to turn to adjustment again. The comprehensive technical aspect shows that gold faces downside risks in the short term. It is necessary to focus on the adjustment strength and the performance of the key support level below. The operation suggestion is to short on rallies. Focus on the rebound resistance of 3760-3770 on the top and the support of 3715-3700 on the bottom.

XAUUSD — Rebound or Short-Term Downtrend Continuation?Gold just flushed hard into the support zone, reinforcing 3790 as a temporary top. What should we do now?
📉 Analysis
Price is reacting at resistance; wait for price action here.
Scenario 1: A clean break above opens a recovery toward the next resistance zone around .
Scenario 2: A retest/rejection at leads to another leg down toward , after which the broader uptrend can resume. A liquidity sweep/stop-run into is possible before price turns higher.
Key resistance: ,
Key support:
📊 Trading Plan
Wait for an Easy Trend reversal signal with high volume on 5m when price taps the marked support/resistance zones.
Price is rolling under the trendline; wait for an Easy Trend signal on 5m with high volume to confirm entry.
Example (ENTRY): On 5m timeframe, price broke below the trendline and printed an Easy Trend sell signal with heavy volume, followed by a sharp drop.
Risk management: Stop above the most recent M5 swing high ; move to break-even at 1R (R:R = 1:1).

Ascending Triangle Hints at One More Push to 3800?Currently, gold is encountering resistance around 3790-3800, and the bullish momentum has slightly weakened, but the overall pattern is still bullish. Moreover, judging from the two recent pullbacks, although the bears were given the opportunity to escape from the predicament, they were supported near 3750 and rebounded many times. The strong buying support below greatly limited the retracement space.
Gold has formed an ascending triangle structure in the short term. If this structure is valid, then gold as a whole may still hit 3800, or even continue the upward trend to the 3820-3830 area, which is also the upward limit area I mentioned earlier; but this condition must be established under the premise that gold cannot fall below the 3760-3750 area during the short-term retracement.
Therefore, it is clear that the short-term structural support of gold is located in the 3760-3750 area, and the further strong support below is located in the area around 3730. At present, gold is in the ascending triangle structural resistance area of 3775-3785, so there is still a chance of a pullback in the short term.
Therefore, for short-term trading:
1. For the time being, consider shorting gold in the 3775-3785 area, with a retracement target of 3765-3755.
2. Once gold retraces to the 3765-3755 area, consider going long on gold based on market fluctuations and structural support.
Liquidity Hunt & Bullish Continuation Setup | MMFLOW TRADING📊 Market Context
Gold continues to show impressive bullish momentum, supported by global safe-haven flows amid geopolitical risks and a softer USD backdrop. After breaking through multiple resistance zones, price action is now consolidating near 3760, preparing for the next liquidity sweep. The market narrative is clear: institutional flows and ETF demand are driving momentum, but sharp pullbacks remain possible as liquidity zones above and below get tested.
🔎 Technical Analysis (H1/H4/2H)
Price recently touched 3760, confirming bullish structure.
Short-term support: 3725, acting as CP retest zone.
Stronger support: 3689–3690, overlapping with OBS + FVG low zone.
Resistance targets: 3788 (first liquidity pool) and 3805–3830 (large liquidity area).
Structure remains bullish, but a pullback into demand zones before another leg higher is likely.
🔑 Key Levels
Resistance / Sell Zones: 3760 ➡️ 3788 ➡️ 3805–3830
Support / Buy Zones: 3725 ➡️ 3689–3690
📈 Scenarios & Trading Plan
✅ BUY ZONE 1 (Shallow Pullback): 3725
SL: 3716
TP: 3760 ➡️ 3788 ➡️ 3805 …
✅ BUY ZONE 2 (Deep Liquidity Retest): 3689–3690
SL: 3680
TP: 3725 ➡️ 3760 ➡️ 3788 ➡️ 3830 …
✅ SELL SCALP (Liquidity Trap): Around 3805, only if rejection patterns confirm
SL: 3810
TP: 3775 ➡️ 3760 ➡️ 3740 …
⚠️ Risk Management Notes
Expect liquidity sweeps both above 3788 and below 3725 – don’t chase price mid-range.
Pullbacks are opportunities; stay patient and wait for confirmations.
News-related spikes (Fed or geopolitical) may cause abnormal volatility.
✅ Summary
Gold remains in a clear bullish trend, with 3788–3805 as the next upside magnet. Plan: buy dips at 3725 and 3689–3690, while monitoring for short-term sell traps near 3788–3805. Patience and disciplined execution will be key as liquidity hunts unfold.
📢 Follow MMFLOW TRADING for real-time updates, liquidity-based strategies, and BIGWIN setups on gold!

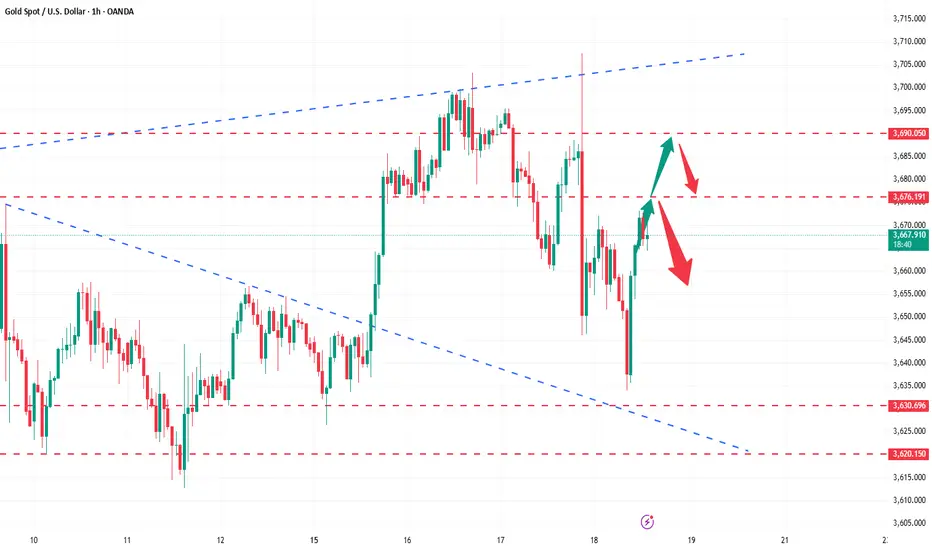
Gold Lures Bulls In — But Correction LoomsAfter the start of the Asian session, gold continued its upward momentum to around 3692. However, it is obvious that after touching this horizontal area, the upward momentum of gold has converged, and there are obvious signs of stagflation. Moreover, judging from the trading volume, the current trading volume is not enough to support the continued rise of gold. So I think gold may usher in a good wave of pullback at any time after the rise.
From a technical perspective, gold has formed a "double-needle bottoming" structure in combination with the areas near 3628 and 3632. However, since the correction near 3707, gold has shown a clear downward trend. Therefore, according to time and space, under normal circumstances, gold is still in an oscillating structure and may find it difficult to break through the resistance of the 3675-3680 area in a short period of time. But the fact is that on Friday, stimulated by the news, gold not only broke the volatile pattern that should have appeared, but also broke through the resistance of 3675-3680 in one fell swoop; when the time and space are not yet in place, the intention of gold's sharp rise may be to eliminate the short chips that have been recently arranged before gold really starts to pull back, and there is also suspicion of luring the bulls who follow the trend.
Based on space calculations, it is expected that the maximum rise in gold this time will not exceed the 3710-3715 area, and it may even start to pull back again before reaching this area. Therefore, we should not be excessively bullish on gold at this point. On the contrary, we can still short gold in batches above 3680, and the retracement target will first target the 3665-3655-3645 area.

Perfectly grasp the golden trading opportunity?Gold touched the pressure level near 3660-3370 several times during the day and then fell under pressure, which perfectly verified our strategic prediction. The continuous short selling at high levels has reaped great rewards. The current trend relies on the pressure of the 4-hour middle track. The short-term trend is still dominated by a volatile downward trend. The pressure focuses on the 3675-3685 area, and the support below focuses on the 3645-3630 area. From the technical structure, the middle track of the Bollinger band is obviously suppressing. If the rebound cannot break through the middle track pressure, the bears will still dominate the short-term rhythm. In terms of operation, it is recommended to maintain range thinking, enter and exit quickly at high altitudes and low prices, focus on grasping the rhythm, and lock in profits. Steady trading comes from early layout and strict execution. Patiently wait for signals from key positions and then enter the market decisively to seize profit opportunities in the volatile market!

Below 3670, shorting gold is still the main theme!After touching 3661, gold has repeatedly tested downwards today. However, this testing period repeatedly found support in the 3645-3640 area, failing to break further below. Judging from the current gold structure, gold as a whole shows a volatile and bearish trend. Although gold closed with long lower shadow candlesticks near 3627 and 3632 respectively, showing signs of bottoming out in the short term, it only exacerbated short-term volatility. Due to the obvious selling pressure from above, I expect that the rebound space for gold in the short term will be relatively limited.
According to the current gold structure, gold will face resistance in the 3665-3675 area in the short term. According to the current market performance, it may be difficult to break through this horizontal area easily in the short term. After all, there is considerable selling pressure from above. So for short-term trading, as long as gold remains below 3670, we can boldly short gold! However, because today is Friday and gold has failed to fall below the 3645-3640 area many times, it is best not to have too high expectations for the retracement space. Perhaps the 3655-3650 area will be a reasonable retracement target in the short term.

Gold rebound encountered resistance, bears may exert force againGold continued its decline yesterday, extending the previous day's downward trend. It hit a low near 3633 before rebounding, peaking at 3672 before falling under pressure again. The US market quickly dipped to around 3627, another sign of bearishness. After breaking through the high, the upward move did not continue, but instead continued to rebound during the day, leaving room for short-term market volatility. Strong upward pressure currently persists around 3670, which also served as a barrier to yesterday's high. While prices have rebounded, the probability of reaching this level is low. A successful breakout could signal the end of the bearish correction. Yesterday, after initially reaching around 3660, the price quickly retreated. While the decline was limited, it provided a clear technical warning. Key support remains at 3620. If this fails, a direct drop below 3600, or even to around 3580, is possible. On the whole, the daily line is still biased towards a bearish retracement pattern. It is recommended to wait patiently for a pullback. If gold pulls back to the 3660-3670 area first, continue to arrange short orders on rallies, with the target first looking at the 3645-3630 area.

Bearish Grip Tightens as 3585 Comes Into ViewAs gold continuously tests and falls below the 3650-3640 area, the space below has been opened to a certain extent. According to the current gold trend structure, as the candle chart shows a long upper shadow line near 3705, there are obvious signs of profit-taking, and there is strong selling pressure from above; a downward-opening trend channel is formed in the structural form, and the center of gravity of gold is gradually shifting downward. The bears are relatively stronger, and there is no obvious bottoming signal below at present. Gold still has the potential to continue to decline!
Although gold has rebounded slightly after several attempts at the 3635-3625 area, the strength of these rebounds has fallen far short of expectations, indicating relatively weak bullish momentum. As gold gradually moves downward, short-term resistance has shifted to the 3660-3670 area. Strong resistance is around 3685, but given the current rebound strength, it is unlikely that gold will reach this resistance area in the short term.
And I think gold will easily continue to decline and test the 3620-3610 area. Once gold falls below this area, the space below will be completely opened. Gold is likely to continue its downward trend to around 3585, and may even experience a deeper correction to around 3550.
Therefore, in a bearish market, we must firmly adhere to a short-gold trading strategy. If gold rebounds weakly to the 3655-3665 area, I would likely prioritize shorting gold. The short-term retracement target will first target the 3625-3615 area.

Don’t hesitate when gold rebounds, just go short!Gold fluctuated repeatedly in the range yesterday, and the trend was completely in line with our trading idea of selling high and buying low. The long and short two-way layout was stable and profits were achieved. The daily line closed with a negative line and a long upper shadow, indicating that the high-level adjustment pattern is still continuing, but the technical indicators have not formed a death cross, and the overall bullish trend is still dominant. The short-term level continues to maintain a volatile and bearish idea. The rebound of the middle track of the Bollinger band in the 4H cycle was blocked and fell back. At the same time, the 1H secondary high was suppressed, and the upper pressure was still significant. Today's operation focus is based on the middle track pressure to see a volatile downward trend. Pay attention to the 3660-3675 area on the top. If this range is broken, the short-term may extend to test the 3685 line; pay attention to the 3625-3610 range on the bottom. Once it stabilizes, it is still a good opportunity to buy on the low. If it holds this position, the bullish pattern remains unchanged. If it is lost, we must be alert to the risk of a deep correction. The current volatile market continues to release room for selling high and buying low. Planned trading is the key to avoiding emotional chasing of gains and losses.

How to operate the layout and don’t miss the golden opportunity!News: As expected, the Federal Reserve cut interest rates by 25 basis points on Wednesday and hinted at two more cuts this year, pushing gold to a record high above $3,700. The dollar's rebound from multi-year lows and rising Treasury yields have put some pressure on gold prices. The latest dot plot suggests another 50 basis point rate cut before the end of the year, but Powell expressed caution about the pace of rate cuts. The long-awaited moment has finally arrived. Despite persistently high inflation, the Fed has clearly shifted its policy focus to achieving full employment. The median forecast for the next two years indicates that the Fed plans to cut interest rates by 25 basis points each year. The forecast range for the end-2026 interest rate is 2.6% to 3.9%. Policymakers expect the unemployment rate to reach 4.5% in December this year and fall to 4.4% by the end of 2026. The market will then focus on Thursday's economic data, including US initial jobless claims and the Philadelphia Fed manufacturing index, as well as policy moves from the Bank of England and the Bank of Japan, which may cause short-term fluctuations in gold prices.
Gold Trend Analysis: Gold's bullish trend remains intact, and the overall outlook remains bullish, but there is still a risk of medium-term correction. Therefore, when trading, consider waiting for a pullback to go long. After the ups and downs of Monday, Tuesday, and Wednesday this week, gold has twice tested the 3707 high, only to experience significant pullbacks after both attempts. In particular, after the Federal Reserve's interest rate decision, market buying sentiment subsided, and gold fell to a low of 3645. Therefore, it is unlikely that gold will continue to rise in the short term, or even break new highs. Therefore, gold is likely to experience a period of volatile correction in the near term, and there is no need to overestimate the market after the interest rate decision.
From a technical perspective, the daily chart closed at a high level, but failed to break through the unilateral moving average support. Therefore, it is unclear whether gold will reverse its trend. At most, it is showing signs of weakening, forming a high-level consolidation. The key support level below is 3620. A break below 3620 and a series of daily declines, breaking through the unilateral moving average, would indicate potential for a significant decline. The H4 Bollinger Bands are currently converging, with the moving averages converging, indicating a very clear volatile trend. The support point between the lower Bollinger Band and the 60-day moving average is near 3635. Unless this level is broken, it will be difficult to pull the lower Bollinger Band apart, leading to a unilateral decline. Gold surged and then retreated, reaching a low near 3645. Therefore, support points below are very clear, with 3635 and 3620 as key support points. Assuming the overall trend remains unchanged, the principle of buying on dips to key support points is bullish. Focus on 3675, 3690, and 3710 above. Thursday and Friday are likely to see continued high-level fluctuations in the bullish trend.
Gold fluctuations are under your control!After the gold interest rate decision, it went as we expected. Shorting near 3672, it first fell, and then going long near 3630 was bullish. The profit from this round trip was quite large.
First of all, looking at the current overall background, although the Fed has implemented an interest rate cut, the message it conveys is far from purely dovish. Powell's speech suggested that this action is not the beginning of a radical easing policy, but a prudent move to deal with economic uncertainty, especially the weakening labor market and stubborn inflation. According to data released by the U.S. Department of Labor on Thursday, the number of first-time applications for unemployment benefits in the United States in the week ending September 13 was 231,000, which was expected to be 240,000 and the previous value was 263,000. The data fell sharply from the abnormally high level of the previous week and returned to the normal range in the past four years.
From the perspective of gold technology, the 3670-3685 area can be regarded as the second top of the medium term. The bearish trend is established in the medium term first, and adjustments are made in conjunction with the overall short-term operation, with the main short position and the auxiliary long position. This rebound is regarded as a 4-hour adjustment to accumulate momentum and break through to open up more space. A weak closing can continue to be weak based on low consolidation. Missing the good position near 3670 does not mean that there is no position to participate in shorting. You can give yourself 1-2 times of tolerance in the face of the trend. As long as the direction is grasped, the final result will be profitable. This is very important.
