Potential Short Trade on GBPCHF Hourly ChartWe Can notice Here some useful info, which can help us Make the Right Decision
Here's What We See:-
-In the last Move ,Price Broke Kumo Cloud ,Then Retest it & reverse making LH & LL.
-Tenken & Kijunsen Now Out Of Th Kumo Cloud and Move Downside Acting as a Dynamic Resistance to Price
-Chikouspan Also Broke Price & Kumo Cloud, it has a strong resistance which is "Price" itself
-We also can't forget our Future kumo bearish Overview to gave as an extra confirmation
-price Re-test the last Broken Support Structure,With Kijunsen Which is acting as a Resistance Level
-If Price Close below The Broken Structure and Tenkensen , We may have a trigger to Our New Short position
-Be Sure To Be ready
-Thanks a lot
Ichimokuchart

Potential Buying Opportunity On EurJpy on Hourly ChartWe Can notice Here some useful info, which can help us to make a nice Long Trade
Here's What We See:-
-In the last Move ,Price Slightly Close below kijun sen, but Moved Higher Quickly and Closed above it
-Tenken & Kijun sen Support Price Nicely to move upward
-Chikouspan Test Tenken-sen and bounce from it
-Chikouspan Also Have a Nice Strong Support, which is "Price" Itself
-Kumo Cloud is Bullish and Supported Price nicely to Continue to Move upward
-After Price Close above tenken-sen , We Can make a Decisioned to get Long with a nice RR
-Be Sure To Be ready
-Thanks alot

XHVBTCScalping Alts right now... This is just an example how great the Richimoku + Kumo Waves work together. Will take profit soon :)
Used indicators: Richimoku + Kumo Waves
P.s. hit me up if you want to test my high profit indicators.

Bullish engulfing in up trendThere has been a bullish engulfing candlestick pattern on top of a strong support level in an uptrend after a retrace.
Also the price has broken above the kumo as well as the chikou signaling high probability of continuing uptrend.

EUR/AUD - Ichimoku Short Sell SetupThis pair has stalled out a little bit here and started to move sideways. I am waiting on a move higher to test resistance before looking for a sell to the down side. If we can get a rise to kijun sen and a good rejection candle form I will look to enter this sell. If we break through that resistance or fail to raise that high, this setup may become invalidated.

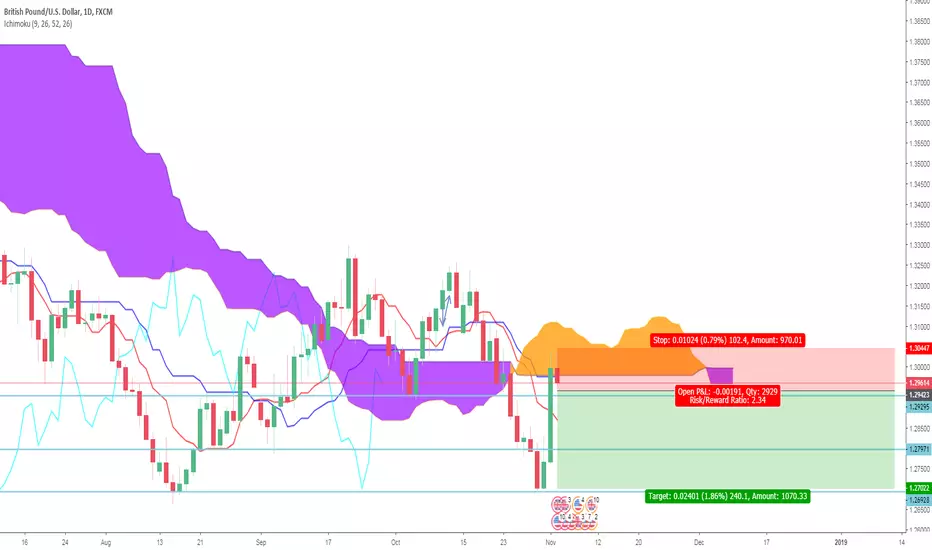
GBP/USD - Ichimoku Short Trade SetupI'm moving to the daily chart for this analysis, so this will be a swing trade instead of our typical short term trade. We rose up at the end of last week and met the kumo cloud and kijun sen acting as resistance. If this resistance holds we can look for a sell. I am setting a sell entry below our current candle, but as an alternative I may take a sell at the kumo cloud if we have a good rejection candle. I'm setting a TP level at our previous structure low. If we fail to get a good rejection candle or break lower, this setup may become invalidated.
BTCUSD BOTTOM! LONG till NOV 5th!So we finally hit the 62XX and only for less than 1 hour! chart really says it all! THE BULLS ARE READY TO RALLY! NO SHORTS till 69XX

Ichimoku Weekly Analysis Possible targets for the coming week using Ichimoku theory (daily time frame).

Bullish divergence and pullbackBearish trend is to continue to the major swing low, where bearish channel trend trend is about to reverse. Now price is likely to go flat and ranging for several days before another drop.

Ichimoku Wave Structure Reversal ExampleShowing an Example of when wave structure breaks down within a strong trend, can signal a reversal is close by. In this example it was straight after.
Interest notes - NT Wave calculation above B Leg
- Wave structure is in harmonization with Number theory, shows it scary power haha.

Silver Quick Buy Idea 8.8Quick scalp trade on XAGUSD. Possible reflection point on the daily timeframe with silver having a steady and slow climb. Hoping to get in on a kijun sen bounce on the daily which coincides with price being unable to break the 4h kumo cloud to the downside. If price is rejected with enough momentum then this trade could be a nice hold if price creates a kumo cloud twist on the daily timeframe.
Entry:14.444
SL: 14.285
TP1: 14.660
TP2: 14.913
TP3: 15.294

4H Bitcoin CloudThe 4H cloud looks to have rejected price once again as price was unable to break above resistance.
This continues to be the metric to break above for medium-term cloud traders.

TLRY - might be time for a pullback, reentry targetCrazy run up, wish I bought in earlier. But looks like a good time to take a little profit, with an aim for reentry around the 50MA (blue line) and the Yellow Kijen line. I put Pink squares around areas
around areas of interest where the pattern repeats, it seems to have played out a few times already.

C-ClampThe C-Clamp idea from yesterday seems to be playing out as price shifts back upwards stabilizing the equilibrium between the tenkan and kijun on the 4H.
Looking ahead we see the cloud lines up with our horizontal resistance right at $6.5k. This is increasingly important to break above for a continuation of the current rally.

Facebook (FB) Review FREE Ichimoku analysis for July 30th 2018Mnthly - The Kijun Sen (pink line) at $163 is crucial support, as always on monthly charts. If the market closes below, and in a bearish manner, we could see FB sell off substantially, down to perhaps $105. Notice the KS held as support 3-4 months ago. Watch that support near $150 (previous swing low) if KS is breached.
Weekly - The close last week within the cloud is not good. The cloud is no man's land, a trendless area, in big picture terms, so a distinct change of character. Last week was an extreme candle and we don't tend to see strong follow through after extremes, so we could see an attempted bounce to the top of the cloud or the KS at 170-180. Also, watch the bottom of the cloud as support if tested.
Daily - Obviously a huge gap down but now trading below the cloud for a bear market in all three time frames ( trading below each of the Ichimoku indicators - TS, KS and Cloud). Continue to watch the bottom of the cloud as resistance on any bounce. If FB trades back within the cloud in a bullish manner, we could see a bounce to KS resistance at 192.

BOE move in the works? - GBP/USD Ichimoku Short Trade IdeaComing up this week we have the Bank of England Rate decision. It's pretty much set that they will raise rates and I believe this has already been priced in to the market already. Instead of playing on GBP strength based off the news I'll be looking for a drop shortly after the news hits. I'm waiting for a drop below the cloud to enter a short position. I've drawn out a few potential Take Profit levels on the way down to my long term target of 1.2963 We also have some bearish confirmations right now like the bearish TK cross and chikou span is starting for fall through price. It would make me a little more comfortable to get a bearish kumo twist to help confirm my bearish bias. If we fail to break below the cloud or our bearish confirmations change, this setup may become invalidated.

Aussie Aussie Aussie - Ichimoku AUD/USD Long setupThis pair has been on a nice bullish run, forming higher highs and higher lows. We've just seen a TK cross on the daily time frame as well that I'm looking to take advantage of. I want to see a rise above the first blue line I drew for an entry, and I've drawn out two other blue lines for potential take profit levels. If we fail to break the previous high, or our bullish confirmations change, this setups may become invalidated.

EUR/CHF still rolling - Ichimoku long setupThis is a continuation from our last EUR/CHF setup, I am now looking to add some entries for a bullish breakout. It's still a little early since we don't have the kumo twist yet, so it's not too late to start looking for entries. I'm going to be expecting a drop to the flat kumo early this week so it can hold support. If price holds there I will look to get long, with TP's at the two blue lines I drew on the chart. If the kumo twist fails to happen or our bullish signs change, this setup may become invalidated.

The Silver Bullet - Ichimoku XAG/USD Trade SetupThis setups is similar to Gold, but Silver hasn't quite developed as far yet. I am still waiting for a completed kumo twist and chikou span to raise a little higher to confirm we will indeed stay bullish. So far we have seen price continue to bounce off kijun sen as support which is promising of an eventual bullish breakout. If we can get those bullish confirmations and we get the kumo breakout we're looking for I'll enter a long position. Similar to gold I'm targeting a longer flat kumo target. With the bottom of the kumo just below kijun, it once again gives a good area to set a tight stop loss with good risk to reward. If our bullish confirmation fail to materialize or we fail to achieve a bullish breakout of the kumo, this setup may become invalidated.

EUR to do the Pounding? Ichimoku EUR/GBP Trade IdeaThis pair has been on a nice bullish run lately and we are now looking for this strong support level to hold. I am looking to enter a kijun bounce trade here which will allow us to keep a pretty tight stop loss and a nice risk reward ratio. I am targeting the previous candle stick body close as my take profit point. If we break below kijun or our bullish confirmations change to bearish, this setup may become invalidated.

Don't Swiss out on this one - Ichimoku USD/CHF Trade IdeaPrice has made two moves to the upside now and has been rejected. With the current movement I am expecting price to try and continue to push lower. If we get the drop we're looking for, it will also be confirmed with a bearish kumo twist that has been trying to complete for the past few trading days. As soon as we break below our previous low, I'll be looking to enter a sell, with a long term target of our previous low. If we fail to break our recent low, or our bearish signs change to bullish, this setup may become invalidated.
