EURUSD Faces a Fresh Test After Buyers Lose the 1.1240 BattleHello traders! Here’s my technical outlook based on the current EURUSD (3H) chart structure. EURUSD previously started to decline and formed a descending wedge structure under the Resistance Line. Price then tested the Seller Zone with a fake breakout and was rejected. Currently, EURUSD is trading below the 1.1240 Seller Zone while holding above the 1.1150 Buyer Zone. The recent rejection and descending structure suggest a possible continuation lower toward support. As long as EURUSD remains bel
Indicelebet
BTCUSDT Short: Rejection at 82,200 Could Drop Toward 79,000Hello traders! Here’s my technical outlook based on the current BTCUSDT (4H) chart structure. BTCUSDT previously traded inside a range before breaking lower into a descending channel. Price then tested the Supply Zone near 82,200 multiple times, where sellers rejected the upside.
Currently, BTCUSDT is trading below the 82,200 Supply Zone while holding above the 79,000 Demand Zone. The repeated rejections from resistance and the overall descending channel structure suggest a possible continuatio
GOLD (XAU/USD): Classic Bullish SignalThe 📈Gold market formed a classic head and shoulders pattern on a 4-hour timeframe.
A breakout above the trendline and neckline of the pattern would serve as a significant bullish reversal signal.
It is highly probable that the market will rise to at least the 4210 resistance level.
GOLD - Countertrend correction. The hunt for liquidity IC:XAUUSD maintains its global bearish trend, although a local countertrend correction is beginning to take shape. The fundamental backdrop remains weak...
The dollar is undergoing a correction amid profit-taking, as is oil. Warsh has not commented on the rate path. The Fed's policy outlook remains hawkish, with the probability of a pause this month at around 22%. However, geopolitics and elevated oil prices are limiting upside potential.
Gold is attempting to establish a foothold above $4
Can Bitcoin Convert Its Latest Bounce Into a Test of 83,600?Hello traders! Here’s my technical outlook based on the current BTCUSDT (2H) chart structure. BTCUSDT previously turned around from the highs and formed a descending structure under the Trend Line. Price then entered a range, tested the Buyer Zone with fake breakouts, and bounced. Currently, BTCUSDT is trading below the 83,600 Seller Zone while holding above the 81,000 Buyer Zone and the ascending Support Line. The recent bounce from support suggests buyers are preparing for another move higher.
XAUUSD: Wedge Structure Holds, Potential Move To Support RetestHello everyone, here is my breakdown of the current XAUUSD setup.
Market Analysis
XAUUSD previously formed a clear Rounding Top near the highs before breaking lower into a downward channel. Price then continued the decline, tested the Resistance Zone near 4,200 with a fake breakout, and was firmly rejected by sellers, confirming the bearish bias.
Currently, XAUUSD is trading below the 4,200 Resistance Zone while holding above the 4,080 Support Zone. The completed Rounding Top, repeated rejec
Gold 4H: Inverse Head and Shoulders SetupHi!
Gold is showing a potential inverse head and shoulders formation after breaking out of the descending channel that has been controlling price since the August high.
The structure is becoming interesting as price approaches the $4,200 to $4,220 neckline. This area has acted as resistance several times, so a clean 4H close above it would be an important confirmation for the bullish scenario.
If the neckline is broken and successfully held as support, I would be looking for continuation towa
Bitcoin Huge Drop to 69k! Then New All Time High.Bitcoin is probably starting a massive 20% correction - my target is 69k. Why? I have many reasons.
The first reason is that from a technical point of view, Bitcoin just finished an impulse wave 12345 from the bottom of the bull market. Elliott Wave theory tells us that after an impulse wave we should expect a corrective wave, such as ABC, WXY or WXYXZ. Let's predict a standard ABC correction, and you can see the prediction on the chart.
The second reason is that we have an unfilled FVG betwee
XAUUSD Short: Stalls Beneath Supply as Attention Shifts to 4,070Hello traders! Here’s my technical outlook based on the current XAUUSD (3H) chart structure. XAUUSD previously declined under the Supply Line after breaking from higher levels and formed a clear range near the Demand Zone. Price then tested the Supply Zone near 4,230 several times, where sellers firmly rejected the upside.
Currently, XAUUSD is trading below the 4,230 Supply Zone while holding above the 4,070 Demand Zone. The repeated rejections from resistance and the overall descending structu
EURUSD: Finds Buyers at 1.1200 as the Recovery Gains AttentionHello everyone, here is my breakdown of the current EURUSD setup.
Market Analysis
EURUSD previously traded inside a range before breaking lower under the Trend Line. Price then tested the Support Zone multiple times with breakouts and rebounded, showing signs of buyers defending support.
Currently, EURUSD is trading below the 1.1310 Resistance Zone while holding above the 1.1200 Support Zone. The recent rebound from support and breakout trend line up suggests buyers may attempt another move
EURAUD – Another Selling Opportunity Ahead?EURAUD has been overall bearish, trading within the falling channel marked in red, consistently forming lower highs and lower lows.
After recently rejecting the lower bound of the channel, price is now correcting higher and approaching a strong technical intersection. 👀
📊 Technical Outlook
EURAUD is currently retesting the upper bound of the falling channel, which intersects with the key resistance zone marked in blue, around 1.6250–1.6320.
This intersection is particularly important because
Bitcoin: A Short-Term Breakout Setup Is DevelopingShort-term trading requires flexibility. When the market structure changes, we need to reassess the setup rather than stay attached to our previous bias.
Bitcoin has formed a short-term corrective channel on the 15-minute chart after a strong upward move. Price has now broken above the upper boundary of that channel, opening the possibility of further upside.
View the BTCUSDT chart and setup
Trading Setup
Timeframe: 15 minutes
Buy zone: The marked consolidation area around $81,800–$82,
#TAOUSDT #12h (Binance) Bear pennant on resistance [SHORT]TAO (a.k.a. Bittensor) seems likely to get rejected on 50MA resistance and resume bearish.
Could even retrace down towards 200MA support or lower if broadening wedge breaks out.
⚡️⚡️ #TAO/USDT ⚡️⚡️
Exchanges: Binance Futures, Bitget Futures
Signal Type: Regular (SHORT)
Leverage: Isolated (8.0X)
Amount: 5.1%
Entry Targets:
1) 295.98 - 100.0%
Take-Profit Targets:
1) 252.91 - 50.0%
2) 209.77 - 50.0%
Stop Targets:
1) 310.36 - 100.0%
Trailing Configuration:
Stop: Breakeven -
Trigger: Target (1)
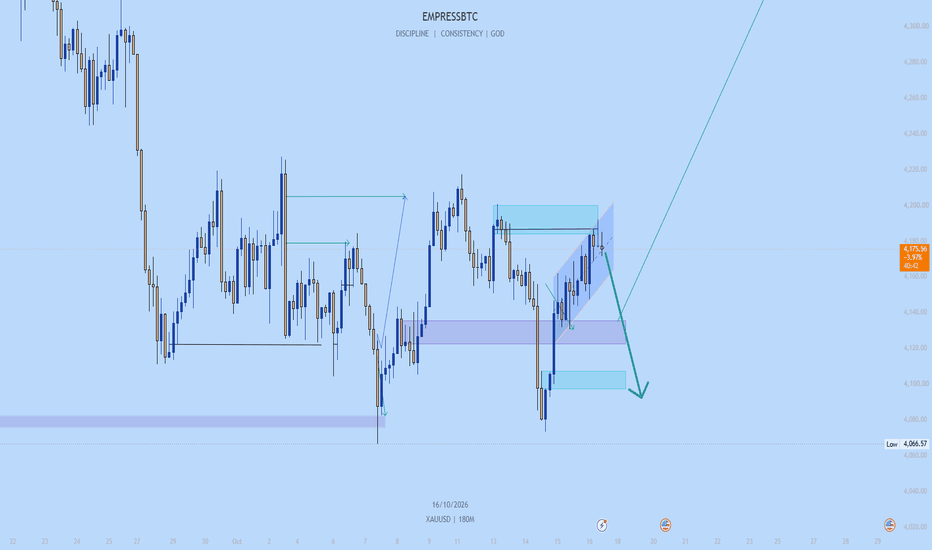
XAU: Supply Zone and Parallel Channel Rejection, Leaning BearishI'm using supply and demand together with the ascending parallel channel here. Price is pushing into the supply zone around $4,185 to $4,200 and testing the top of the channel in 3 hours Time frame, so this is where I'm watching for sellers.
The bounce from the $4,066 low was a climb inside a rising channel, which tells me it's a correction, not a new trend. Price already got rejected near $4,200 earlier this week, and now it's back in the same area. Below, the demand zone at $4,122 to $4,135 i
XAUUSD BUY 4160On the 4-hour chart, XAU/USD has stabilized and rebounded, with the short-term price action forming a potential double-bottom pattern. Immediate resistance lies near 4217; a breakout above this level would signal further upside, with targets in the 4255–4315 range. In the short term, look for buying opportunities within the 4150–4160 zone.
NEAR Breaks Out of a 4-Year Descending Channel: TP1: $11BINANCE:NEARUSDT Weekly Time Frame:
NEAR (1W, log scale) is breaking out of the descending channel that has defined price action since the 2022 top, and the weekly candle is now pushing above the upper boundary.
What the chart shows:
After the 2022 high (~20.6), price spent years in a descending channel, bottoming around the 0.9 area in early 2026.
Since that low, price has risen sharply and is now trading at ~5.4, above the channel’s upper trendline.
The breakout is happening at the 2024 vo
BTCUSDT: Stabilizes Above Support With 85,300 as the Next TestHello everyone, here is my breakdown of the current BTCUSDT setup.
Market Analysis
BTCUSDT previously traded inside a downward channel before breaking higher and forming a range. Price then entered an upward channel, tested the Support Zone near 82,300, and bounced, showing signs of buyers defending support.
Currently, BTCUSDT is trading below the 85,300 Resistance Zone while holding above the 82,300 Support Zone and the upward channel. The recent rebound from support suggests buyers may att
#NEARUSDT #12h (Binance) Rising wedge breakdown [SHORT]NEAR Protocol printed an evening star and a bearish divergence on the RSI.
Seems likely to retrace down to 200MA support if gets rejected here again.
⚡️⚡️ #NEAR/USDT ⚡️⚡️
Exchanges: Binance Futures, Bitget Futures
Signal Type: Regular (SHORT)
Leverage: Isolated (4.0X)
Amount: 5.5%
Entry Targets:
1) 5.525 - 100.0%
Take-Profit Targets:
1) 4.018 - 50.0%
2) 2.509 - 50.0%
Stop Targets:
1) 6.028 - 100.0%
Trailing Configuration:
Stop: Breakeven -
Trigger: Target (1)
Published By: @Zblaba
CRYPTO
GOOGL Symmetrical Triangle Breakout Setup LongExecutive Summary
Alphabet Inc. Class A (GOOGL) is consolidating inside a clean daily symmetrical triangle pattern while successfully defending the rising 200-period moving average and major horizontal support. The core thesis anticipates an explosive upside breakout toward the pattern apex target, offering a projected upward expansion of approximately 15.5% toward primary resistance zones.
Key Technical Confluences
Symmetrical Triangle Compression: Price action is tightening within conve
TRX at End of Multi-Year Correction, Could go to $55+TRX has spent months in an extremely tight range within what I’m counting as wave-e of E. My volatility-compression indicator is showing extreme, persistent readings, with the current stretch approaching its historical duration record.
I’ve labeled the potential 2018–2026 correction as a triangle, although other interpretations remain possible. The more immediate focus is the contracting structure developing from the 2024 high. If this triangle is completing, the count favors an upward thrust.
#AKEUSDT #12h (Binance) Descending wedge near breakout [LONG]AKEDO is sitting on demand zone and about to regain 100EMA support, seems ready for another rally.
⚡️⚡️ #AKE/USDT ⚡️⚡️
Exchanges: Binance Futures, Bitget Futures
Signal Type: Regular (LONG)
Leverage: Isolated (2.0X)
Amount: 5.1%
Entry Targets:
1) 0.023659 - 100.0%
Take-Profit Targets:
1) 0.047052 - 50.0%
2) 0.079832 - 50.0%
Stop Targets:
1) 0.018976 - 100.0%
Trailing Configuration:
Stop: Breakeven -
Trigger: Target (1)
Published By: @Zblaba
CRYPTOCAP:AKE BINANCE:AKEUSDT.P #12h #Akedo