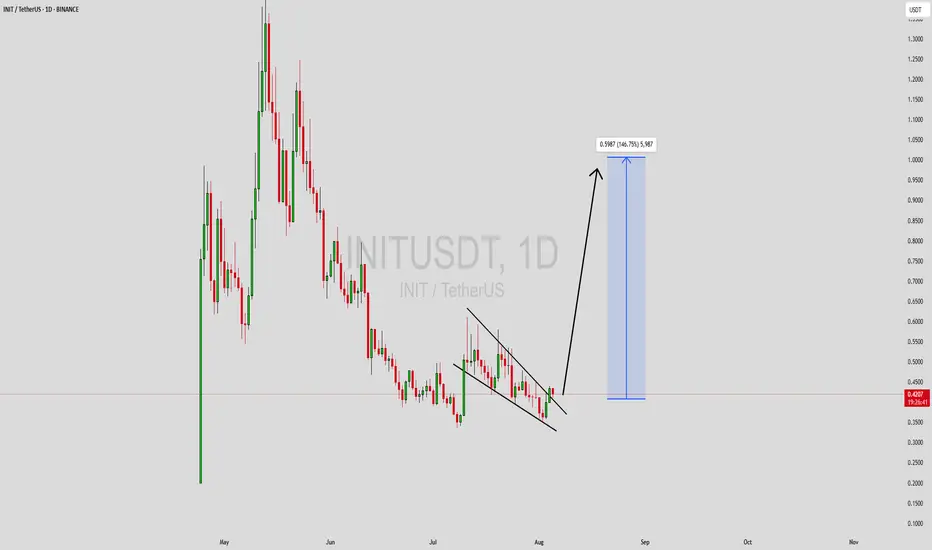
INITUSDT Forming Falling WedgeINITUSDT is showing signs of a classic Falling Wedge Pattern, a bullish chart formation that typically indicates a strong reversal or continuation to the upside. This pattern occurs when price action narrows within a descending range, creating lower highs and lower lows while momentum starts to fade. Once price begins to break out of the wedge with volume confirmation, it often sparks significant upward momentum. The current technical structure of INITUSDT suggests an imminent breakout, with the potential to generate gains between 90% to 100% based on historical wedge breakouts and price projection targets.
Volume for INITUSDT has been consistent and notably supportive, which adds weight to the bullish case. A breakout from a falling wedge pattern on increasing volume typically validates the strength of the move. This surge in volume indicates growing interest and accumulation by market participants who are positioning early for the expected rally. As the pattern tightens and nears its apex, any breakout candle should be watched closely for entry signals.
Investor sentiment around INIT is also turning positive, with attention picking up due to the coin’s underlying potential and recent developments in its ecosystem. Technical traders and crypto enthusiasts alike are keeping a close watch on INITUSDT as it sets up for a major move. Such high-probability bullish setups are rare and offer lucrative risk-reward ratios, especially when backed by both price action and market activity.
This setup reflects a confluence of favorable technical indicators and growing investor interest, making INITUSDT one of the more attractive bullish opportunities on the market right now. Traders should prepare for confirmation and watch resistance levels closely for a potential explosive move upward.
✅ Show your support by hitting the like button and
✅ Leaving a comment below! (What is You opinion about this Coin)
Your feedback and engagement keep me inspired to share more insightful market analysis with you!
Initbtc
#INIT/USDT Potential Bullish Reversal After Down Channel Break #INIT
The price is moving within a descending channel on the 1-hour frame and is expected to break and continue upward.
We have a trend to stabilize above the 100 moving average once again.
We have a downtrend on the RSI indicator that supports the upward break.
We have a support area at the lower limit of the channel at 0.3800, acting as strong support from which the price can rebound.
Entry price: 0.4664
First target: 0.5115
Second target: 0.5579
Third target: 0.6248
To manage risk, don't forget stop loss and capital management.
When you reach the first target, save some profits and then change the stop order to an entry order.
For inquiries, please comment.
Thank you.

INIT buy/Long Setup (4H)On INIT chart we do not yet have a bearish CH on the chart, and within the substructure, we can look for potential buy/long positions.
There is an unmitigated POI zone, and once the price reaches this area, we can look for buy/long setups.
The targets are marked on the chart.
A daily candle close below the invalidation level will invalidate this analysis
Do not enter the position without capital management and stop setting
Comment if you have any questions
thank you
