PSQ: Fundamental OutlookProShares Short QQQ (PSQ) is an inverse ETF designed to deliver returns approximately opposite to the daily performance of the Nasdaq-100 Index, before fees and expenses. It provides a way to hedge a portfolio or gain tactical exposure to declines in large-cap technology and growth stocks. However, PSQ is not a conventional long-term investment in a business or sector. Its annual expense ratio is approximately 0.95%. Because the fund resets its exposure daily, compounding and market volatility c
Insidertrading
LABU: Bullish Momentum in BiotechnologyThe biotechnology sector is showing a significant recovery, with the S&P Biotechnology Select Industry Index gaining approximately 27% year to date and around 40% over the past 12 months. Key drivers include drug innovation, clinical trial results, FDA activity, M&A transactions and the growing use of AI in biomedical research. These developments are attracting renewed investor interest, although individual biotech companies remain highly sensitive to clinical outcomes and regulatory decisions.
EUR/USD: Dollar pressure, but support is close.EUR/USD starts October under pressure from a stronger US dollar. Rising US Treasury yields, higher oil prices and inflation concerns are currently influencing the currency market, while traders are also waiting for fresh US labor market data. The dollar has moved to a 17-month high, while the euro is trading close to its lowest level since May 2025. At the same time, stronger eurozone manufacturing data is providing some support for the euro, keeping the broader picture mixed.
On the daily char
DRAM: Accumulation Before the Next MoveDRAM is trading around 61.29 after a strong recovery from the 45.57–52.92 support area. On the daily chart, price spent several weeks building an accumulation range between roughly 53 and 66, and the recent move back above 59.80 keeps the bullish structure active.
The first major resistance is 66.14, followed by 70.93. A confirmed breakout above 70.93 would open the way toward 78.85–82.07, with the larger Fibonacci targets at 99.43, 118.10 and 129.23. On the downside, 59.80 is the first level t
MP Materials: Accumulation Before a Potential BreakoutMP Materials is trading around $51 after a strong 8% weekly move, with price holding above the 100- and 200-week EMAs while still sitting slightly below the 20/50-week EMA zone around $53.6–53.9. Technically, the chart shows a prolonged correction after the 2025 spike toward $100, followed by accumulation around $40–50 and repeated reactions from the descending support line. The current structure suggests that buyers are defending the $45–50 area, while the CCI is recovering from negative territ
Bitcoin: Recovery Is Testing the Key Resistance ZoneBitcoin is showing a strong recovery after holding the $66.8K–69.2K support area, with price now trading around $75K and moving back above the short-term moving averages. The technical structure on the daily chart suggests that the correction may be developing into a new recovery leg, but BTC is approaching an important resistance area around $82K.
This level coincides with the marked supply/resistance zone and the previous breakdown area, making a breakout and daily close above $82K important
Gold: Bullish Breakout SetupGold is holding above the 4H EMA 20/50/100/200 structure, confirming a bullish trend after the strong breakout from the 4,200–4,240 accumulation zone. Price is now consolidating below the 4,439 resistance, while the recent CCI structure shows signs of bullish divergence. The key buy zone is 4,321–4,378, with a deeper pullback toward 4,226 remaining valid for the bullish scenario. A confirmed breakout and retest above 4,439 could open the way toward 4,546 and 4,645, with 4,670 as the Fibonacci ex
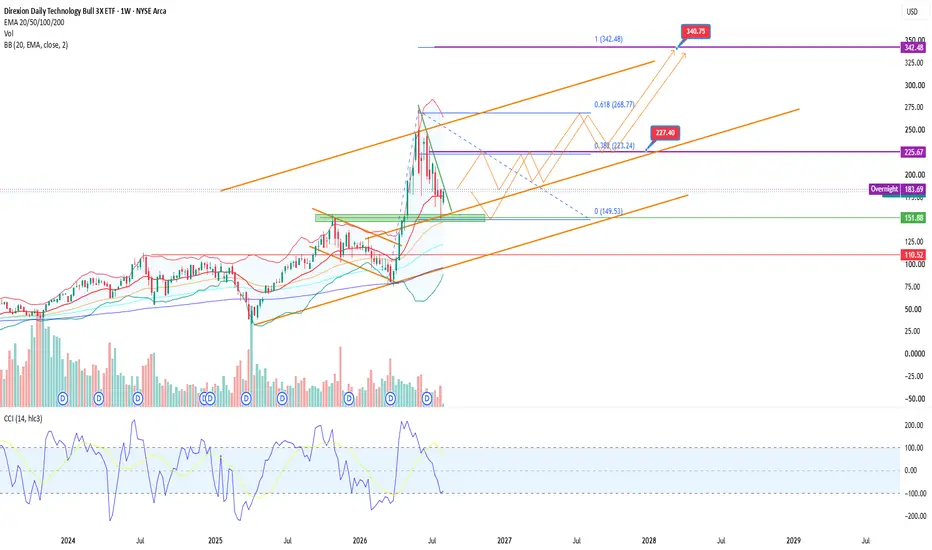
TECL: Is the correction creating a new opportunity?The Direxion Daily Technology Bull 3X ETF remains one of the most volatile ways to gain leveraged exposure to the U.S. technology sector. Long-term fundamentals continue to be supported by investment in artificial intelligence, cloud computing, semiconductors, and strong earnings from major technology companies. If the sector maintains its momentum, these factors could fuel the next bullish leg.
Technically, price is holding the key $150-152 support zone, where buyers previously stepped in. Aft
Gold (XAU/USD): Building a Base for the Next Bullish MoveFollowing an extended correction, gold is attempting to establish a local bottom near the key support zone between $3,995 and $4,095. Price is holding within an important demand area while the CCI indicator is starting to turn higher, suggesting that selling pressure may be fading. As long as this support remains intact, the probability of a recovery continues to improve.
The first bullish confirmation would be a breakout above the $4,198 resistance level. If buyers regain control, gold could a
XAUUSD Buyers Continue to Defend Key SupportFollowing the recent correction, gold continues to hold above the important 4093–4100 support zone where buyers previously stepped into the market. Price is now consolidating inside a tightening range, suggesting that a larger directional move may be approaching. As long as this support remains intact, the probability of a bullish continuation remains higher than the bearish alternative. From a fundamental perspective, gold continues to benefit from expectations of future Federal Reserve rate cu
USOIL | Oil Preparing for Another Leg Higher?After a strong rebound from the July lows, crude oil has stabilized above the 78.5-79.0 support zone and continues to form higher lows. Price is holding above the EMA 20, EMA 50, EMA 100 and EMA 200, confirming a recovering medium-term uptrend. CCI is turning higher again, suggesting bullish momentum remains intact. As long as price stays above 78.6, the primary scenario favors a move toward 83.3, followed by 88.5 and potentially 97.0. A break below 78.6 could trigger a pullback toward the 75.7-
Gold:Market Prepares for the Next Upside MoveGold:Buyers Defend Support as the Market Prepares for the Next Upside Move
After several corrective swings, gold continues to consolidate above the key support zone at $4,092–4,095. Price remains above the rising trendline, while the overall structure suggests that the current correction may be approaching completion before another bullish impulse. As long as this support holds, buyers maintain the technical advantage.
The first resistance is located near $4,131. A confirmed breakout above thi
ARM: A Critical Level for the Next Bullish MoveARM Holdings (NASDAQ)
ARM shares are currently undergoing a healthy correction after a strong rally and are testing the major support zone around $300–301. This area aligns with the 0.382 Fibonacci retracement and sits close to the 200-day EMA, making it a key level for maintaining the long-term bullish trend. As long as price remains above this support, the primary outlook stays constructive.
If buyers successfully defend this area, the stock could attempt another breakout above the major resi
AAPL: Pullback or a New Buying OpportunityApple has pulled back after testing the upper boundary of its rising channel and is now holding near the key support zone at 273.14–274.02. Despite increased short-term selling pressure, the stock continues to trade above its long-term ascending trendline, keeping the broader market structure bullish. If buyers defend the current support and reclaim 288.19, the next upside targets are 317.57 and 354.66. Should the correction deepen, the 247.43 area becomes the next major technical support. As lo
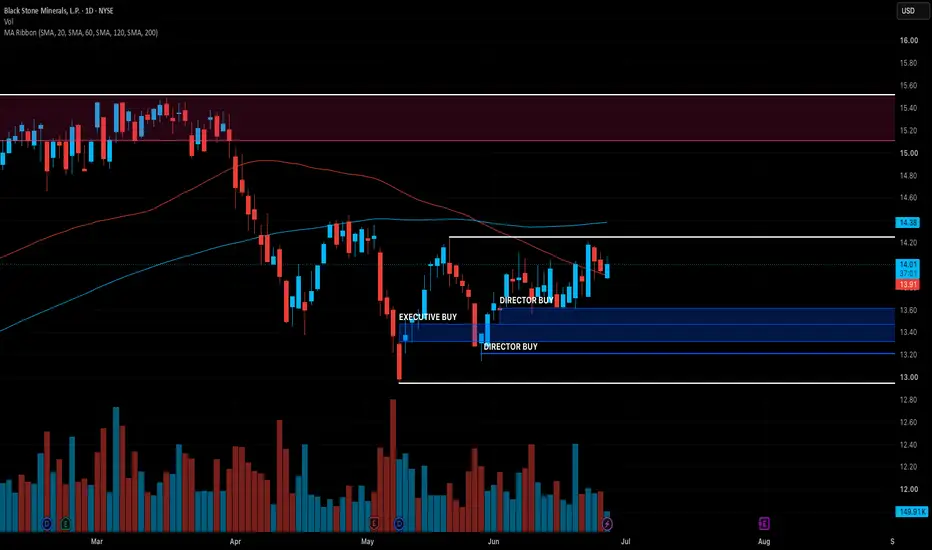
BSM: Insider Buys | Awaiting Pullback Into Lower RangeThere have been a couple of recent insider buys in NYSE:BSM totaling roughly $2.39M near the lower part of the current range.
This is more of a range-support watch than a momentum setup because the chart has been choppy recently. I’m watching for a pullback into the insider buy zone, buyer confirmation, and a possible push back toward the upper range.
ALAB: Consolidation Before the Next Impulse?Astera Labs continues to hold above the key support zone at 303.68–314.66 following a strong bullish advance. Despite the recent pullback, price remains above major moving averages and the overall market structure stays bullish. The current range between 363.59 and 382.30 appears to be a consolidation area before the next directional move. If buyers defend the 312.90 support and reclaim 382.30, the next upside target could be the 500.66 area. A break below 303.68 would increase the risk of a dee
SOXL: Pullback Within a Strong UptrendSOXL has entered a correction phase after a powerful rally and is currently testing the 225.50–226.74 support zone. Despite short-term selling pressure, the overall market structure remains bullish as long as price holds above 178.38. The current pullback may serve as a setup for the next upward leg. If support holds and buyers regain control, the main upside targets are 282.92, 343.93, and 412.76. A breakdown below 225.50 would increase the probability of a deeper correction toward 178.38. For
Micron: Memory Becomes the Key Growth DriverMicron Technology (NASDAQ: MU) is one of the global leaders in DRAM and NAND memory manufacturing, supplying products for servers, data centers, smartphones, and artificial intelligence systems. The company remains one of the primary beneficiaries of growing demand for computing power and AI infrastructure. As a result, Micron continues to attract significant attention from institutional investors and major Wall Street analysts.
From a fundamental perspective, the company is benefiting from str
VTI: The U.S. Market Is Preparing for New HighsThe Vanguard Total Stock Market ETF (VTI) is one of the largest exchange-traded funds in the United States and tracks the performance of nearly the entire U.S. equity market. The fund holds thousands of companies across multiple sectors, making it one of the most widely followed indicators of overall market strength. As a result, both institutional and retail investors closely monitor its performance.
From a fundamental perspective, the U.S. stock market continues to benefit from resilient corp
XAIX: Buyers Remain in ControlThe Xtrackers Artificial Intelligence and Big Data ETF (XAIX) provides exposure to companies operating in artificial intelligence, big data, and digital infrastructure. The fund remains one of the most popular vehicles for investors seeking diversified exposure to the rapidly growing AI industry. As investment in artificial intelligence continues to accelerate, XAIX remains closely watched by both institutional and retail market participants.
From a fundamental perspective, the artificial intel
ALAB maintains a strong bullish structure amid AI sector growthAstera Labs
The stock continues to trade in an uptrend after breaking out from a prolonged correction and is holding above a key support zone. Price remains stable within the 180-170 area, confirming sustained demand and the formation of a base for further upside.
The trading plan is to consider long positions in the 225-200 zone with a possible pullback toward 180. The scenario becomes invalid below 160. Upside targets are located around 295 and 366.
From a technical perspective, the asset i
SMCI: Is the turnaround finally taking shape?Super Micro Computer has been one of the market's most volatile technology stories over the past two years. After an explosive rally driven by enthusiasm surrounding AI infrastructure, the stock experienced a deep correction that tested investor confidence. Yet periods of extreme pessimism often create the conditions for new opportunities, and SMCI may now be entering that phase.
From a fundamental perspective, investors continue to monitor demand for AI servers, relationships with major chip s
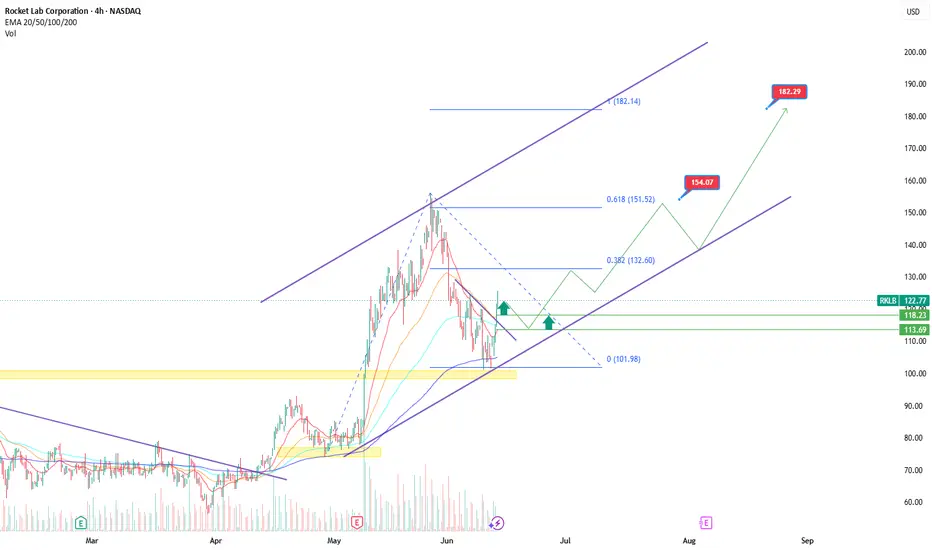
Rocket Lab: Is the correction nearing its end?After a powerful rally, Rocket Lab shares have entered a healthy correction phase, but the broader bullish structure remains intact. The company is one of the leading players in the space industry, providing launch services and developing advanced space systems. Trading on NASDAQ under the ticker RKLB, Rocket Lab continues to attract both long-term investors and active traders due to its expanding business and growing interest in the commercial space sector.
From a fundamental perspective, inve
EURUSD shows potential for continued upside EURUSD shows potential for continued upside toward key resistance
The pair maintains a bullish structure after breaking out of a range and forming a strong upward impulse. The current pullback appears to be a retest of broken levels and the formation of a higher low, indicating continued buyer control.
The trading plan is to consider long positions in the 1.1650-1.1550 zone with a possible deeper pullback toward 1.1450. The scenario becomes invalid below 1.1400. The main upside target is locat