$IREN 1. Executive Summary:
Iris Energy ( NASDAQ:IREN ) is exhibiting a constructive technical structure within a defined bullish trend observed on August 1st. The immediate catalyst is the company's recent earnings release, which typically induces significant volatility. The primary expectation is for a positive price movement; however, a retracement to a key support zone is a standard and healthy reaction post-event. The chart suggests the potential early-stage formation of a head and shoulders pattern, which is a bullish continuation signal in this context. Key Fibonacci retracement levels provide a clear roadmap for potential support at $59.94 (0.236), $49.47 (0.382), and $41.00 (0.50). A successful hold at these levels, coupled with strong market performance, could pave the way for a significant upward move, with a long-term target exceeding $80.
2. Market Context & Catalyst Analysis:
Prevailing Trend: The stock is operating within a broader bullish trend, indicating that the underlying market sentiment has been positive.
Earnings Catalyst: The earnings release on the same day is a fundamental catalyst that can override short-term technicals. The statement "we expect it to rise or hit the support zone" accurately captures the two most probable outcomes:
Bullish Reaction: The earnings report exceeds market expectations, fueling a direct price rise as new buyers enter.
"Buy the Rumor, Sell the News" Reaction: Even with good earnings, a short-term pullback to a key support level is common as traders take profits. This is not inherently bearish but rather a mechanism to build a stronger foundation for the next leg up.
3. Technical Pattern Analysis: Head and Shoulders
Clarification on Pattern Type: The mention of a "head and shoulders pattern" in a bull market likely refers to the Inverse Head and Shoulders pattern. This is a classic bullish reversal or continuation pattern.
Pattern Structure: It is characterized by three troughs: a left shoulder (decline), a deeper head (lower low), and a higher right shoulder, all formed at a support level. The pattern is confirmed when the price breaks above the "neckline" resistance.
Implication: The potential formation of this pattern aligns with the bullish thesis, suggesting that any current consolidation or pullback is likely a period of accumulation before a potential breakout.
4. Fibonacci Retracement & Strategic Support Levels:
The Fibonacci retracement tool, applied to the most recent significant upward wave, provides objective levels for potential buyer entry during a pullback.
Shallow Support (0.236 - $59.94): This is the first and strongest level of support. A bounce from here indicates very robust bullish momentum and suggests the pullback is merely a minor pause.
Moderate Support (0.382 - $49.47): A retracement to this level is considered a healthy and deep correction within a bull trend. It offers a potential high-probability entry point for buyers who missed the initial move.
Deep Support (0.50 - $41.00): This represents a 50% retracement of the prior up-move and is a critical "line in the sand" for the bullish trend. A failure to hold here would call the short-term bullish structure into question.
5. Price Projection & Risk Management:
Upside Target ($80+): The $80+ target is feasible if the stock successfully defends one of the key Fibonacci support levels and subsequently breaks above its recent highs (likely the "neckline" of the potential inverse Head and Shoulders pattern). This would project a measured move higher, potentially fueled by the positive earnings momentum.
Risk Management: The identified support levels ($59.94, $49.47, $41.00) also serve as logical areas for strategic stop-loss orders. A decisive break below the $41.00 (0.50) level, especially on high volume, would invalidate the immediate bullish setup and signal a potential for a deeper correction.
Conclusion:
In summary, the outlook for NASDAQ:IREN is bullish, supported by a positive earnings catalyst and a constructive technical chart showing a potential inverse Head and Shoulders formation. While a move higher is expected, a retracement to the Fibonacci support zone between $59.94 and $41.00 would be a normal and potentially opportunistic event. The bullish thesis, culminating in a run towards $80+, remains contingent upon the stock maintaining its core support structure and capitalizing on the positive fundamental news.
Kalaghazii

S&P 500 ROAD TO 7000 $SPX1. Executive Summary:
Following a significant correction from the 5000 level, the S&P 500 showed initial signs of stabilization on April 7th, 2025. The index had previously been rejected from a major resistance zone near the psychologically significant 7000 mark, having peaked around 6900. The current technical structure suggests a period of consolidation or pullback is underway. Critical support is identified in a layered zone between 6600 and 6200. A key finding from Fibonacci retracement analysis indicates that a hold above the 0.236 level (6428.21) could provide the necessary momentum for a renewed bullish assault, with the ultimate objective of retesting and breaking the 7000 level.
2. Recent Price Action & Market Structure:
Bullish Regeneration (7th April): The price action on this date is technically significant as it represents the first meaningful attempt to "regain" footing after a sustained drop. This could indicate that the initial wave of selling has exhausted itself, allowing buyers to step in.
Key Resistance & Rejection: The prior rejection from the ~6900 zone is a pivotal event. The failure to break through 7000 created a clear ceiling, establishing this area as a major resistance level that the market must now overcome to resume a long-term bullish trend.
3. Support Zone & Fibonacci Analysis:
The market has defined a clear hierarchy of potential support levels that will be critical in determining the next major directional move.
Layered Support Levels:
Immediate Support (6600): This is the first line of defence for the bulls. A bounce from here would indicate underlying strength and suggest the pullback is shallow.
Primary Support (6400): This level converges closely with the key Fibonacci level and is therefore a high-priority zone for buyers.
Significant Support (6200): A breach below 6400 would make this the next critical floor. A hold here is essential to prevent a deeper correction.
Fibonacci Retracement Context:
The Fibonacci tool has been applied to the most relevant upward move (likely from the 5000 low to the 6900 high).
0.236 Fibonacci Level (6428.21): This level is critically important. It represents a shallow retracement of the prior uptrend. The fact that it aligns with the identified 6400 support zone adds significant technical confluence.
Bullish Implication: A successful "bounce" from this ~6400/6428 confluence zone would be a strongly bullish signal. It would indicate that the broader uptrend remains intact and that the drop from 6900 is merely a healthy correction within a larger bull market. This would be the confirmation needed to project a move back towards the 7000 resistance.
Deeper Retracement Scenario (0.382 at 6123.76): Should the 0.236 level fail, the next major support resides at the 0.382 Fib level (6123.76), which aligns with the 6200 support. A bounce from this deeper level would still be constructive but would indicate a longer and more significant period of consolidation before a new high can be attempted.
4. Synthesis and Forward Projection:
The technical picture presents two primary scenarios:
Bullish Scenario (High Probability if 6400 Holds): The index finds strong support at the 6400/6428 confluence zone. The bounce initiated on April 7th accelerates, pushing the price back through the 6600 level and setting the stage for a retest of the 6900-7000 resistance area. A breakout above 7000 would then open the door for further all-time highs.
Consolidation Scenario (If 6400 Breaks): A break below the 0.236 Fib support shifts focus to the 6200/6123 zone. The market would likely enter a longer period of range-bound trading between ~6100 and ~6800 before gathering enough momentum for its next sustained move.
Conclusion:
In summary, while the S&P 500 faces clear overhead resistance following its rejection near 7000, the pullback is currently testing a critical support confluence near 6400. The bullish thesis for a "bounce back to 7000" is technically valid, but it is entirely contingent upon the index defending the 0.236 Fibonacci retracement level (6428.21) and the 6400 support zone. A trader should watch for confirmed bullish reversal signals (e.g., strong bullish engulfing candles, positive RSI divergence) at this level as the potential trigger for the next leg up.

Cleanspark $CLSK1. Executive Summary:
A significant bearish reversal pattern, a Double Top, has been identified on the NASDAQ:CLSK chart, suggesting the exhaustion of the prior uptrend and a potential shift to a sustained bearish phase. The breakdown has already breached the initial Fibonacci retracement support levels at 0.236 ($19.56) and 0.382 ($17.06). The current technical outlook points toward a continued descent towards the deeper Fibonacci levels at 0.50 ($15.03) and 0.618 ($13.01). It is at these deeper retracement zones that the market is anticipated to find a powerful base of support, potentially catalysing a significant rebound with the ultimate objective of retesting the all-time highs.
2. Pattern Analysis: The Double Top Formation
Identification: The pattern is defined by two distinct peaks occurring in February 2024 and October 2025, both reaching a similar price high. The trough between these peaks forms the "neckline" of the pattern.
Interpretation: A Double Top is a classic reversal structure indicating that buying momentum failed to create a new high on the second attempt. This failure often signals a transfer of control from buyers to sellers. A confirmed break below the neckline validates the pattern and activates its bearish price objective.
Implication: The completion of this pattern establishes a bearish near-to-medium-term bias, projecting a measured move downward.
3. Fibonacci Retracement Analysis:
The Fibonacci retracement tool has been applied to the key upward move that preceded the Double Top formation, likely the bull run that culminated in the first peak.
Current Market Progression: The bearish momentum following the Double Top breakdown has been significant, as evidenced by the breach of key Fibonacci support tiers:
0.236 Level ($19.56): The break below this first level confirmed the initial shift in momentum from the highs.
0.382 Level ($17.06): The violation of this more substantial level reinforced the strength of the sell-off, indicating it is more than a minor pullback.
Forward Projection & Strategic Levels:
Next Downside Targets: The path of least resistance remains downward, with the following Fibonacci levels acting as the primary targets for the ongoing bearish move:
0.50 Retracement ($15.03): This level represents a 50% pullback of the entire prior uptrend and is a psychologically significant benchmark watched closely by traders.
0.618 Retracement ($13.01): Known as the "Golden Ratio," this is a deep and historically strong support zone. A move to this area would represent a full and healthy correction of the preceding bull market.
The Rebound Thesis: The core strategic insight is that the 0.50 ($15.03) and 0.618 ($13.01) retracement levels are not merely targets, but potential reversal zones. These deep retracement areas are where long-term investors, value buyers, and institutional money often re-enter the market. The convergence of these levels with the measured move target of the Double Top creates a high-probability zone for a potent bullish reversal. The anticipated rebound from this support base would initially aim for the neckline of the Double Top, with the eventual, long-term objective being a return to challenge the all-time highs.
4. Synthesis and Strategic Outlook:
The current market structure for NASDAQ:CLSK is bearish, with a clear sequence of lower highs and lower lows. The prudent strategy is to anticipate a continued move down towards the $15.03 and $13.01 levels.
However, a sophisticated approach views this not as a one-sided bearish forecast, but as a two-stage process:
Bearish Phase: The downtrend remains intact, driving the price toward the key Fibonacci support cluster between $15.03 and $13.01.
Reversal Watch: As the price approaches this defined support zone, vigilance for bullish reversal signals (such as hammer candlesticks, bullish engulfing patterns, or positive divergence on momentum oscillators like the RSI) becomes critical. These signals would indicate that the selling pressure is exhausting and the anticipated rebound is beginning.
Conclusion:
In summary, NASDAQ:CLSK is operating within a bearish trend following a confirmed Double Top reversal. The technical evidence points toward a further decline to the $15.03 - $13.01 support zone. It is at this juncture that the conditions for a major trend reversal are expected to materialize, setting the stage for a powerful rebound with the potential to reclaim lost ground and ultimately target a return to the all-time highs. All bullish prospects, however, are contingent upon finding a solid base at these critical Fibonacci levels.

Crude Oil ROAD TO 80!The technical outlook for Crude Oil (WTI) has shifted to a bullish bias following a key rejection at a significant resistance level. The subsequent price action has formed a robust ascending channel, indicating sustained buying pressure and a lack of significant sell-offs. The convergence of this channel with a promising ABCD harmonic pattern suggests a potential long-term bullish trend is developing, with a projected target zone near $80.00.
Detailed Pattern Analysis
The analysis begins on Wednesday, 9th April, where the price encountered a clear and defined resistance level on the daily chart. This level represented a point where sellers had previously overwhelmed buyers. However, the market's reaction was notably bullish.
Instead of reversing into a downtrend, the price action following the rejection formed a well-defined ascending channel. This pattern is characterized by a series of higher highs and higher lows, contained within two upward-sloping parallel trendlines. It demonstrates consistent and structured buying interest, with each dip being bought at a progressively higher price.
The observation of "no sign of a drop" is critical. It indicates that the corrections within the channel are shallow and orderly, lacking the aggressive selling volume that would typically signal a reversal. This reinforces the strength of the underlying bullish momentum and supports the thesis for a sustained "long bull run."
The ABCD Pattern: The note that "the ABCD looks promising" refers to a common and reliable harmonic pattern. This pattern suggests that the initial impulsive leg (A to B) is often equal to the subsequent leg (C to D). The completion of this pattern within the context of the broader ascending channel adds significant confluence to the bullish forecast.
Trigger and Target:
Bullish Trigger: A confirmed break and daily close above the $72.50 level is identified as the key catalyst. This level likely represents the recent high or the upper boundary of the initial consolidation. A breakout here would confirm buyer conviction and open the path for the next leg higher.
Long-Term Target: Based on the measured move of the ascending channel and the projected completion point (D point) of the ABCD pattern, the primary profit target is set around $80.00. This represents a significant technical and psychological resistance zone where the pattern would be considered mature.
Conclusion:
In summary, Crude Oil (WTI) presents a compelling bullish setup on the daily timeframe. The combination of a breakout above key resistance, a steady ascent within a defined channel, and a converging harmonic pattern all point towards a continued upward move. The strategy is to enter on a confirmed breakout above $72.50, targeting the $80.00 area, while strictly managing risk with a stop-loss placed below the channel support. This disciplined approach allows for participation in the potential bull run while rigorously protecting capital.

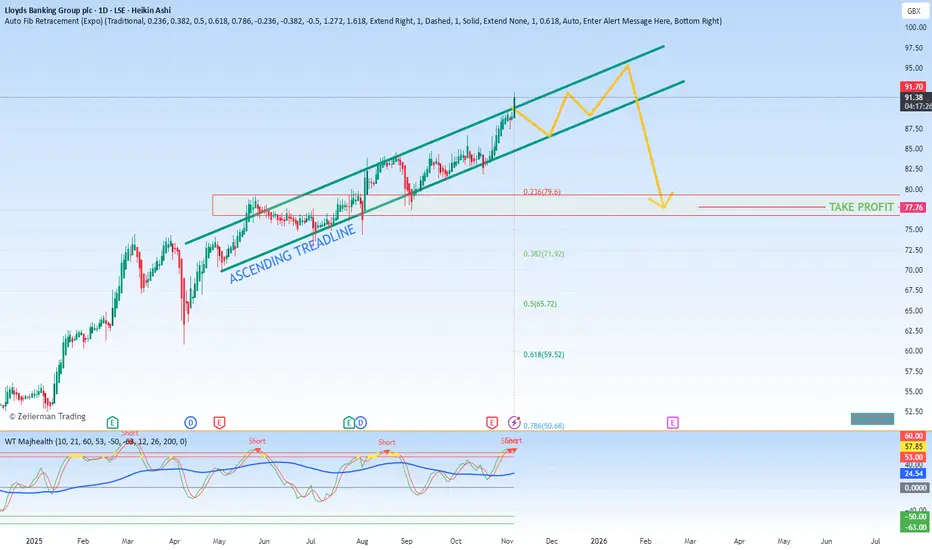
Lloyds Banking Group Almost At 100! $LLOYBased on the technical chart pattern observed in Lloyds Banking Group ( LSE:LLOY ) on May 2nd, 2025, the stock is exhibiting a well-defined bullish structure known as an ascending channel. This pattern is characterized by a series of higher highs and higher lows, contained within two upward-sloping parallel trendlines.
The prevailing interpretation of this formation is bullish, suggesting that the upward momentum is likely to continue as long as the price action remains within the channel's boundaries. The key to this thesis is the lower trendline, which acts as dynamic support.
My trading strategy, therefore, is to remain bullish with a profit-taking target zone between 77p and 80p. This area is identified as a significant resistance level near the top of the channel where a price reaction is anticipated.
However, a critical contingency is in place. Should the price decisively break below and close under the ascending support line, the bullish premise would be invalidated. In this scenario, my plan is to treat this broken support level as new resistance and would consider it a signal to exit the long position to manage risk, as it could indicate a potential reversal or a period of consolidation.
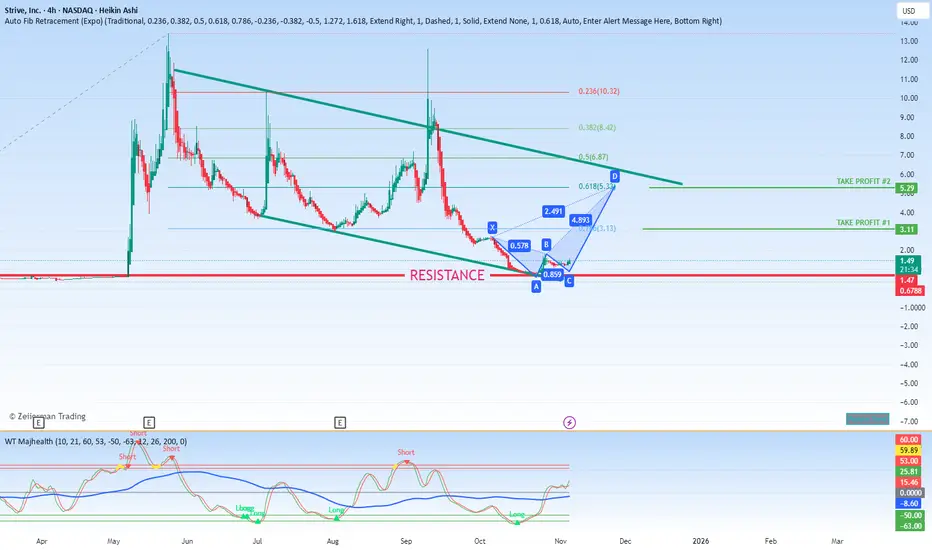
Strive on a bull run! $ASSTAmid broader market uncertainty, Strive Inc.'s shares have fallen 2.76%. Meanwhile, ASST is attracting investor interest and institutional capital due to its advanced technology integrations, which are seen as a key competitive advantage. Analysts note that Strive's future momentum may depend on strategic partnerships and operational efficiencies to restore confidence.
News of ASST's surge is linked to its strategy of entering new markets and innovating products. However, the rally is met with skepticism from analysts who question its valuation, specifically its elevated price-to-sales ratio. This uncertainty causes fluctuating investor sentiment but also opens the door for potential strategic entry points for buyers.
Price Target -
#1 - 3
#2 - 5
Gartley pattern shows the market is bullish
$HIMS - Heading to support! The positive reaction in after-hours trading was driven by HIMS's impressive earnings, with revenues nearing the $600 million mark. From a technical analysis perspective, all eyes are now on the 200-day Moving Average. The critical test will be whether the stock can successfully break through and reclaim this level from below. If it succeeds, the price would re-enter its former trading range, creating a promising setup for a future upward breakout.
On the downside, a failure to overcome the 200-day MA could lead to a pullback. The most likely target in that scenario would be the $37.45 level, which aligns with the 0.618 Fibonacci retracement and has proven to be a reliable support zone in the past.
My investment stance remains firmly long-term. The company's solid fundamentals, underscored by newly announced growth initiatives and a strategic global expansion into markets like Europe, Brazil, and Australia, provide strong conviction to hold through near-term price fluctuations. KalaGhazii
Support and Resistance -
Support - $37.50 - $40.00
Resistance - $60 - $65

MMTec [KalaGhazii] A China-based technology company that provides access to the U.S. financial markets, today announced that it will hold its 2023 annual meeting of shareholders (the "2023 Annual Meeting") at its principal executive offices at Room 2302, 23rd Floor, FWD Financial Center, 308 Des Voeux Road Central, Sheung Wan, Hong Kong, on November 10, 2023, at 9:00 a.m. local China time (or 8:00 p.m. Eastern Standard Time). The Company's board of directors fixed the close of business on October 10, 2023, as the record date for shareholders entitled to receive notice and to vote at the 2023 Annual Meeting or any adjournment or postponement thereof.
Headquartered in Hong Kong Special Administrative Region, our Company mainly focuses on investment banking and asset management business, providing customers with one-stop and all-round financial services.

Sea Star Medical Holding [KalaGhazii] Sea Star Medical Holding Corporation (Nasdaq: ICU), a medical device company developing proprietary solutions to reduce the consequences of hyperinflammation on vital organs, announces receipt of U.S. Food and Drug Administration (FDA) Breakthrough Device Designation for its patented, first-in-class, cell-directed Selective Cytopheretic Device (SCD) for use with patients in the hospital intensive care unit (ICU) with acute kidney injury (AKI) and acute on chronic liver failure. This is the third Breakthrough Device Designation granted by the FDA to Sea Star
Medical for the SCD device, and is expected to expedite the clinical development and regulatory review of the SCD for use in this patient population.

More downside for Nio [KalaGhazii]Nio (NIO) led Chinese EV stocks lower in the wake of poor Tesla (TSLA) earnings.
For its part, Nio expects to report a loss for the quarter on Nov. 9.
The EV maker is also looking to sell branded chips and smartphones.

AdvisorShares Dorsey Wright FSM All Cap World ETF [KalaGhazii] a concentrated, long-term portfolio with low-turnover and a long-term stock picking track record — earned five stars for its overall (out of 534 funds), five stars for its three-year (out of 534 funds) and five stars for its five-year (out of 499 funds) risk-adjusted returns in Morningstar's Mid-Cap Growth category, as of December 31, 2022.

PCTEL, Inc. [KalaGhazii]Amphenol to acquire all outstanding shares of PCTEL
Deal structured as an all cash transaction for total consideration of approximately $139.7 million
PCTI stockholders to receive $7.00 per share in cash
Deal subject to PCTEL stockholder approval and customary closing conditions
PCTEL stockholders’ meeting expected to be held before the end of Fiscal 2023

Senstar Technologies Ltd [KalaGhazii]With innovative perimeter intrusion detection systems (including fence sensors, buried sensors, and above ground sensors), intelligent video-management, video analytics, and access control, Senstar offers a comprehensive suite of proven, integrated solutions that reduce complexity, improve performance and unify support. For 40 years, Senstar has been safeguarding people, places and property for organizations around the world, with a special focus in utilities, logistics, correction facilities, and energy markets

Tupperware Brands Corporation TARGET $3.00 [KaliGhazii]Meme stock Tupperware Brands (TUP) is struggling, but it isn’t dead yet.
The company has been granted an extension to regain compliance with the NYSE.
Shares are up today, but this doesn’t guarantee that its growth will continue.
Tupperware Brands Corp (NYSE:TUP) stock is having its best day in months. The company known for producing kitchen storage containers has been struggling lately. The meme stock momentum that pushed it to noteworthy highs in July 2023 has since run out. But TUP stock may have been granted the lifeline it needs to continue trading on the New York Stock Exchange.
In June 2023, Tupperware received a non-compliance notice from the NYSE, which cited its inability to trade above $1 per share for 30 consecutive days. The company filed for an extension to regain compliance, and this month, they received it. In an 8-K filing dated Oct. 3, Tupperware reported that it had been granted the requested extension.

PowerFleet, Inc.[KalaGhazii]Combined business with total revenue of $279 million, including $210 million in recurring high-margin SaaS revenue and $39 million of adjusted EBITDA for the trailing twelve-month (TTM) period ended June 30, 2023 (excluding selected non-cash and non-recurring items).
The transaction is expected to close in the first quarter of calendar year 2024.
Upon close, the combined business will be branded as Powerfleet, with its primary listing on Nasdaq.

StarTek, Inc.[KalaGhazii]For more than 35 years, Startek has delivered customer experience (CX) excellence for the world's leading brands. Spread across 12 countries, our 38,000 associates create memorable, personalized experiences in both voice and non-voice channels. Our clients span from fortune 500s to fast-growing startups in a diverse range of industries including cable, media and telecom; travel and hospitality; retail and e-commerce and banking and financial services.

Mobilicom Limited MOB [KalaGhazii]Mobilicom (MOB) stock is climbing alongside heavy trading.
That’s despite a lack of news from the company.
This rally could be due to MOB being a penny stock.
With its penny stock status, MOB is open to extra volatility compared to non-penny stocks. That’s due to how easily retail and day traders can target these stocks for pump and dumps. It could be that’s why the company’s shares are rising today. That also means there’s a danger that a drop will follow today’s rally.

SMX (Security Matters)SMX integrates chemistry, physics, and computer science to give materials memory and create a culture of transparency and trust across multiple industries. The company's nearly 100 patents support unique marking, measuring, and tracking technologies allowing clients to seamlessly deploy transparency at all levels of development and provide all stakeholders with a complete provenance of material composition and history, from virgin material to recycled, to address manufacturing challenges and ESG goals while maintaining sustainable growth. As a result, SMX's technologies help companies address ESG commitments and transition more successfully to a low-carbon economy.

SuperCom (SPCB) [KalaGhazii]SuperCom (SPCB) stock is rising Tuesday without any clear news.
However, shares are seeing heavy trading this morning.
This might be due to SPCB being a penny stock.
SuperCom (NASDAQ:SPCB) stock is rocketing higher on Tuesday despite a lack of news from the cyber security company.
There are no new press releases or filings with the Securities and Exchange Commission (SEC) that explain why the stock is up today. On that same note, no analysts are offering new coverage of the shares that would cause today’s rally.
However, that doesn’t mean SPCB is moving without reason. Investors will note that the company’s shares are experiencing heavy trading on Tuesday. That has some 15 million shares on the move as of this writing. For comparison, its daily average trading volume is about 408,000 shares.
One thing that traders will want to keep in mind is that SPCB is a penny stock. This comes from its low closing price of 36 cents yesterday, as well as its market capitalization of just $2.164 million.
