LUNC Approaches Key Support — Breakout or Breakdown?💵 Coin: CRYPTOCAP:LUNC / USDT
⏳ Time Frame: 2D
📍 Current Price: around 0.00005424
📉 Main Structure: Descending Trendline
🟨 Support / Demand Zone: 0.0000475 – 0.0000440
The LUNC/USDT chart currently shows price trading below a Descending Trendline, formed by a series of lower highs since the peak around the 0.00010–0.00012 area.
Price is now approaching the intersection between the Descending Trendline and the 0.0000475–0.0000440 support zone, making this area important for determining the ne
LUNCUSDT
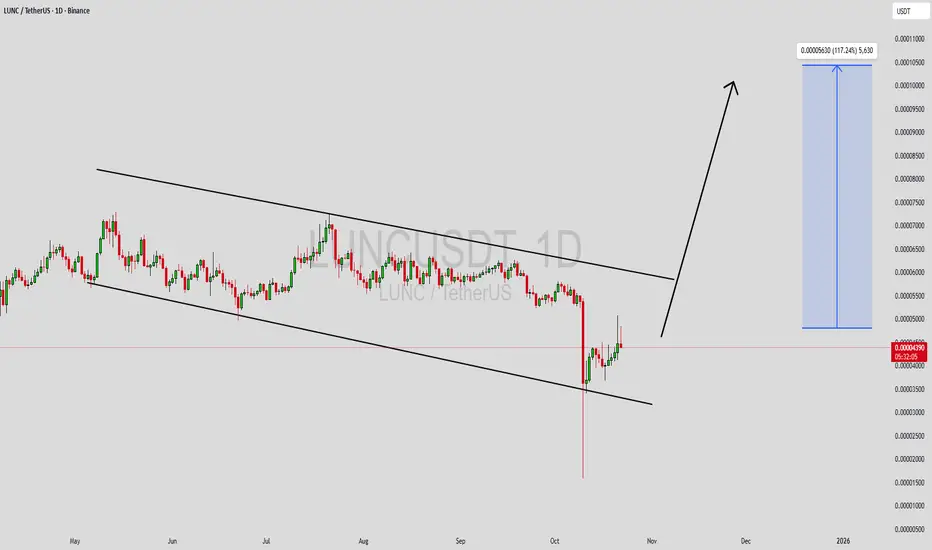
LUNCUSDT - Descending Channel Breakout or Another Sell-Off?LUNCUSDT on the 12H timeframe is still trading within a Descending Channel (Falling Channel) that has contained price action since the early May peak. 📊 The current structure indicates that the medium-term trend is still dominated by sellers, but price is approaching the end of the channel, increasing the probability of higher volatility and a major breakout. ⚡
📍 Price is currently trading around the mid-to-lower section of the channel. As long as it remains below the red resistance trendline,
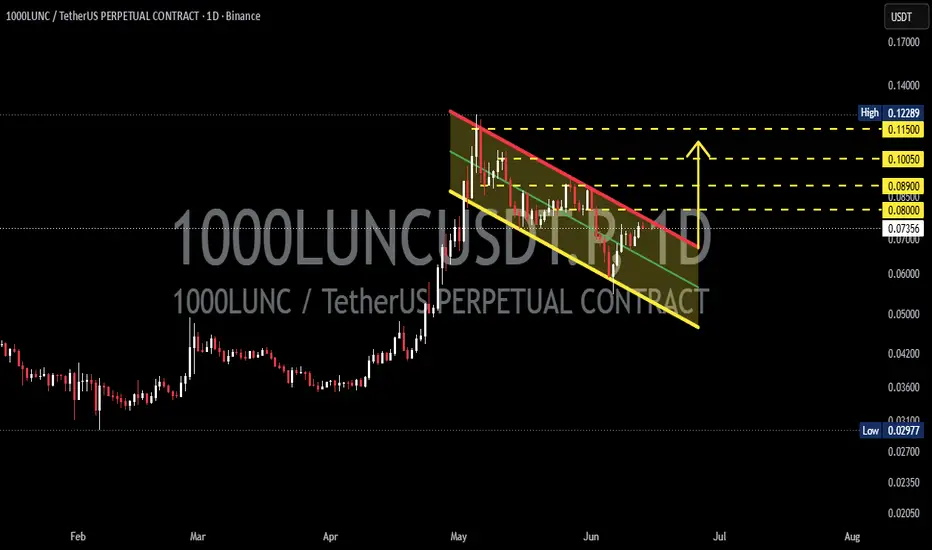
LUNC/USDT – Bullish Flag, Ready for a Higher Move?On the daily (1D) chart, 1000LUNC/USDT appears to be forming a Bullish Flag Pattern 🏳️📈, one of the most popular bullish continuation patterns that typically develops after a strong upward impulse.
Price previously experienced an aggressive rally from around 0.04500 to a peak near 0.12289 🚀, followed by a healthy correction phase that formed a descending channel (flag) characterized by a series of lower highs and lower lows.
At the moment, price is trading near the upper boundary of the patter
LUNC: Is The Legend Making a Comeback?1. Introduction: Market Cap & Global Status
Following the historic 2022 collapse, Terra Classic (LUNC) operates entirely under community and validator governance after the complete dissolution of Terraform Labs. Trading at a ~$400M market cap (Ranked ~120th), LUNC remains a highly speculative yet structurally resilient asset entering a critical macro cycle.
2. Global Capital Rotation & News CatalystsWhile short-term macroeconomic pressures and BTC/ETH corrections weigh on altcoins, Bitcoin Domin
LUNC Order Flow: Why the 1H Rally is a TrapChasing LUNC after a vertical 10% rip into premium resistance is mathematical suicide. The timeline is aggressively bidding the v4.0.1 network upgrade and the recent 923 million Binance token burn, assuming this is the start of a macro reversal.
If you are buying here, you are trading the narrative, not the liquidity. You are providing exit liquidity to algorithmic sellers.
Here is the verifiable on-chain reality and the 1H microstructural data proving why this rally is exhausted, and exactl
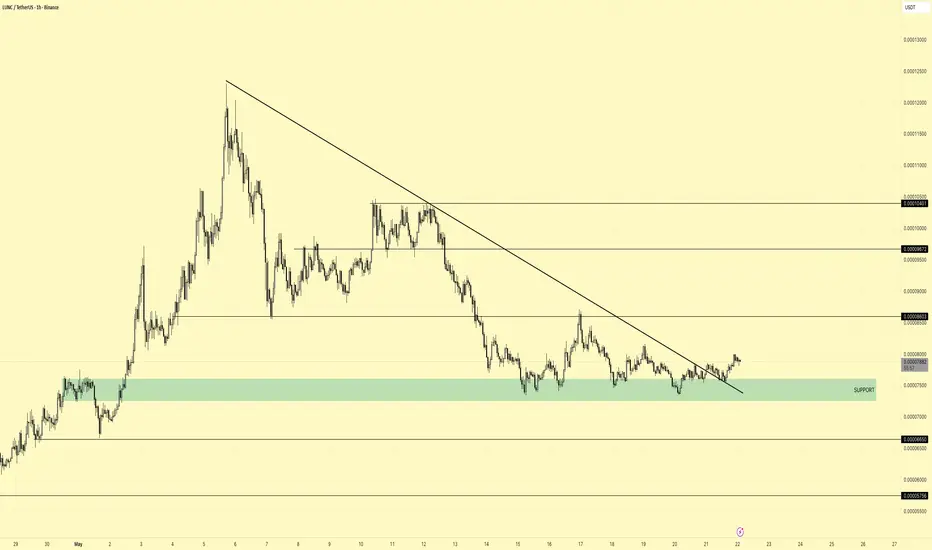
LUNCUSDTLUNC/USDT 1H Analysis
LUNC has been respecting a long-term descending trendline for an extended period, but price is now starting to push above that structure while holding a key support zone around 0.000073–0.000075.
The highlighted support area has reacted multiple times, showing clear buyer interest whenever price revisits the zone. At the same time, the recent move above the descending trendline suggests weakening bearish momentum in the short term.
If price can maintain acceptance above
Terra Luna Classic soon to jump—more than 660% profits potentialLUNC has been rising... Here the market bottom appeared October 2025, we all know about this event.
We have higher lows and a major high based on a 225% move in early December. This move came together with the highest buy volume ever.
Now, we still have no uptrend just a strong recovery phase. The move that is about to develop can result in a higher high compared to December and this would confirm a new uptrend. This is only weeks away.
This is one aspect of the chart.
The second aspect to c
Terra Classic (LUNC) · The sudden jump · 184% - 580% short-term This process has been in the making for months right? Six months in the making, so there shouldn't be a surprise when LUNCUSDT starts to grow, suddenly, in bull-run mode. It will be sudden but the build up process took forever. The tool to count the candles says 183 days.
See the green rising triangle, it reveals the bullish bias. There is also a Fibonacci extension level that was just conquered as resistance, the 0.148 ($0.00004014).
Back to the targets. I am seeing a sudden jump but only sud
LUNCUSDT Forming Bullish MomentumLUNCUSDT is forming a clear bullish momentum pattern, a classic bullish reversal signal that often indicates an upcoming breakout. The price has been consolidating within a narrowing range, suggesting that selling pressure is weakening while buyers are beginning to regain control. With consistent volume confirming accumulation at lower levels, the setup hints at a potential bullish breakout soon. The projected move could lead to an impressive gain of around 90% to 100% once the price breaks abov
$LUNC – Approaching Buyers Fair Value GapBINANCE:LUNCUSDT
CRYPTOCAP:LUNC – Approaching Buyers Fair Value Gap After Sharp Decline on 4H Chart 📉
🛡️ Defensive zone ahead
After a strong rally in early March followed by weeks of consolidation and gradual selling pressure, LUNC has broken lower and is now heading directly toward the Buyers Fair Value Gap #93 (0.00003885 – 0.00003955).
The price has formed a series of lower highs and lower lows, with the latest drop accelerating toward this demand zone. This FVG represents a significa
LUNCUSDT Forming Bullish MomentumLUNCUSDT is forming a clear bullish momentum pattern, a classic bullish reversal signal that often indicates an upcoming breakout. The price has been consolidating within a narrowing range, suggesting that selling pressure is weakening while buyers are beginning to regain control. With consistent volume confirming accumulation at lower levels, the setup hints at a potential bullish breakout soon. The projected move could lead to an impressive gain of around 80% to 90% once the price breaks above
LUNCUSDT Forming Bullish PennantLUNCUSDT is forming a clear bullish pennant pattern, a classic bullish continuation signal that often indicates an upcoming breakout. The price has been consolidating within a narrowing range, suggesting that selling pressure is weakening while buyers are beginning to regain control. With consistent volume confirming accumulation at lower levels, the setup hints at a potential bullish breakout soon. The projected move could lead to an impressive gain of around 90% to 100% once the price breaks a
LUNCUSDT Forming Bullish PennantLUNCUSDT is forming a clear bullish pennant pattern, a classic bullish reversal signal that often indicates an upcoming breakout. The price has been consolidating within a narrowing range, suggesting that selling pressure is weakening while buyers are beginning to regain control. With consistent volume confirming accumulation at lower levels, the setup hints at a potential bullish breakout soon. The projected move could lead to an impressive gain of around 90% to 100% once the price breaks above
LUNC Analysis (4H)LUNC has moved sharply and without any correction toward the strongest supply zones and has absorbed a large amount of liquidity. Moves like this are not trends; they are impulsive pushes meant only to sweep liquidity.
In my view, sufficient liquidity has now been collected, and the market should enter a phase of price and time correction, gradually and calmly moving toward lower levels while forming a time-based correction.
The supply zones and targets are marked on the chart.
A daily candle
LUNC Showing Classic Three-Drive StructureHi!
The chart illustrates a strong pump followed by what looks like a developing three-drive pattern. After the first drive, price pulled back roughly 33%, forming a solid base before climbing into the second drive. Momentum is still bullish, but a deeper retracement may occur before the projected third drive toward the 0.000116 area. As long as corrections stay controlled and volume supports the trend, the overall structure suggests continued upside potential.
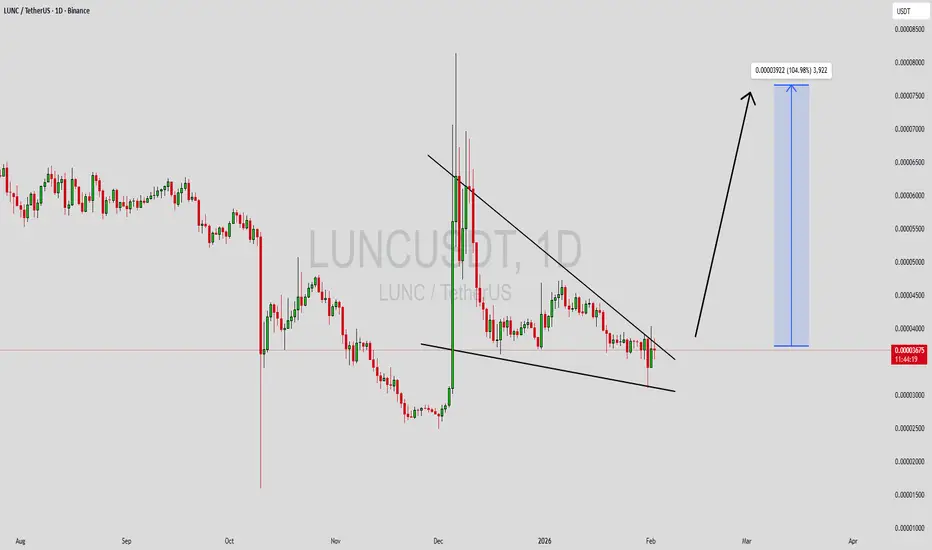
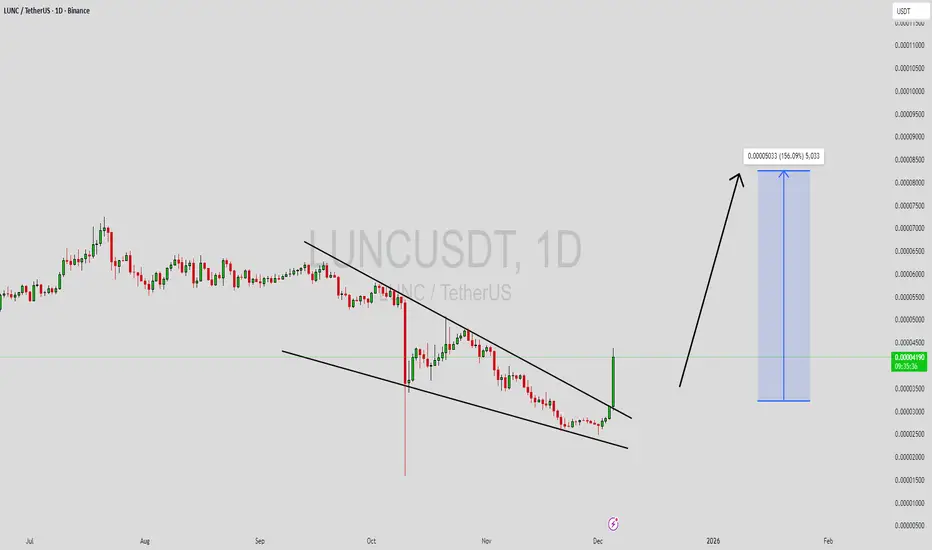
LUNCUSDT Forming Falling WedgeLUNCUSDT is forming a clear falling wedge pattern, a classic bullish reversal signal that often indicates an upcoming breakout. The price has been consolidating within a narrowing range, suggesting that selling pressure is weakening while buyers are beginning to regain control. With consistent volume confirming accumulation at lower levels, the setup hints at a potential bullish breakout soon. The projected move could lead to an impressive gain of around 90% to 100% once the price breaks above t
LUNCUSDT Forming Falling WedgeLUNCUSDT is currently forming a falling wedge pattern, one of the most reliable bullish reversal setups in technical analysis. This pattern indicates that the asset may be nearing the end of its downtrend, preparing for a breakout to the upside. The narrowing price range suggests that selling pressure is weakening while buyers are gradually stepping in, supported by good trading volume. This combination often signals an imminent price reversal and potential for a strong bullish move.
With an ex
LUNCUSDT — Accumulation at Demand Zone, Breakout or Breakdown?📝 Overview
The pair LUNC/USDT on the weekly (1W) timeframe is showing a long and extended consolidation phase since mid-2024 until now. Price has been moving sideways within the demand zone (0.00004665 – 0.00005990), marked by the yellow box on the chart.
This area serves as the final defense for buyers, acting as an accumulation base before a potential breakout to the upside. On the other hand, if broken to the downside, it could flip into a supply zone that drives price even lower.
---
🔎 P
LUNC is going to go up from here.... The Luna Scammers are GoneLuna is going to become popular again as it is an OG to the crypto game.
Grab your LUNC while you can... This is the perfect time to whale in if you are looking for a high risk, high gain scenario.
LUNA is just simmering before it takes over again.
LUNC is the peg and governance token. Burning away by the day.
Let me know your bet on this one. I don't think there is a deeper pit for LUNC based on priced and reputation of LUNA. Ready to reverse!
BTC an go to the pits and I am confident w
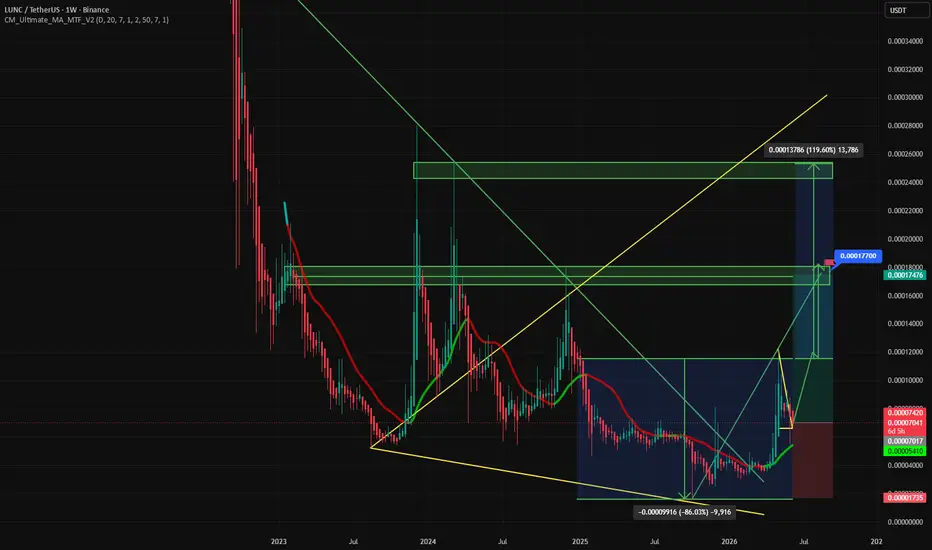
Terra Luna Classic LT Double-Bottom & 771% Potential ProfitsYou can say it is a long-term (LT) triple-bottom when taking into consideration the July-August 2024 support.
Terra Luna Classic (LUNC) has been reacting at the same level for years. Each time this strong support range gets challenged, what follows is a bullish wave.
» August 2023 marked the bottom of the bear market. And this produced a bullish wave.
» July-August 2024 marked the bottom of a correction and this produced a new period of growth.
» February-June 2025 is the present low and th
LUNC Bullish Inverted Head and Shoulders – Testing Neckline Agai🚀 SEED_DONKEYDAN_MARKET_CAP:LUNC Bullish Inverted Head and Shoulders – Testing Neckline Again 📈
SEED_DONKEYDAN_MARKET_CAP:LUNC has formed a bullish inverted head and shoulders pattern and is now testing the neckline in red once again. This could be the final breakout we’ve been waiting for! 🔥