MANTA / MANTAUSDT Bullish Setup | Futures Trade IdeaMARKET ANALYSIS
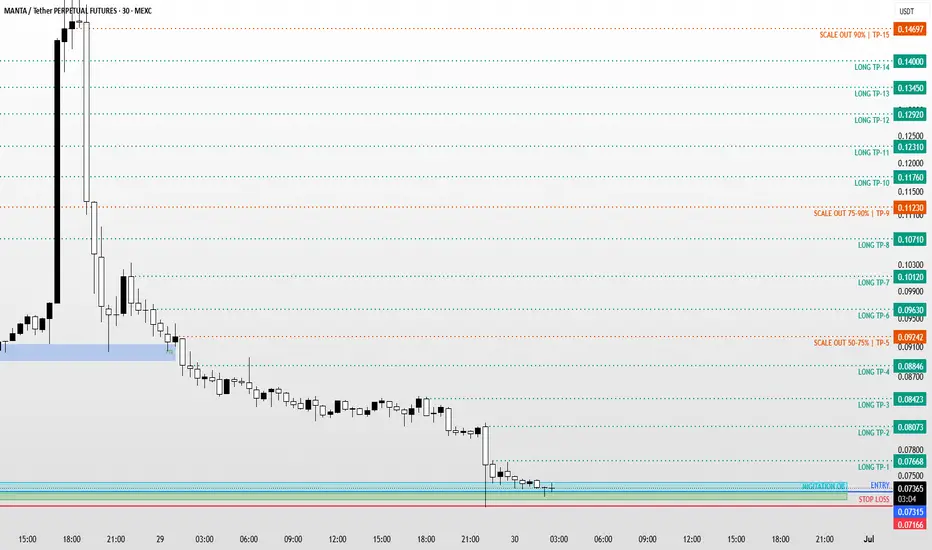
MANTA is currently reacting from a key technical area highlighted on the chart.
As long as the protected support zone remains intact, the bullish market structure remains valid and higher liquidity targets may continue to attract price action.
A breakdown below the invalidation level would weaken the current bullish scenario and require a reassessment of market conditions.
📍 Entry, Stop Loss and Take Profit levels are marked directly on the chart.
━━━━━━━━━━━━━━
⚠️ DISC
Mantausdtperp
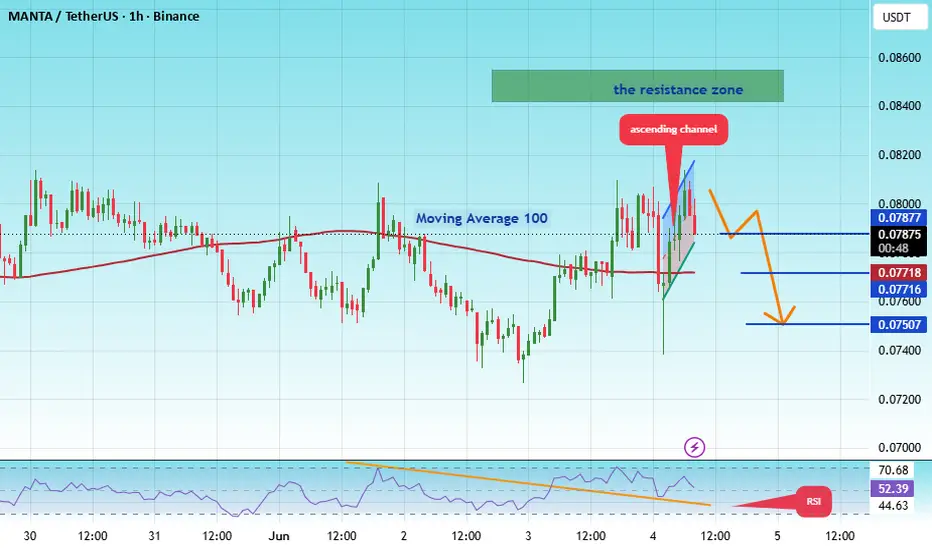
#MANTAUSDT may continue its trend after correction#MANTA
The price is moving within an ascending channel on the 1-hour timeframe and has reached the lower boundary, heading towards a breakout. A retest of this boundary is expected.
The Relative Strength Index (RSI) indicates a downward trend, and this trend is likely to continue due to the overbought condition.
There is a key resistance zone (in green) at 0.08525, which the price has bounced off several times, making it a strong support level.
A consolidation trend is observed above the 100
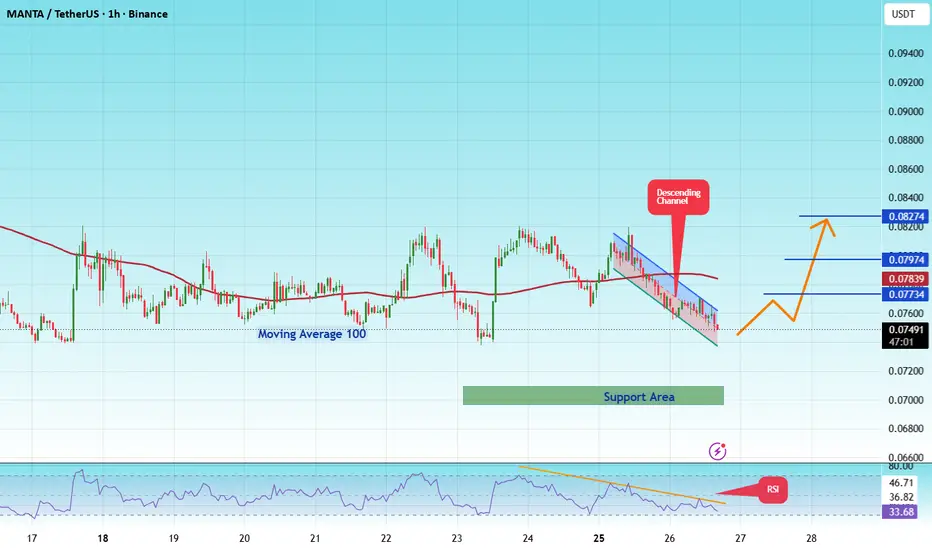
#MANTAUSDT – Bullish Setup Alert ?
#MANTA
The price is moving within a descending channel on the hourly timeframe. It has reached the lower boundary and is trending towards a bounce. A retest of this boundary is expected.
The Relative Strength Index (RSI) indicates a downward trend, and this trend is likely to continue due to the overbought condition.
A key support zone (in green) has been identified at 0.07000. The price has bounced off this zone several times, making it a strong support level.
The price is trending towards
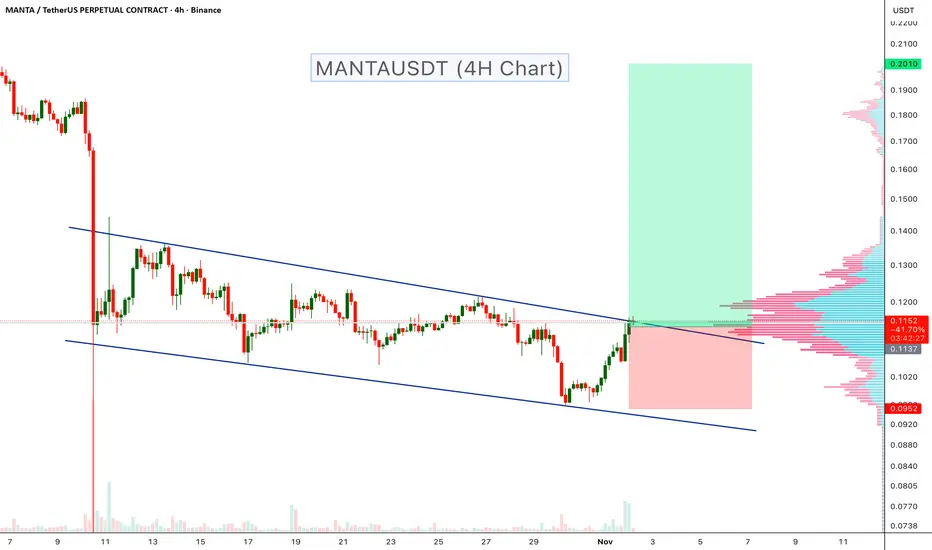
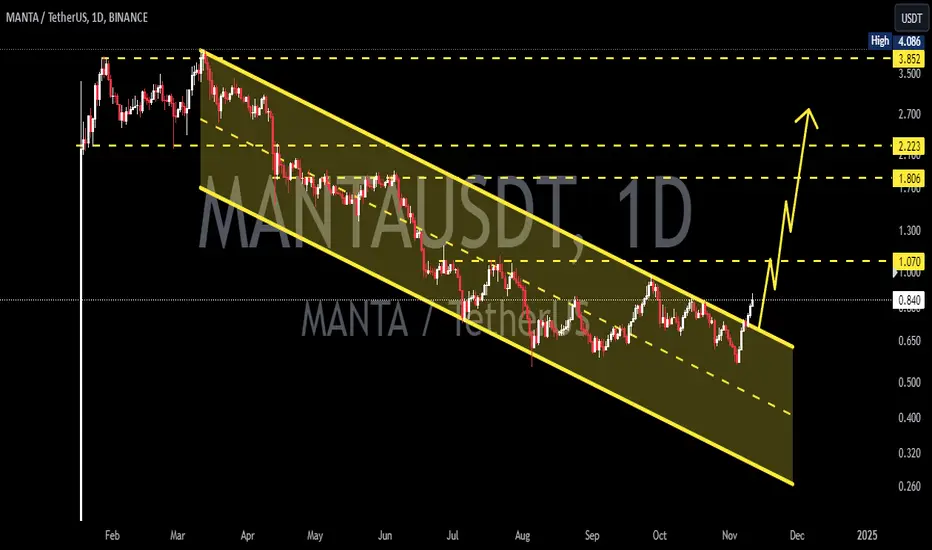
MANTAUSDT Bullish Channel Breakout!MANTA is showing a potential bullish breakout from a descending channel that has been holding price down throughout October. The recent strong recovery and breakout attempt above the upper trendline indicate early signs of trend reversal and possible momentum shift to the upside.
Key Points:
-Price has broken the upper boundary of the descending channel after multiple rejections.
-Volume increase on breakout confirms buyer activity.
- Horizontal volume profile shows a strong liquidity base n
#MANTA/USDT#MANTA
The price is moving within a descending channel on the 1-hour frame, adhering well to it, and is heading for a strong breakout and retest.
We are seeing a bounce from the lower boundary of the descending channel, which is support at 0.290.
We have a downtrend on the RSI indicator that is about to be broken and retested, supporting the upward trend.
We are looking for stability above the 100 moving average.
Entry price: 0.305
First target: 0.329
Second target: 0.348
Third target: 0.373
MANTA/USDT – Bullish Structure Forming MANTA/USDT – Bullish Structure Forming
MANTA is showing early signs of a trend reversal, with multiple confluences indicating strength from the bulls. After a prolonged downtrend, the asset has not only broken key resistance levels but also flipped the 50 EMA, a major dynamic resistance, into support.
✅ Key Technical Highlights:
Double Bottom Formation:
The chart has clearly printed a double bottom, one of the most reliable reversal patterns.
This formation suggests that bears are losing con
MANTA Breakout Trade Setup – Long OpportunityMANTA has broken out of a clean ascending triangle formation, confirming bullish strength. The breakout happened just above a key horizontal resistance and the 50 EMA, flipping both into support.
The chart shows a strong impulse candle on breakout, with a well-placed stop below the ascending trendline and a healthy 4.5R risk-reward to the upside. RSI sits near neutral (50.86), suggesting there's still room for price expansion.
DYOR, NFA
#MANTA/USDT Ready to go higher#MANTA
The price is moving in a descending channel on the 1-hour frame and sticking to it well
We have a bounce from the lower limit of the descending channel, this support is at 0.833
We have a downtrend on the RSI indicator that is about to be broken, which supports the rise
We have a trend to stabilize above the moving average 100
Entry price 0.867
First target 0.935
Second target 0.978
Third target 1.03
MANTAUSDT Approaching Descending Channel ResistanceMANTAUSDT Technical analsysis update
MANTA has been trading within a descending channel for the past 150 days. The price now moves toward the channel's resistance, signaling a potential breakout. Currently, the daily chart shows that the price is trading above 100 EMA. Once a breakout occurs, a strong bullish move can be expected.
Buy zone : Below $0.88
Stop loss : $0.715
Regards
Hexa
#MANTA/USDT#MANTA
The price is moving within a bullish channel pattern on the 4-hour frame, which is a strong retracement pattern
We have a bounce from a major support area in the color EUR at 0.300
We have a tendency to stabilize above the Moving Average 100
We have an upward trend on the RSI indicator that supports the rise and gives greater momentum, upon which the price depends
Entry price is 0.3300
The first target is 0.3752
The second target is 0.4050
The third target is 0.4400
#MANTA/USDT Trade Setup, 600% Spot Long potential!Manta Breakout Alert!
Manta is trading at a long-term resistance of $0.72, and I’m anticipating a breakout.
While there’s a slim chance of a retest around $0.60 in the coming days, once we see a confirmed breakout and a successful retest, the potential upside could take us to $4.
Trade Setup:
• Entry Range: $0.576 - $0.725
• Targets: $1.04, $1.518, $2.267, and $4.05
• Stop Loss: $0.48
• Risk-Reward Ratio: A highly attractive 1:36
I plan to make $100k with a margin of $10k at 5x leverage
#MANTA/USDT#MANTA
The price is moving within a descending channel pattern on the 12-hour frame and is expected to break upwards
We have a downtrend on the RSI indicator that has been broken upwards and we have a trend to stabilize above it
We have a major support level in green at a price of 0.600
We have a trend to stabilize above the moving average 100 which supports the rise
Entry price 0.650
First target 0.85
Second target 1.00
Third target 1.17
Anticipating a MANTAUSDT Crash: Could the Downside Exceed 60%?Hi Realistic Traders, let's delve into the technical analysis of BINANCE:MANTAUSDT !
On the Daily timeframe, MANTAUSDT is presenting a clear double-top pattern , a classic bearish signal indicating a potential reversal from an uptrend to a downtrend. The recent breakout of the neckline, paired with a surge in volume above the volume MA line, amplifies the downward momentum. With the MACD Indicator firmly in the negative zone, the stage is set for continued downside movement, targeting our
#MANTA\USDT#MANTA
We have a bearish channel on the 12-hour frame, the price moves within it and adheres to its limits well
We have a major support area at Saad 1.70
We have a tendency to stabilize above moving average 100
We have a downtrend on the RSI indicator that has been broken to the upside
Entry price is 2.00
The first goal is 2.50
The second goal is 2.96
the third goal is 3.48
Manta/Usdt Plan MANTA/USDT currently shows strong potential for a breakout, particularly within the confines of a triangle pattern. Based on technical analysis, there is anticipation for an imminent breakout in the near future. It is advised to closely monitor the price action of MANTA/USDT to capitalize on a potentially lucrative opportunity should the breakout occur successfully. If the breakout materializes as predicted, market sentiment suggests a considerable 50-100% bullish movement could follow. Traders
Manta/Usdt is strong Manta/USDT is currently exhibiting strong momentum, with the price hovering close to a potential breakout. I anticipate a breakout in the near future, with a projected target of a 50-100% increase in the coming days. It's important to note that this information is not financial advice, and it is recommended that you conduct your own research (DYOR) before making any investment decisions.
Manta/Usdt idea Manta/USDT:
The market structure has once again turned bullish following a breakout confirmation after a fakeout on retest. The price has successfully broken out of resistance levels, indicating the possibility of a 40-80% bullish movement in the near future. It is essential to note that this information is not intended as financial advice.
MANTA target 41h time frame
-
MANTA go down to support zone with a falling channel, this zone is around 2.4~2.6. From the channel structure, we can see that MANTA got resistance again and again once touching the channel top. Now, MANTA is going to challenge the channel top again, and it is very close to support zone, that provide great risk to reward ratio to long MANTA.
-
TP: 4 / 5.6
SL: 2.47
MANTA ENTRY SETUP #DYOR #NFAThe $2.51-$2.65 range is a very good entry area, but this price depends on Bitcoin (BTC). If BTC drops to $59,500-$61,000, there is a possibility that MANTA will reach the $2.51-$2.65 area. However, if BTC does not drop, then the $2.9-$3.1 price is a good entry point.
Here are some factors to consider:
BTC price action: Keep an eye on BTC price action. If BTC starts to drop, then MANTA is likely to follow.
Volume: Look for increased volume on MANTA. This could indicate that buyers are ent