METISUSDT Forming Falling WedgeMETISUSDT is forming a clear falling wedge pattern, a classic bullish reversal signal that often indicates an upcoming breakout. The price has been consolidating within a narrowing range around $9.20 USDT, suggesting that selling pressure is weakening while buyers are beginning to regain control amid recent 24% daily surges and AI integration hype. With consistent volume confirming accumulation at lower levels around the $8.50 support, the setup hints at a potential bullish breakout soon. The projected move could lead to an impressive gain of 140% to 150%+ once the price breaks above the wedge resistance, sparking buzz in METISUSDT price prediction for Layer 2 scalers.
This falling wedge pattern is typically seen at the end of downtrends or corrective phases, and it represents a potential shift in market sentiment from bearish to bullish. Traders closely watching METISUSDT are noting the strengthening momentum as it nears a breakout zone near $10.00, bolstered by Hyperion's AI-optimized L2 launch and cross-chain payment tools. The good trading volume adds confidence to this pattern, showing that market participants are positioning early in anticipation of a reversal in this Ethereum scaling token.
Investors’ growing interest in METISUSDT reflects rising confidence in the project’s long-term fundamentals and current technical strength, especially with decentralized AI and gaming ecosystem expansions. If the breakout confirms with sustained volume, this could mark the start of a fresh bullish leg. Traders might find this a valuable setup for medium-term gains, especially as the wedge pattern completes and buying momentum accelerates in falling wedge breakout crypto opportunities.
✅ Show your support by hitting the like button and ✅ Leaving a comment below! (What is You opinion about this Coin) Your feedback and engagement keep me inspired to share more insightful market analysis with you!
METISBTC

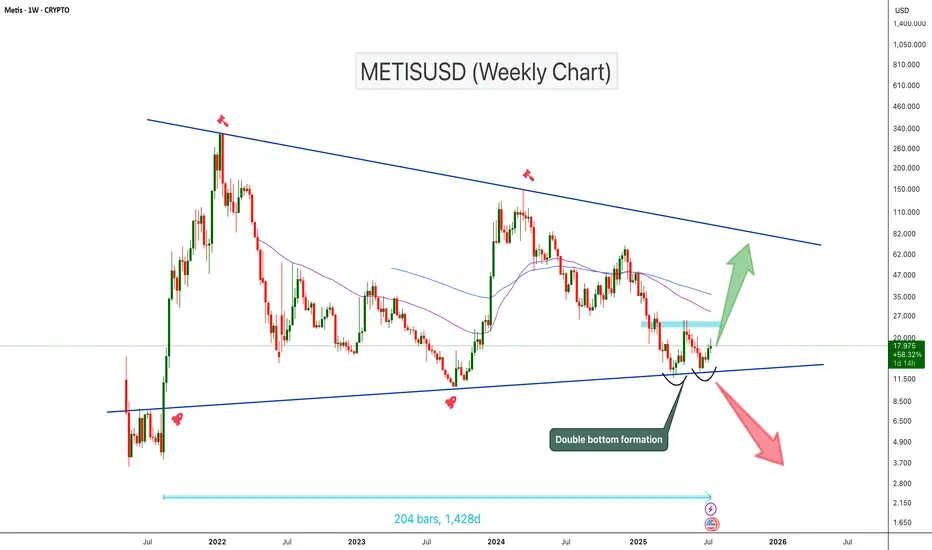
METISUSD Double Bottom at Triangle Support!METISUSD has been trading inside a symmetrical triangle for the past 1,400 days. The price is currently sitting at the triangle support and forming a potential double bottom pattern. The double bottom can be confirmed once the price breaks the neckline resistance zone. If the price breaks this key resistance zone, we could expect a 100%–250% bullish move toward the triangle’s upper resistance
Cheers
Hexa🧘♀️
BINANCE:METISUSDT SEED_DONKEYDAN_MARKET_CAP:METIS
#METIS/USDT#METIS
The price is moving within a descending channel on the 1-hour frame, adhering well to it, and is heading for a strong breakout and retest.
We are seeing a bounce from the lower boundary of the descending channel, this support at 14.73.
We have a downtrend on the RSI indicator that is about to be broken and retested, supporting the upward trend.
We are looking for stability above the 100 moving average.
Entry price: 18
First target: 19.78
Second target: 22
Third target: 25

METIS Rebuy Setup (2D)The METIS token, after experiencing significant drops, is approaching a strong support level.
We are looking for buy/long positions within the green zone.
A daily candle closing below the invalidation level will invalidate this analysis.
Do not enter the position without capital management and stop setting
Comment if you have any questions
thank you

METIS is a racket (3D)METIS now seems to be in wave c of C, which is a bullish wave.
The targets of this wave based on the big wave A and wave a of C can be very attractive.
The time frame is 3 days, which means that this analysis needs time to be realized.
The green area is our BUY area.
Closing a daily candle below the invalidation level will violate this analysis
invalidation level: 28.08$
For risk management, please don't forget stop loss and capital management
Comment if you have any questions
Thank You

METIS is Very BullishIt looks like we have an ABC on the chart. Wave B has just ended and we are now entering Wave C. We are at the beginning of wave C.
Wave B looks like a triangle.
We have identified two short-term targets for METIS.
Closing a daily candle below the invalidation level will violate the analysis.
For risk management, please don't forget stop loss and capital management
When we reach the first target, save some profit and then change the stop to entry
Comment if you have any questions
Thank You
