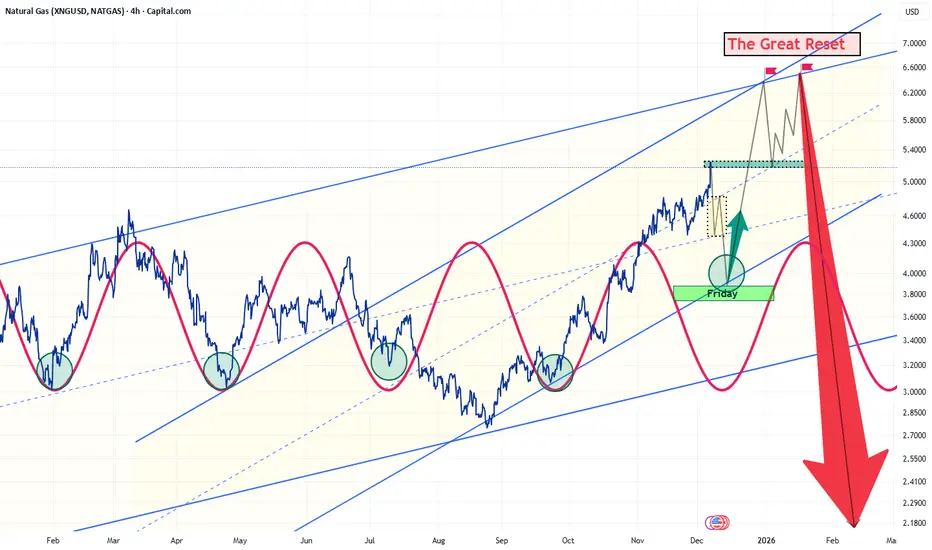
the Big Picture, and the next Friday weekly HammerFrom a technical perspective, Natural Gas is nearing a high-conviction inflection point. The weekly hammer that will be formed into Friday’s close (12.12.2025) indicates a potential shift in market structure following the optimal accumulation zone around 4.9. This configuration favors a sharp, impulsive rally over the next 2–3 weeks, with a likely target at the long-term channel resistance near 6.4. The emerging double-top formation suggests a setup for a notable momentum reversal.
On the macroeconomic side, the ongoing “Great Reset” is expected to exert downward pressure across major risk assets over the next six months. Volatility is rising, and global markets are entering a corrective phase.
Ng1!f
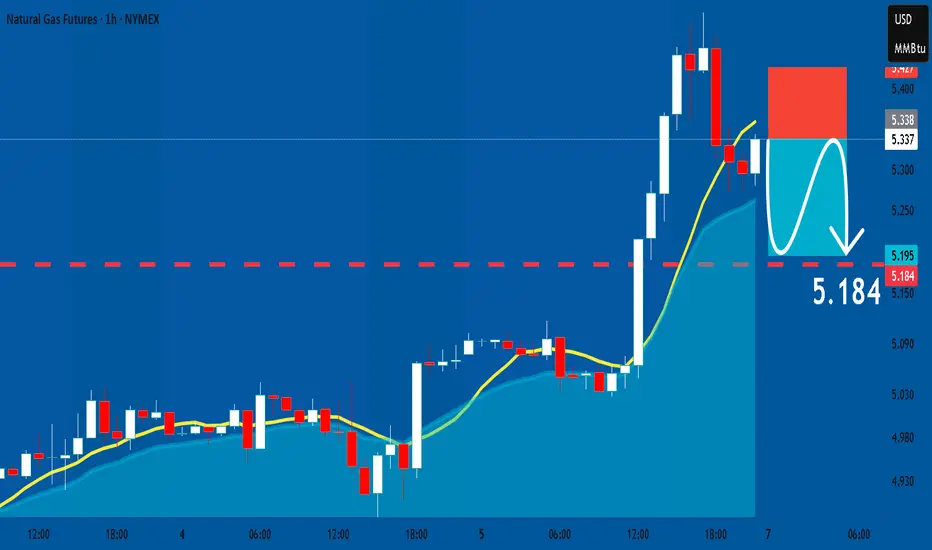
NATGAS: Short Signal with Entry/SL/TP
NATGAS
- Classic bearish formation
- Our team expects fall
SUGGESTED TRADE:
Swing Trade
Sell NATGAS
Entry Level - 5.338
Sl - 5.427
Tp - 5.184
Our Risk - 1%
Start protection of your profits from lower levels
Disclosure: I am part of Trade Nation's Influencer program and receive a monthly fee for using their TradingView charts in my analysis.
❤️ Please, support our work with like & comment! ❤️
NATURAL GAS broke parabolically and the rise won't stop here.Back in late August (see chart below), we gave a bold strong buy signal on Natural Gas (NG), right at the very bottom of its Higher Lows structure:
As you can see, it is well on its way to hitting our 6.400 Target as it rose parabolically.
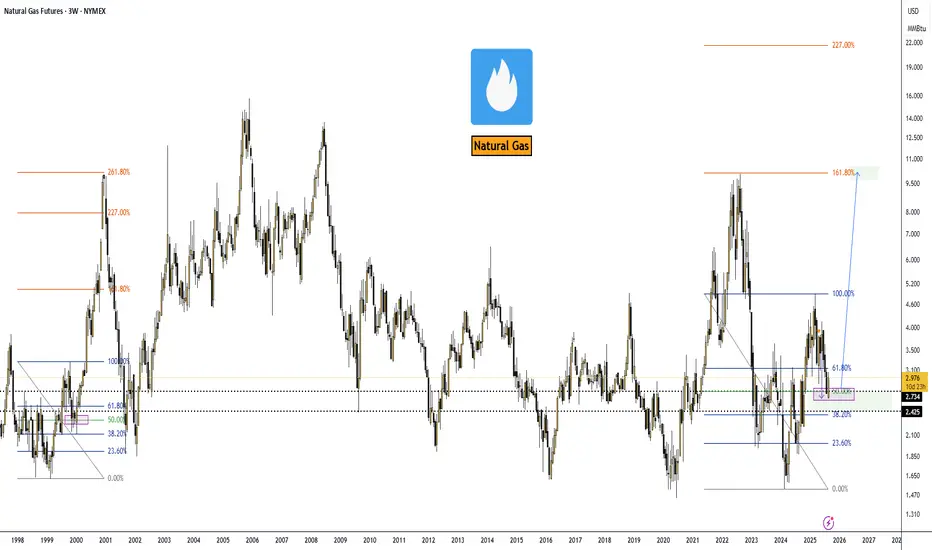
This time, we revisit NG's multi-year Cycles, a chart we first coined years ago that became quite popular in the energy sector. This is because we feel that this recent 3-month parabolic rise opens the way to an even higher, than anticipated before, Cycle Top.
The 1M RSI turning overbought (above 70.00) is the trigger and we believe that by that time Natural Gas could be as high as 8.000. Basically since 2000, it has only failed to price a Cycle Top without the 1M RSI hitting 70.00, once.
---
** Please LIKE 👍, FOLLOW ✅, SHARE 🙌 and COMMENT ✍ if you enjoy this idea! Also share your ideas and charts in the comments section below! This is best way to keep it relevant, support us, keep the content here free and allow the idea to reach as many people as possible. **
---
💸💸💸💸💸💸
👇 👇 👇 👇 👇 👇

NATGAS Under Pressure! SELL!
My dear friends,
My technical analysis for NATGAS is below:
The market is trading on 4.862 pivot level.
Bias - Bearish
Technical Indicators: Both Super Trend & Pivot HL indicate a highly probable Bearish continuation.
Target - 4.675
About Used Indicators:
A pivot point is a technical analysis indicator, or calculations, used to determine the overall trend of the market over different time frames.
Disclosure: I am part of Trade Nation's Influencer program and receive a monthly fee for using their TradingView charts in my analysis.
———————————
WISH YOU ALL LUCK

Hitting prior highs…Ok so I’m thinking we break this top as a fake out for bulls to get momentarily trapped. We will break the high earlier this month then bulls will pile in, price will pullback over the next day or two then we will continue our way toward $5 and above. Major move happened last week and I think there may be some refuel and exhaustion at the start of the week. I started a short to scalp but will be closing it immediately upon profit. Looking to pile in and rebuy when this contract retraces to 4.6ish.

NG1! SENDS CLEAR BEARISH SIGNALS|SHORT
NG1! SIGNAL
Trade Direction: short
Entry Level: 4.849
Target Level: 4.149
Stop Loss: 5.315
RISK PROFILE
Risk level: medium
Suggested risk: 1%
Timeframe: 1D
Disclosure: I am part of Trade Nation's Influencer program and receive a monthly fee for using their TradingView charts in my analysis.
✅LIKE AND COMMENT MY IDEAS✅

NATGAS Free Signal! Sell!
Hello,Traders!
NATGAS is reacting inside a major horizontal supply zone after sweeping local buy-side liquidity. With displacement shifting bearish, a move toward the discounted target zone below becomes likely.
--------------------
Stop Loss: 4.693$
Take Profit: 4.549$
Entry Level: 4.636$
Time Frame: 4H
--------------------
Sell!
Comment and subscribe to help us grow!
Check out other forecasts below too!
Disclosure: I am part of Trade Nation's Influencer program and receive a monthly fee for using their TradingView charts in my analysis.

NATGAS Set To Fall! SELL!
My dear followers,
I analysed this chart on NATGAS and concluded the following:
The market is trading on 4.577pivot level.
Bias - Bearish
Technical Indicators: Both Super Trend & Pivot HL indicate a highly probable Bearish continuation.
Target - 4.474
About Used Indicators:
A super-trend indicator is plotted on either above or below the closing price to signal a buy or sell. The indicator changes color, based on whether or not you should be buying. If the super-trend indicator moves below the closing price, the indicator turns green, and it signals an entry point or points to buy.
Disclosure: I am part of Trade Nation's Influencer program and receive a monthly fee for using their TradingView charts in my analysis.
———————————
WISH YOU ALL LUCK

Is This the Start of the Next Natural Gas Upswing?💨 Natural Gas (XNG/USD) — “Profit Pathway Setup” 🎯 Swing / Day Trade Edition
📊 Market Overview:
The Energies Market is heating up — and Natural Gas is showing its next potential boom move! After a confirmed Moving Average Breakout, bulls are sneaking back in. 🕵️♂️
This setup blends discipline + creativity, using the Thief-Trader layered entry method — designed to catch price action efficiently while minimizing emotional errors. ⚙️
⚔️ Trade Plan (Bullish Setup):
Entry Zones (Layered Buys):
🟩 3.500
🟩 3.600
🟩 3.700
(You can expand your buy layers depending on your own comfort and risk plan.)
Stop-Loss (Thief SL):
🧯 3.350 — just below the nearest lower-low candle wick.
💬 Dear Ladies & Gentlemen (Thief OG’s) — this SL is a personal style choice, not a fixed rule. Manage your risk your way.
Target (Profit Escape Zone):
🎯 4.100 — a strong resistance + overbought + trap + distribution zone.
💬 Reminder: I’m not forcing my TP; you’re the boss of your own bag — make your profits, then take them! 💰
📈 Why This Setup Works:
🧠 Technical Confirmation: MA breakout = bullish continuation in progress.
🎯 Layering Strategy: Multiple limit orders reduce average cost + improve flexibility.
🏗️ Structural Setup: Clear accumulation → breakout → markup pattern emerging.
🧩 Exit Logic: Resistance + trap-zone = high-probability exit zone for profit capture.
🌍 Related Assets to Watch (Correlation Check):
💹 NYMEX:NG1! — Natural Gas futures benchmark, strong global mirror.
AMEX:UNG — U.S. NatGas ETF; sentiment confirmation.
🛢️ BLACKBULL:WTI / BLACKBULL:BRENT — closely tied to energy flow; when oil strengthens, gas often follows.
⚡ TVC:DXY — dollar strength can inversely impact commodity demand.
💵 FX:EURUSD — macro correlation to risk appetite across energy & FX.
Keep eyes on these pairs — their momentum helps confirm or contradict your NatGas bias. 👀
📌 Key Takeaways:
✅ Trend Bias: Bullish
💪 Setup Type: Swing / Day Trade hybrid
🧮 Risk : Reward: Favorable above 1 : 3
⏳ Holding Window: Short-term → Mid-term (2 – 5 days typical)
🧭 Trade Management: Stick to your plan — don’t chase, layer smart.
⚠️ Pro Tip:
If price breaks below 3.350, it’s a signal to step aside — no hero moves. 🛑
Price structure > emotions. Stay patient, and let the plan do the heavy lifting. 🧘♂️
✨ “If you find value in my analysis, a 👍 and 🚀 boost is much appreciated — it helps me share more setups with the community!”
#NaturalGas #XNGUSD #EnergyTrading #SwingTrading #DayTrading #TechnicalAnalysis #BreakoutStrategy #CommodityTrading #ForexTrading #TradingIdeas #RiskManagement #MarketAnalysis #EnergyMarkets #TradingView #ChartAnalysis

NATGAS: Expecting Bearish Continuation! Here is Why:
Remember that we can not, and should not impose our will on the market but rather listen to its whims and make profit by following it. And thus shall be done today on the NATGAS pair which is likely to be pushed down by the bears so we will sell!
Disclosure: I am part of Trade Nation's Influencer program and receive a monthly fee for using their TradingView charts in my analysis.
❤️ Please, support our work with like & comment! ❤️

XNG/USD Bullish Retest Play | MA Support Holds🔥 XNG/USD (NATURAL GAS) - BULLISH TRADE OPPORTUNITY 🔥
Natural Gas is showing strength with a confirmed bullish structure! This idea outlines a potential day trade as price retests a key moving average support level.
📈 Trade Plan: Bullish
Idea: Long on any retest/dip, targeting a move towards the next significant resistance.
Rationale: Price action confirms a bullish bias, with the Moving Average acting as dynamic support.
🎯 Key Levels & Execution
✅ Entry Zone: Any price level is considered, but a retest of the MA support offers a favorable risk-reward. Be patient for your setup!
🛑 Stop Loss (Risk Management):
My Personal SL: 4.000
⚠️ IMPORTANT NOTE: This is MY stop loss based on MY risk tolerance and strategy. YOU MUST adjust your SL according to your own capital management rules. Trade at your own risk!
🎯 Take Profit Target: 4.400
This level aligns with a strong resistance zone, overbought signals, and a potential correction area. Secure your profits accordingly!
🔍 Related Pairs & Market Correlations
To get a fuller picture of the Energies market, keep an eye on these key assets:
TVC:USOIL / BLACKBULL:WTI (Crude Oil): 💡 The "big brother" of energy. Often, strength in Crude can pull Natural Gas higher, though the correlation isn't always perfect.
ICMARKETS:XBRUSD (Brent Oil): 🌍 The international energy benchmark. Similar to WTI, its trends can influence sentiment across the entire energy complex.
TVC:DXY (U.S. Dollar Index): 💵 KEY CORRELATION! Since XNG is quoted against the USD (XNG/USD), a weaker Dollar typically bullish for Natural Gas. A stronger Dollar can act as a headwind. Watch the DXY closely!
AMEX:UNG (United States Natural Gas Fund ETF): 📊 A popular ETF that tracks Natural Gas prices. Good for confirming momentum and retail sentiment.
✅ Key Takeaway: A weakening TVC:DXY and strength in TVC:USOIL could provide the perfect tailwinds for this XNG/USD bullish move!
👍 Found this helpful? Give it a LIKE & FOLLOW for more daily trade ideas and insights! 🚀
💬 Comment below with your take on Natural Gas! Let's discuss the setup.

A lot happening…Greater uptrend channel still in tact. New downtrend channel in formation but will probably be negated due to the shifting 4 hour timeframe. I think this contract will settle around 4.5 at expiration and the next contract (Jan) will drop like a rock on the switch. I am buying shorts for Jan 4.7 and above. And buying longs for this contract anything below 4.3


Natural gas Near expiration, the spread between spots and future is about 1000 pounds, it may goes to ranges between 3.5-3 7. But near target is about 3 95

NATGAS Bearish Breakout! Sell!
Hello,Traders!
NATGAS broke down from the bearish wedge, signalling displacement and a shift in order flow. After sweeping internal liquidity, price is expected to expand lower toward the marked target demand zone. Time Frame 4H.
Sell!
Comment and subscribe to help us grow!
Check out other forecasts below too!
Disclosure: I am part of Trade Nation's Influencer program and receive a monthly fee for using their TradingView charts in my analysis.

Natural Gas Market Outlook — September 01, 2025.VANTAGE:NG #NaturalGas #NatGas (NYMEX:NG1!) 🔵 Natural Gas Market Outlook — September 01, 2025.
Alright, here’s the skinny on NatGas. Back on April 28, 2025, I was calling for a dip into the $2.74 zone—and guess what? We tagged it right on schedule.
Now the game flips: I’m hunting long entries with the first serious target sitting at $10.00.
Could we overshoot? Absolutely. If momentum really gets cooking, the Fibo 227% extension lines up at roughly $21.00. But let’s not get greedy yet—$10 stays the main milestone for the next big leg.
Macro Drivers
➖ Exports: LNG shipments are the elephant in the room. Europe’s still thirsty, Asia’s paying up, and U.S. cargos are cashing in.
➖ Production: Flat. Shale guys aren’t rushing to flood the market unless we break above $3.20+.
➖ Geopolitics: Russia’s LNG rerouting and Middle East jitters keep a bid under global gas.
➖ Utilities & Consumers: Domestic demand is softer thanks to renewables transitions, but that’s a sideshow compared to export flows.
Big Picture
EIA pegs Henry Hub at $3.60 in 2025 and $4.30 in 2026, but frankly, that’s conservative. With demand from data centers, electrification, and global LNG growth, upside is more likely than not.
Trade View
➡️ I’m treating $2.74 as the cycle low. Any dips near that level look like golden tickets for long positioning into 2026. First pit stop: $10.00. If bulls get rowdy, keep an eye on $21.00 as the stretch target.
➡️ Bottom line: NatGas just gave us the reset we were waiting for. From here, risk/reward favors the long side. Strap in—it’s gonna be a volatile ride, but that’s where the money gets made.
Gold | Oil | Dollar | Silver | Natural Gas Price ForecastGold | Oil | Dollar | Silver | Natural Gas Price Forecast
NYMEX:NG1! NYMEX:CL1! COMEX:SI1! COMEX:GC1!

NATGAS Set To Grow! BUY!
My dear friends,
Please, find my technical outlook for NATGAS below:
The price is coiling around a solid key level - 4.324
Bias - Bullish
Technical Indicators: Pivot Points Low anticipates a potential price reversal.
Super trend shows a clear buy, giving a perfect indicators' convergence.
Goal - 4.368
Safe Stop Loss - 4.295
About Used Indicators:
The pivot point itself is simply the average of the high, low and closing prices from the previous trading day.
Disclosure: I am part of Trade Nation's Influencer program and receive a monthly fee for using their TradingView charts in my analysis.
———————————
WISH YOU ALL LUCK

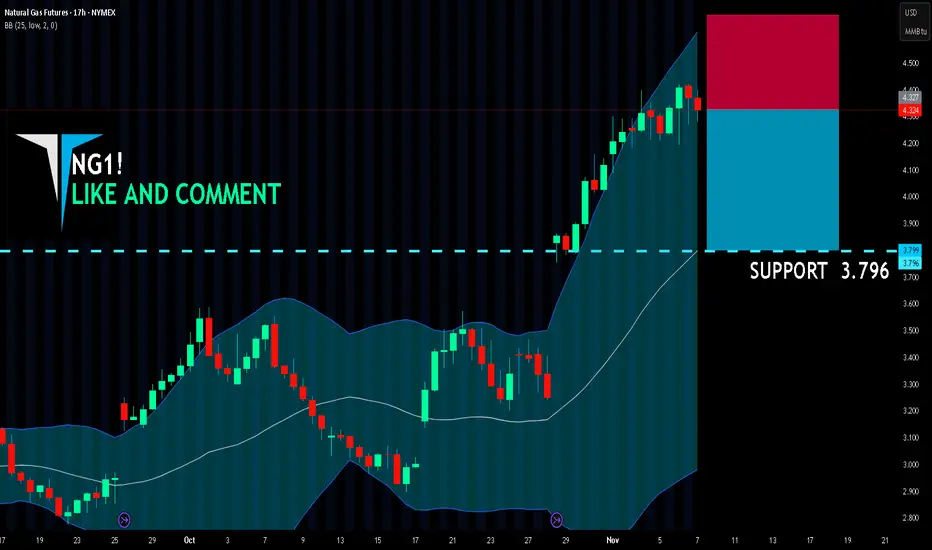
NG1! BEST PLACE TO SELL FROM|SHORT
NG1! SIGNAL
Trade Direction: short
Entry Level: 4.327
Target Level: 3.796
Stop Loss: 4.678
RISK PROFILE
Risk level: medium
Suggested risk: 1%
Timeframe: 17h
Disclosure: I am part of Trade Nation's Influencer program and receive a monthly fee for using their TradingView charts in my analysis.
✅LIKE AND COMMENT MY IDEAS✅
NATGAS Will Keep Growing! Buy!
Hello,Traders!
NATGAS Price has broken out above the horizontal demand area with strong momentum, confirming bullish order flow. A clean displacement shows potential continuation toward the 4.50$ target zone. Time Frame 5H.
Buy!
Comment and subscribe to help us grow!
Check out other forecasts below too!
Disclosure: I am part of Trade Nation's Influencer program and receive a monthly fee for using their TradingView charts in my analysis.

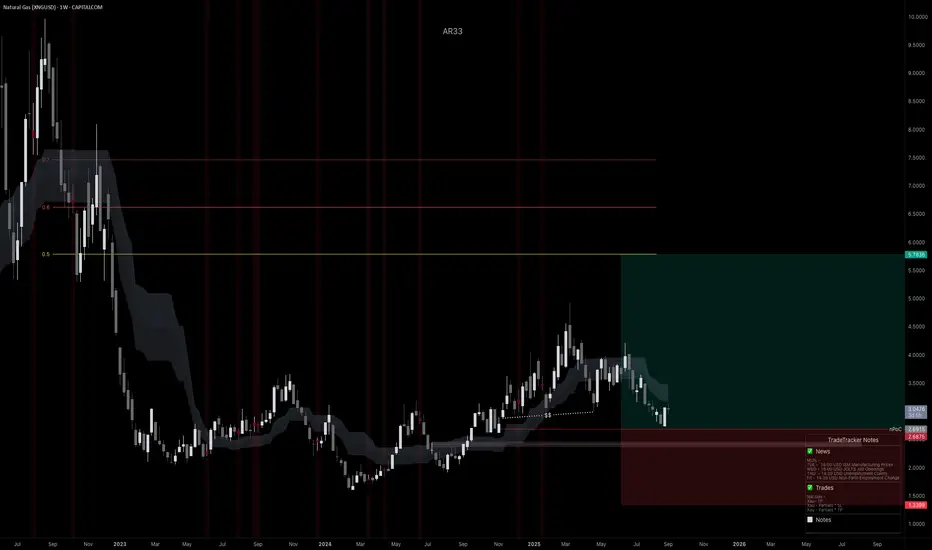
XNGUSD, Accumulation to Expansion? Weekly Long Into Winter RiskI’ve initiated a long on Natural Gas from weekly structure. Price has rotated inside this area since ’23 and is now reacting at a confluence of trendline support + prior demand. The plan is to hold into Q4, when seasonality (heating demand + potential hurricane/LNG disruptions) often provides upside tailwinds. Risk is defined on the weekly chart; I’ll manage around swings and let the position work.
Technicals (Weekly)
• Range base reclaimed: Price is bouncing from the same 2023–2024 accumulation zone (roughly 2.5–3.0).
• Multi-touch trendline support: Current candle is reacting at the rising base trendline; wicks show responsive buying.
• Structure targets: First objective is a move back into mid-range supply; extension aims toward the upper band shown on the chart.
Fundamentals Supporting Long Bias
• Seasonality: Q4 typically brings rising Heating Degree Days across the Northern Hemisphere; winter risk premia often get priced ahead of the draw season.
• LNG pull: Ongoing ramp in global LNG demand + incremental U.S. export capacity tends to tighten the domestic balance on cold forecasts or unplanned outages elsewhere.
• Supply discipline: Gas rig counts have lagged after the 2024 price slump; that slower supply response can tighten later-year balances if weather cooperates.
• Weather & Gulf risk: Peak hurricane season can interrupt Gulf production and processing, periodically supporting price.
• Europe draw season: As EU storage transitions from injection to draws, import needs rise, keeping a bid under seaborne gas.
Trade Plan:
• Entry: From weekly support (see chart).
• Management: Trail below fresh higher lows on the daily; take partials at fib/structure levels; let a runner target the upper band if momentum broadens.
What Breaks the Thesis
• A persistently warm Q4, outsized storage overhang into winter, major LNG outages/delays, or a renewed surge in production that swamps demand.
Note: Please remember to adjust this trade idea according to your individual trading conditions, including position size, broker-specific price variations, and any relevant external factors. Every trader’s situation is unique, so it’s crucial to tailor your approach to your own risk tolerance and market environment.
Gold | Oil | Dollar | Silver | Natural Gas Price ForecastGold | Oil | Dollar | Silver | Natural Gas Price Forecast
NYMEX:NG1! COMEX:GC1! COMEX:SI1! AMEX:UNG

NATGAS CORRECTION AHEAD|SHORT|
✅NATGAS after rallying into a high-timeframe supply level, price shows signs of exhaustion and potential mitigation before retracement. Liquidity sits below the recent swing lows. Time Frame 5H.
SHORT🔥
✅Like and subscribe to never miss a new idea!✅
