NZD/USD Gave Fake Breakout , Long Setup Valid To Get 200 Pips !Here is my 4H Chart on NZD/USD , We Have A Fake Breakout and then the price Back above my old support and we have a very good bullish Price Action on 2 And 4 Hours T.F Also the price playing very good around my support and i`m waiting the price to retest the broken area and giving a good bullish price action on smaller time frames to can get a confirmation to enter , So i see it`s a good chance to buy this pair if it go down a little to retest the broken area and then we can buy it and targeting 100 to 150 pips . and if we have a daily closure again below my old support then this idea will not be valid anymore .
Reasons To Enter :
1- Perfect Breakout .
2- Clear bullish Price Action .
3- Bigger T.F Giving Good bullish P.A .
4 - Perfect 15 Mins Closure .
5- The Price Respect The support Again .
Nzdusdupdate

NZD/USD Holds Firm, More Upside Moves On The Way?Market Analysis: NZD/USD Holds Firm, More Upside Moves On The Way?
NZD/USD is also rising and might aim for more gains above 0.5840.
Important Takeaways for NZD USD Analysis Today
- NZD/USD is consolidating gains above the 0.5800 pivot level.
- There is a major bullish trend line forming with support at 0.5815 on the hourly chart of NZD/USD.
NZD/USD Technical Analysis
On the hourly chart of NZD/USD, the pair started a fresh increase from 0.5755. The New Zealand Dollar broke the 0.5790 barrier to start the recent rally against the US Dollar.
The pair settled above 0.5800 and the 50-hour simple moving average. It tested 0.5840 and is currently consolidating gains. There was a minor pullback below 0.5825 and the 23.6% Fib retracement level of the upward move from the 0.5754 swing low to the 0.5842 high.
The NZD/USD chart suggests that the RSI is stable above 50. On the upside, the pair might struggle near 0.5840. The next major resistance is near the 0.5880 level. A clear move above 0.5880 might even push the pair toward 0.5920. Any more gains might clear the path for a move toward the 0.6000 handle in the coming days.
On the downside, immediate support is near the 0.5815 level and a major bullish trend line. The first key zone for the bulls sits at 0.5800 and the 50% Fib retracement. The next key level is 0.5790. If there is a downside break below 0.5790, the pair might slide toward 0.5775. Any more losses could lead NZD/USD into a bearish zone to 0.5755.
This article represents the opinion of the Companies operating under the FXOpen brand only. It is not to be construed as an offer, solicitation, or recommendation with respect to products and services provided by the Companies operating under the FXOpen brand, nor is it to be considered financial advice.

NZD/USD Breakout Done , Long Setup Valid To Get 150 Pips !Here is my 4H Chart on NZD /USD , We Have A Fake Breakout and then the price Back Above my old Support and we have a very good Bullish Price Action on 1 And 2 And 4 Hours T.F Also the price playing very good around my Support and i entered a buy trade after 4H Closure And i`m waiting the price to retest the broken area to can get a confirmation to Add another entry , So i see it`s a good chance to Buy this pair if it go Down a little to retest the broken area and then we can Buy it and targeting 100 to 150 pips . and if we have a daily closure again Below my Support then this idea will not be valid anymore .
Reasons To Enter :
1- Perfect Breakout .
2- Clear Bullish Price Action .
3- Bigger T.F Giving Good Bullish P.A .
4 - Perfect 4H Closure .
5- The Price Respect The Support Again .

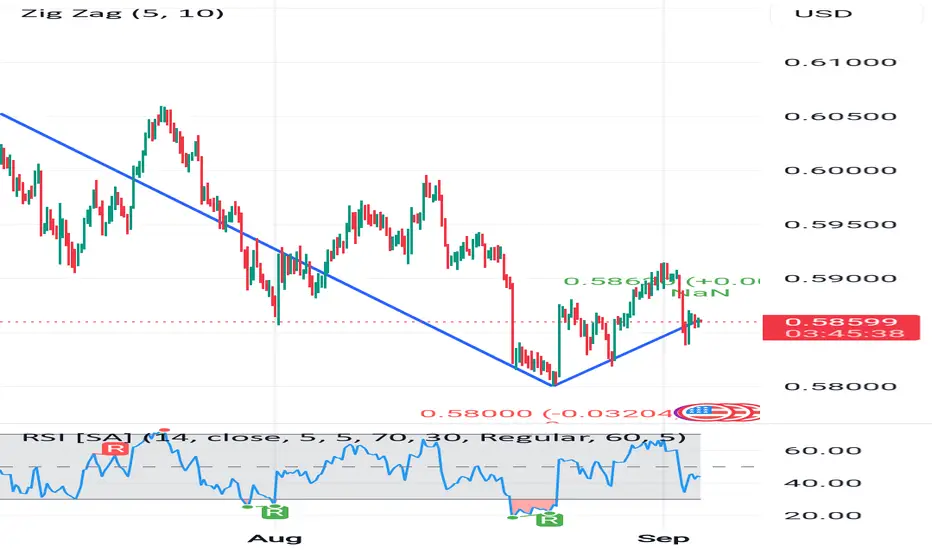
NZD/USD 4H Chart Analysis – Key Levels and RSI InsightsThe NZD/USD pair is currently trading around 0.5861 after recently bouncing from the 0.5800 support zone. On the 4H chart, price action shows a strong rejection at the recent low, followed by a short-term bullish correction.
🔑 Key Technical Levels
Support Zone: 0.5800 – Strong buying pressure observed here.
Resistance Zone: 0.5900 – Price failed to break this level in the last attempt.
Current Price: 0.5861
📉 Trend Analysis
The ZigZag indicator highlights a dominant downtrend from above 0.6000, followed by a corrective move. The price is now consolidating between 0.5800 and 0.5900, suggesting indecision in the market.
📊 RSI Indicator (14)
The RSI is hovering around the 40–50 range, showing neutral momentum. Previously, RSI touched oversold levels near 30, sparking the recent bounce. As of now, there’s no clear overbought or oversold signal, meaning traders should watch closely for confirmation.
📌 Trading Plan
Bullish Scenario: A breakout above 0.5900 could open the path toward 0.5950 – 0.6000.
Bearish Scenario: If price breaks below 0.5800, the next target could be 0.5750.
✅ Conclusion
NZD/USD is in a consolidation phase after a strong downtrend. Traders should keep an eye on the 0.5800 support and 0.5900 resistance levels for the next directional move. RSI suggests neutrality, so waiting for a breakout or confirmation is wise before entering new trades.
NZD/USD Rises by ~1.4% in 2 DaysNZD/USD Rises by ~1.4% in 2 Days
As the NZD/USD chart shows, the New Zealand dollar was trading around 0.5820 against the US dollar on Wednesday, but today it has climbed above 0.5895 – an impressive gain of approximately 1.4% in just two days.
The rise in NZD/USD is being driven both by the general weakening of the US dollar ahead of the Federal Reserve’s expected September rate cut, and by strengthening demand for the “kiwi”. As Reuters notes:
→ the New Zealand dollar is often used as a substitute for the yuan because of close trade relations with China;
→ meanwhile, the yuan is strengthening, with Chinese policymakers recommending support for the currency given its low valuation and the need to facilitate trade negotiations with the US.
Technical Analysis of the NZD/USD Chart
It’s worth paying attention to the unusual trading activity (marked by the arrow) and its context:
→ it was the lowest level in more than four months;
→ after a sharp decline, the price stabilised near the lower boundary of the channel;
→ trading was fairly active, and although the price was drifting lower, it failed to generate strong bearish momentum.
It is possible that so-called Smart Money was attracted by the undervalued asset, preventing further declines through buy orders and accumulating long positions. If so, from this perspective it is notable that:
→ the 0.5820 level acted as support on Wednesday – the price rebounded sharply;
→ yesterday NZD/USD moved into the upper half of the channel, breaking through the 0.5875 resistance.
This week’s price rise has formed a trajectory marked by purple lines. NZD/USD might be heading towards the upper boundary of the ascending channel, with the following resistance levels standing out along the way:
→ the former support at 0.5910;
→ the 50% Fibonacci retracement level from the A→B move.
An attempt to break through this resistance zone could result in a pullback towards the lower boundary of the purple channel.
This article represents the opinion of the Companies operating under the FXOpen brand only. It is not to be construed as an offer, solicitation, or recommendation with respect to products and services provided by the Companies operating under the FXOpen brand, nor is it to be considered financial advice.

Market Analysis: NZD/USD Starts Recovery, Key Hurdles AheadMarket Analysis: NZD/USD Starts Recovery, Key Hurdles Ahead
NZD/USD is also rising and could aim for a move above 0.5900 in the short term.
Important Takeaways for NZD/USD Analysis Today
- NZD/USD is slowly moving higher above 0.5830.
- There is a major bearish trend line forming with resistance at 0.5870 on the hourly chart of NZD/USD.
NZD/USD Technical Analysis
On the hourly chart of NZD/USD, the pair followed AUD/USD. The New Zealand Dollar formed a base above the 0.5800 level and started a recovery wave against the US Dollar.
The pair climbed above the 50-hour simple moving average and 0.5830. There was a close above the 23.6% Fib retracement level of the downward move from the 0.5990 swing high to the 0.5830 low.
However, the bears are now active near the 0.5870 zone and a major bearish trend line. The NZD/USD chart suggests that the RSI is back above 60, signaling a positive bias. On the upside, the pair is facing resistance near 0.5870.
The next major hurdle for buyers could be near the 50% Fib retracement at 0.5895. A clear move above 0.5895 might even push the pair toward 0.5910. Any more gains might clear the path for a move toward the 0.5945 pivot zone in the coming sessions.
On the downside, there is support forming near the 0.5830 zone. If there is a downside break below 0.5830, the pair might slide toward 0.5800. Any more losses could lead NZD/USD into a bearish zone to 0.5740.
This article represents the opinion of the Companies operating under the FXOpen brand only. It is not to be construed as an offer, solicitation, or recommendation with respect to products and services provided by the Companies operating under the FXOpen brand, nor is it to be considered financial advice.

NZD/USD Holds Near Four-Month LowNZD/USD Holds Near Four-Month Low
As today’s NZD/USD chart shows, the pair is trading near a four-month low following a sharp decline. The drop occurred yesterday after the Reserve Bank of New Zealand cut the official cash rate by 25 basis points to a three-year low of 3.0% and indicated that the rate could fall further to 2.55% by May 2026.
According to Trading Economics:
- Analysts now expect at least two additional rate cuts before the end of the year;
- There is a risk of deeper cuts depending on incoming economic data.
New Zealand’s exports are also under pressure, particularly due to the 15% US tariffs that came into effect earlier this month, threatening to undermine the country’s competitiveness in key markets. According to Reuters, Citi analysts expect GDP to contract in the second quarter, raising the risk of a recession in New Zealand.
Technical Analysis of the NZD/USD 4-Hour Chart
NZD/USD price action since early July has formed a downward channel (marked in red), reflecting a bearish outlook. Key observations:
→ Yesterday’s drop was sharp, with a very long candle closing near its lows – a bearish signal;
→ However, the lower boundary of the channel acted as strong support, holding back further pressure.
Looking at the broader context:
→ The B→C recovery reached approximately the 0.618 Fibonacci retracement level after the A→B impulse;
→ The D→E rebound from the channel’s median was modest, signalling weak demand.
Given the strength of the channel’s lower boundary and the oversold condition (as shown by the RSI), bulls have some grounds to expect a potential rebound. In that case, NZD/USD could face resistance from the QL line, which divides the descending channel into two quarters.
Reaching the resistance zone formed by the channel median and the 0.589 level (previously acted as support during the inverse head and shoulders pattern - highlighted with arrows) could be difficult in the near term under current conditions.
This article represents the opinion of the Companies operating under the FXOpen brand only. It is not to be construed as an offer, solicitation, or recommendation with respect to products and services provided by the Companies operating under the FXOpen brand, nor is it to be considered financial advice.

Market Analysis: NZD/USD Much Higher—Uptrend Shows StrengthMarket Analysis: NZD/USD Much Higher—Uptrend Shows Strength
NZD/USD is also rising and might aim for more gains above 0.5970.
Important Takeaways for NZD/USD Analysis Today
- NZD/USD is consolidating gains above the 0.5940 zone.
- There is a short-term declining channel forming with resistance at 0.5960 on the hourly chart of NZD/USD.
NZD/USD Technical Analysis
On the hourly chart of NZD/USD on FXOpen, the pair started a steady increase from the 0.5880 zone. The New Zealand Dollar broke the 0.5925 resistance to start the recent increase against the US Dollar.
The pair settled above 0.5940 and the 50-hour simple moving average. It tested the 0.5970 zone and is currently consolidating gains. There was a move below the 23.6% Fib retracement level of the upward move from the 0.5881 swing low to the 0.5971 high.
The NZD/USD chart suggests that the RSI is stable above 50. On the upside, the pair might struggle near 0.5960. There is also a short-term declining channel forming with resistance at 0.5960.
The next major resistance is near the 0.5970 level. A clear move above the 0.5970 level might even push the pair toward the 0.6000 level. Any more gains might clear the path for a move toward the 0.6020 resistance zone in the coming days.
On the downside, immediate support is near the 0.5940 level. The first key support is near the 0.5925 level. It is close to the 50% Fib retracement level of the upward move from the 0.5881 swing low to the 0.5971 high.
The next major support is near the 0.5900 level. If there is a downside break below it, the pair might slide toward 0.5880. Any more losses could lead NZD/USD to 0.5820.
This article represents the opinion of the Companies operating under the FXOpen brand only. It is not to be construed as an offer, solicitation, or recommendation with respect to products and services provided by the Companies operating under the FXOpen brand, nor is it to be considered financial advice.

Market Analysis: NZD/USD Climbs as Dollar WeakensMarket Analysis: NZD/USD Climbs as Dollar Weakens
NZD/USD is also rising and might aim for more gains above 0.6000.
Important Takeaways for NZD/USD Analysis Today
- NZD/USD is consolidating gains above the 0.5980 zone.
- There was a break above a major bearish trend line with resistance at 0.5980 on the hourly chart of NZD/USD.
NZD/USD Technical Analysis
On the hourly chart of NZD/USD at FXOpen, the pair started a steady increase from the 0.5910 zone. The New Zealand Dollar broke the 0.5940 resistance to start the recent increase against the US Dollar.
There was a break above a major bearish trend line with resistance at 0.5980. The pair settled above 0.5980 and the 50-hour simple moving average. It tested the 0.6010 zone and is currently consolidating gains.
The NZD/USD chart suggests that the RSI is stable above 60. On the upside, the pair might struggle near 0.6010. The next major resistance is near the 0.6020 level.
A clear move above the 0.6020 level might even push the pair toward the 0.6050 level. Any more gains might clear the path for a move toward the 0.6120 resistance zone in the coming days.
On the downside, immediate support is near the 0.5990 level. It is close to the 23.6% Fib retracement level of the upward move from the 0.5941 swing low to the 0.6008 high.
The first key support is near the 0.5975 level. It is close to the 50% Fib retracement level. The next major support is near the 0.5940 level. If there is a downside break below the 0.5940 support, the pair might slide toward 0.5910. Any more losses could lead NZD/USD in a bearish zone to 0.5850.
This article represents the opinion of the Companies operating under the FXOpen brand only. It is not to be construed as an offer, solicitation, or recommendation with respect to products and services provided by the Companies operating under the FXOpen brand, nor is it to be considered financial advice.

NZD/USD H&S Reversal Pattern Clear,Short Setup To Get 150 Pips !Here is my opinion On NZD/USD On 4H T.F , If we checked the chart we will see that we have a very strong Historical res that forced the price many times to respect it and stay below it and now we have another good confirmation , we have a perfect reversal pattern and we have a clear closure below our neckline so the pattern already confirmed , i`m waiting the price to go up a little to retest my broken neckline and then we can enter a sell trade . only 1 case i will avoid this idea , if we have a daily closure agin above my res with clear closure .

Market Analysis: NZD/USD SlipsMarket Analysis: NZD/USD Slips
NZD/USD is struggling and might decline below the 0.5980 level.
Important Takeaways for NZD/USD Analysis Today
- NZD/USD is consolidating above the 0.5980 support.
- There is a connecting bearish trend line forming with resistance at 0.6010 on the hourly chart of NZD/USD at FXOpen.
NZD/USD Technical Analysis
On the hourly chart of NZD/USD at FXOpen, the pair also followed AUD/USD. The New Zealand Dollar struggled above 0.6100 and started a fresh decline against the US Dollar.
There was a move below the 0.6050 and 0.6020 support levels. A low was formed at 0.5978 and the pair is now consolidating losses below the 50-hour simple moving average. The NZD/USD chart suggests that the RSI is back below 50 signalling a bearish bias.
On the upside, the pair is facing resistance near the 23.6% Fib retracement level of the downward move from the 0.6120 swing high to the 0.5978 low. There is also a connecting bearish trend line forming with resistance at 0.6010.
The next major resistance is near the 0.6065 level or the 61.8% Fib retracement level. A clear move above the 0.6065 level might even push the pair toward the 0.6120 level. Any more gains might clear the path for a move toward the 0.6150 resistance zone in the coming days.
On the downside, there is a support forming near the 0.5980 zone. If there is a downside break below 0.5980, the pair might slide toward 0.5940. Any more losses could lead NZD/USD in a bearish zone to 0.5910.
This article represents the opinion of the Companies operating under the FXOpen brand only. It is not to be construed as an offer, solicitation, or recommendation with respect to products and services provided by the Companies operating under the FXOpen brand, nor is it to be considered financial advice.

NZD/USD Shows Bullish Hints, Can Gains Be Sustained?Market Analysis: NZD/USD Shows Bullish Hints, Can Gains Be Sustained?
NZD/USD is also rising and might aim for more gains above 0.6040.
Important Takeaways for NZD/USD Analysis Today
- NZD/USD is consolidating gains above the 0.6000 zone.
- There was a break above a major bearish trend line with resistance at 0.5970 on the hourly chart of NZD/USD at FXOpen.
NZD/USD Technical Analysis
On the hourly chart of NZD/USD at FXOpen, the pair started a steady increase from the 0.5880 zone. The New Zealand Dollar broke the 0.5920 resistance to start the recent increase against the US Dollar.
There was a break above a major bearish trend line with resistance at 0.5970. The pair settled above 0.5960 and the 50-hour simple moving average. It tested the 0.6040 zone and is currently consolidating gains.
The pair tested the 23.6% Fib retracement level of the upward move from the 0.5882 swing low to the 0.6040 high. However, the bulls are active above the 0.6000 level.
The NZD/USD chart suggests that the RSI is stable near 60. On the upside, the pair might struggle near 0.6040. The next major resistance is near the 0.6090 level.
A clear move above the 0.6090 level might even push the pair toward 0.6120. Any more gains might clear the path for a move toward the 0.6200 resistance zone in the coming days.
On the downside, immediate support is near the 0.5980 level. The first key support is near 0.5960. It is close to the 50% Fib retracement level.
The next major support is near 0.5920. If there is a downside break below the 0.5920 support, the pair might slide toward 0.5880. Any more losses could lead NZD/USD in a bearish zone to 0.5850.
This article represents the opinion of the Companies operating under the FXOpen brand only. It is not to be construed as an offer, solicitation, or recommendation with respect to products and services provided by the Companies operating under the FXOpen brand, nor is it to be considered financial advice.

NZD/USD Aims Steady IncreaseNZD/USD Aims Steady Increase
NZD/USD is also rising and might aim for more gains above 0.6080.
Important Takeaways for NZD USD Analysis Today
- NZD/USD is consolidating gains above the 0.6030 zone.
- There is a key bullish trend line forming with support at 0.6030 on the hourly chart of NZD/USD at FXOpen.
NZD/USD Technical Analysis
On the hourly chart of NZD/USD on FXOpen, the pair started a steady increase from the 0.5990 zone. The New Zealand Dollar broke the 0.6020 resistance to start the recent increase against the US Dollar.
The pair settled above 0.6030 and the 50-hour simple moving average. It tested the 0.6065 zone and is currently consolidating gains. The pair corrected lower below the 0.6050 level and the 23.6% Fib retracement level of the upward move from the 0.6006 swing low to the 0.6064 high.
However, the bulls are active above the 0.6030 level. The NZD/USD chartsuggests that the RSI is stable near 50. On the upside, the pair might struggle near 0.6065. The next major resistance is near the 0.6080 level.
A clear move above the 0.6080 level might even push the pair toward the 0.6120 level. Any more gains might clear the path for a move toward the 0.6200 resistance zone in the coming days.
On the downside, immediate support is near the 0.6030 level. There is also a key bullish trend line forming with support at 0.6030. It is close to the 61.8% Fib retracement level of the upward move from the 0.6006 swing low to the 0.6064 high.
The first key support is near the 0.6005 level. The next major support is near the 0.5990 level. If there is a downside break below the 0.5990 support, the pair might slide toward the 0.5970 support. Any more losses could lead NZD/USD in a bearish zone to 0.5950.
This article represents the opinion of the Companies operating under the FXOpen brand only. It is not to be construed as an offer, solicitation, or recommendation with respect to products and services provided by the Companies operating under the FXOpen brand, nor is it to be considered financial advice.
Market Analysis: NZD/USD Ready to Climb AgainMarket Analysis: NZD/USD Ready to Climb Again
NZD/USD is also rising and could aim for a move above the 0.5945 resistance.
Important Takeaways for NZD/USD Analysis Today
- NZD/USD is consolidating above the 0.5915 support.
- There was a break above a connecting bearish trend line with resistance at 0.5910 on the hourly chart of NZD/USD at FXOpen.
NZD/USD Technical Analysis
On the hourly chart of NZD/USD on FXOpen, the pair also followed AUD/USD. The New Zealand Dollar formed a base above the 0.5900 level and started a decent increase against the US Dollar.
The pair climbed above the 0.5980 resistance. It tested the 0.6020 resistance before there was a pullback. The recent low was formed at 0.58704 and the pair is again rising above the 50-hour simple moving average.
There was a break above a connecting bearish trend line with resistance at 0.5910. The pair cleared the 0.5915 resistance and the 23.6% Fib retracement level of the downward move from the 0.6022 swing high to the 0.5870 low.
The NZD/USD chart suggests that the RSI is back above 50 signaling a positive bias. On the upside, the pair is facing resistance near the 50% Fib retracement level of the downward move from the 0.6022 swing high to the 0.5870 low at 0.5945.
The next major resistance is near the 0.5985 level. A clear move above the 0.5985 level might even push the pair toward the 0.6020 level. Any more gains might clear the path for a move toward the 0.6050 resistance zone in the coming days.
On the downside, there is a support forming near the 0.5915 zone. If there is a downside break below the 0.5915 support, the pair might slide toward 0.5870. Any more losses could lead NZD/USD in a bearish zone to 0.5810.
This article represents the opinion of the Companies operating under the FXOpen brand only. It is not to be construed as an offer, solicitation, or recommendation with respect to products and services provided by the Companies operating under the FXOpen brand, nor is it to be considered financial advice.

Market Analysis: NZD/USD DipsMarket Analysis: NZD/USD Dips
NZD/USD is trimming gains and struggling to stay above the 0.5945 pivot zone.
Important Takeaways for NZD/USD Analysis Today
- NZD/USD is declining from the 0.6030 resistance zone.
- There is a major bearish trend line forming with resistance near 0.5970 on the hourly chart of NZD/USD at FXOpen.
NZD/USD Technical Analysis
On the hourly chart of NZD/USD on FXOpen, the pair attempted another wave above the 0.6000 zone but failed. The New Zealand Dollar started another downward move from 0.6000 and dipped below 0.5980 against the US Dollar.
The pair settled below the 0.5970 level and the 50-hour simple moving average. It tested the 0.5930 zone and is currently consolidating losses near the 50% Fib retracement level of the downward move from the 0.6000 swing high to the 0.5928 low.
The NZD/USD chart suggests that the RSI is now well below 50 and signaling more downsides. On the downside, there is major support forming near 0.5945.
The next major support is near the 0.5920 level. If there is a downside break below the 0.5920 support, the pair might slide toward the 0.5880 support. Any more losses could lead NZD/USD in a bearish zone to 0.5840.
On the upside, the pair might struggle near 0.5970 and the 61.8% Fib retracement level of the downward move from the 0.6000 swing high to the 0.5928 low.
There is also a major bearish trend line forming with resistance near 0.5970. The next major resistance is near the 0.5985 level. A clear move above the 0.5985 level might even push the pair toward the 0.6000 level. Any more gains might clear the path for a move toward the 0.6030 resistance zone in the coming days.
This article represents the opinion of the Companies operating under the FXOpen brand only. It is not to be construed as an offer, solicitation, or recommendation with respect to products and services provided by the Companies operating under the FXOpen brand, nor is it to be considered financial advice.
NZD/USD Broke The Res , Good Chance To Buy To Get 200 Pips !Here is my NZD/USD Long Setup , we have a daily closure above the res and also it`s a very good support and we can trust it , we can enter a buy trade if the price go back to retest the broken res , and if we have a good bullish price action then we can enter a buy trade and targeting 200 pips .
This Is An Educational + Analytic Content That Will Teach Why And How To Enter A Trade
Make Sure You Watch The Price Action Closely In Each Analysis As This Is A Very Important Part Of Our Method
Disclaimer : This Analysis Can Change At Anytime Without Notice And It Is Only For The Purpose Of Assisting Traders To Make Independent Investments Decisions.

NZD/USD Giving Amazing Bearish P.A , Is It A Good Area To Sell ?Here is my opinion on NZD/USD , If you check the chart you will see that the price moved to upside without any correction and the price didn`t respect this old res yesterday but today the price back again below the res and respect it 100% and now the price closed below it with amazing bearish candle so i will sell this pair and targeting at least 100 pips.
This Is An Educational + Analytic Content That Will Teach Why And How To Enter A Trade
Make Sure You Watch The Price Action Closely In Each Analysis As This Is A Very Important Part Of Our Method
Disclaimer : This Analysis Can Change At Anytime Without Notice And It Is Only For The Purpose Of Assisting Traders To Make Independent Investments Decisions.

NZD/USD Analysis & Probability AssessmentTimeframes Analyzed:
15-Minute (M15)
30-Minute (M30)
1-Hour (H1)
4-Hour (H4)
Daily (D1)
📊 Market Structure Update
✅ Bearish Trend Dominance: The overall structure remains bearish, with multiple Breaks of Structure (BOS) confirming the downtrend.
✅ Current Price Zone (~0.5600 - 0.5620): Price is testing the discount zone, which is a key demand area.
✅ Liquidity Grab Potential: A previous weak low has been taken, indicating possible price reaction.
✅ Premium Zone (~0.5730 - 0.5780): The strongest resistance, where sellers will likely dominate.
🔹 Probability for Trade Setups
1️⃣ Bullish Setup (Higher Probability - 70%)
Entry Zone: 0.5550 - 0.5580 (Discount Zone)
Stop Loss (SL): Below 0.5530
Take Profit (TP): 0.5650 - 0.5670
Probability: 70%
Reasoning:
The discount zone is holding, meaning buyers are stepping in.
RSI recovering from oversold levels.
MACD crossover approaching bullish momentum.
Liquidity sweep of weak lows, increasing reversal chances.
📌 Confirmation Needed:
Bullish candlestick pattern (Engulfing, Hammer, Morning Star)
Volume increase on bullish breakout
RSI moving above 40
2️⃣ Bearish Setup (Lower Probability - 50%)
Entry Zone: 0.5650 - 0.5670 (Resistance Zone)
Stop Loss (SL): Above 0.5700
Take Profit (TP): 0.5580
Probability: 50%
Reasoning:
The overall trend is bearish, but price is at discount demand zone, meaning a reversal is possible.
RSI is still low, signaling price exhaustion.
If price rejects 0.5650 - 0.5670, it could resume downward.
📌 Confirmation Needed:
Bearish candlestick pattern (Engulfing, Shooting Star, Evening Star)
RSI staying below 60
Volume declining near resistance zone
🎯 Final Probability Breakdown
Bullish Trade (Buying at 0.5550 - 0.5580) ➝ 70% Probability
Bearish Trade (Selling at 0.5650 - 0.5670) ➝ 50% Probability
📌 Best Trade for Now: BUY from 0.5550 - 0.5580, as price is reacting to the discount zone and showing bullish signs.

$NZDUSD outlook. After the bullish run towards our weekly target, a bearish continuation is likely however with the DXY weakening we could see further run upwards.
Sellers should keep in mind 0.57745, 0.57600 and 0.56259

NZD/USD Made H&S Pattern , Is It The Time To Change Direction ?The price made head and shoulders pattern which is will change the direction , also we have a very good confirmation and closure below neckline , so i think the price will go down next days , let`s see what will happen .
This Is An Educational + Analytic Content That Will Teach Why And How To Enter A Trade
Make Sure You Watch The Price Action Closely In Each Analysis As This Is A Very Important Part Of Our Method
Disclaimer : This Analysis Can Change At Anytime Without Notice And It Is Only For The Purpose Of Assisting Traders To Make Independent Investments Decisions.

NZD/USD "The Kiwi" Forex Market Heist Plan on BullishHola! Ola! My Dear Robbers / Money Makers & Losers, 🤑 💰
This is our master plan to Heist NZD/USD "The Kiwi" Forex Market based on Thief Trading style Technical Analysis.. kindly please follow the plan I have mentioned in the chart focus on Long entry. Our target is Red Zone that is High risk Dangerous level, market is overbought / Consolidation / Trend Reversal / Trap at the level Bearish Robbers / Traders gain the strength. Be safe and be careful and Be rich.
Entry 📈 : Can be taken Anywhere, What I suggest you to Place Buy Limit Orders in 15mins Timeframe Recent / Nearest Low Point take entry should be in pullback.
Stop Loss 🛑 : Recent Swing Low using 2H timeframe
Target 🎯 : 0.59600
Attention for Scalpers : Focus to scalp only on Long side, If you've got a lot of money you can get out right away otherwise you can join with a swing trade robbers and continue the heist plan, Use Trailing SL to protect our money 💰.
Warning : Fundamental Analysis news 📰 🗞️ comes against our robbery plan. our plan will be ruined smash the Stop Loss 🚫🚏. Don't Enter the market at the news update.
Loot and escape on the target 🎯 Swing Traders Plz Book the partial sum of money and wait for next breakout of dynamic level / Order block, Once it is cleared we can continue our heist plan to next new target.
💖Support our Robbery plan we can easily make money & take money 💰💵 Follow, Like & Share with your friends and Lovers. Make our Robbery Team Very Strong Join Ur hands with US. Loot Everything in this market everyday make money easily with Thief Trading Style.
Stay tuned with me and see you again with another Heist Plan..... 🫂

NZD/USD Creating New Wave ,Best Long Area And Short Area ClearedThis Is An Educational + Analytic Content That Will Teach Why And How To Enter A Trade
Make Sure You Watch The Price Action Closely In Each Analysis As This Is A Very Important Part Of Our Method
Disclaimer : This Analysis Can Change At Anytime Without Notice And It Is Only For The Purpose Of Assisting Traders To Make Independent Investments Decisions.

Free Long Trade On NZD/USD With Full Details , Don`t Miss It !This Is An Educational + Analytic Content That Will Teach Why And How To Enter A Trade
Make Sure You Watch The Price Action Closely In Each Analysis As This Is A Very Important Part Of Our Method
Disclaimer : This Analysis Can Change At Anytime Without Notice And It Is Only For The Purpose Of Assisting Traders To Make Independent Investments Decisions.
