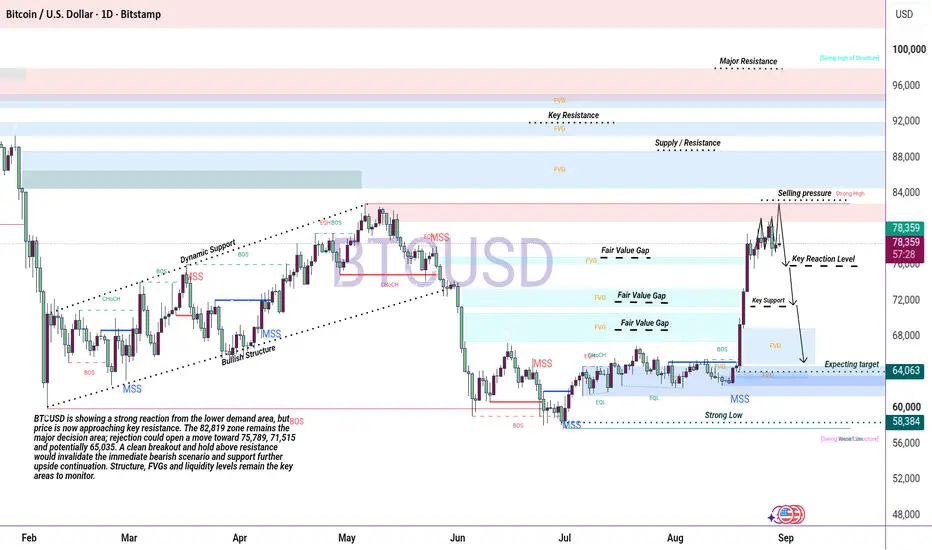
BTCUSD | Institutional Market Structure & Liquidity AnalysisBTCUSD | Institutional Market Structure & Liquidity Analysis
This Bitcoin 1D analysis provides a detailed candle-by-candle study of market structure, liquidity, Fair Value Gaps (FVG), Market Structure Shifts (MSS), Break of Structure (BOS), and key supply and demand areas.
The chart begins with strong bearish pressure, where consecutive candles pushed price lower and established an important swing low. After this decline, price entered a consolidation phase, allowing buyers to build a base and
Order-block
XAU/USD – Entry Analysis (H4)📈 XAU/USD – Entry Analysis (H4)
Our previous analysis didn’t quite reach the entry point, but the market structure is still developing nicely, and now we have a clean, rule-based long setup on the H4 timeframe.
After the CHoCH, price broke to the upside and is now expected to pull back into the FVG + Order Block zone. These two POIs align perfectly, increasing the probability that the market will collect liquidity here before continuing higher.
🎯 Entry Setup
Buy limit: 4086
Stop loss: 4062
T
Strategy & Education: Trading with Fibonacci and Order Blocks🔍 Trading Strategy Based on Fibonacci Levels and Order Blocks
This chart showcases three consecutive sell trades I executed on the BTCUSDT pair, each resulting in a profitable outcome. The purpose of this explanation is to demonstrate how Fibonacci retracement levels can be combined with Order Block zones to identify high-probability trade setups.
🧩 The Foundation: Understanding Price Retracement Behavior
The ABC, abc, and (a)(b)(c) structures marked on the chart are not Elliott Waves. Instead
RENDER Descending Triangle 4HBINANCE:RENDERUSDT seems to be forming a descending triangle on the 4H timeframe.
3 clear touches on resistance, and well-defined two-tap horizontal support at $2.50.
Key Levels to Watch 🔑
• $2.50-$2.75 Main support and daily demand zone
• $3.80-$4.20 Daily sell order block (potential resistance)
• $5.00-$5.20 4H sell order block (potential resistance)
Breakout Targets 🎯
⬆️ $5.00
⬇️ $1.50
Still in a No-Trade Zone, wait for confirmation (breakout candle close with good volume).
BTCUSD | 1D SMC Short Setup with Refined SL and TargetsDescription:
This analysis identifies a high-probability short opportunity for BTCUSD on the 1D timeframe using the Smart Money Concepts (SMC) framework. The chart shows clear bearish confluences, including market structure, supply zones, liquidity levels, and Fibonacci retracement zones. I believe the current bullish momentum is merely a manipulation driven by inflation news and the upcoming Trump inauguration. Following these events, I anticipate a significant market correction. Here’s th
TWLO, rebalance to FVG, then make a bullish liquidity run So, my current analysis is built around a bullish bias on this chart. I’ve identified a few key elements that are lining up to potentially signal a strong move upward:
Bullish Block Breaker: First, I've identified a bullish block breaker. This occurred when the price broke above a significant resistance level, indicating a shift in market sentiment from bearish to bullish. This breakout suggests that buyers have taken control, and it's often a sign of a potential trend reversal or continuation
SOLOKING - 1H || TP1 5X, TP2 10X, TP3 100XThe currency is currently at a great discount, making it an excellent time to buy for those who want to strengthen their position. It’s considered the best entry point before prices go up. There are many buy signals, and the team behind the project is strong and hardworking. This is a long-term investment opportunity. The team has been working super hard and they just listed on Bitmart and on MEXC in less than two days after launch.
Key highlights about $SKING:
- Initial liquidity pool of 5,35
BTC still bearishBTC still bearish
Effective risk management is crucial for success in trading. It not only helps in protecting assets but also optimizes the performance of trading strategies. The difference between seasoned traders and novices often lies in how they manage risks. Mastering the art of mitigating losses while maximizing gains is essential for long-term profitability in trading markets.
ETCUSDT.PIt appears that the price is approaching the 4-hour Point of Interest (POI), which looks promising. Additionally, I've noticed that both the 4-hour POI and the 1-hour Order Block (OB) coincide. Therefore, I anticipate a favourable reaction in this zone with a potential upward bounce.
Please write your opinion on this analysis in the comments.
If you find the analysis helpful, it would be appreciated if you share it with your friends.
FTMUSDT.PAfter Breaking POI 4H to the down side , reaching to 4H OB would make a good opportunity for long. but according to my strategy, due to weak upmovement, pending order is not recomended.
personally, I am waiting
1- to reach 4H Order block
2- check if new LLLH in 1H is establishd or not
if market creates new LLLH i will go long after breaking recent high
if market was not able to create new LLLH , getting confirmation from 15m time frame
required
i would update the chart based on
FLong
AVAXUSDT.PI've observed a significant upward movement in the 4-hour timeframe, indicating a potential trend reversal. However, it's crucial to acknowledge the substantial fluctuation within the 4-hour Order Block, underscoring the need for confirmation.
Despite the pronounced fluctuations, the 4-hour Order Block remains unbroken, and the overall trend is still bullish. Concurrently, the 1-hour timeframe signals a downtrend. In light of these conflicting indicators, it is not advisable to consider a long
MARINADE ( MNDE ) ON THISI was just looking at the MARINADE MDE-USD COINBASE chart and had a hard time thinking this is the top.
What does the volume tell you?
Where is support?
Where is resistance?
Does a trade make sense?
What timeframe are we basing actions on?
Just a few of the things I think about. Because the BTC ETF decision is so close, I'll be quick to cut any trade. Always use stop losses.
Not financial advice :)
Cheers!
$FTM Technical Analysis - R Fair Value Gap Turned Support *SMC**SMC* = Smart Money Concepts. See related Ideas for tutorials
In Smart Money, there are specific candle formation that will lead to a lot of clues to price action results. Yesterday FTM was the product child of those clues. Currently, the price has hit the top od the daily / weekly fair value gap. I just closed my long position because I expect it to retrace to thebottom of the weekly fair value gap, which in turn is also a breaker. These will act as support so once price reaches $0.548 we shou
FLong