GOLD: Bullish Continuation & Long Signal
GOLD
- Classic bullish formation
- Our team expects growth
SUGGESTED TRADE:
Swing Trade
Buy GOLD
Entry Level - 4037.7
Sl - 4028.4
Tp - 4056.7
Our Risk - 1%
Start protection of your profits from lower levels
Disclosure: I am part of Trade Nation's Influencer program and receive a monthly fee for using their TradingView charts in my analysis.
❤️ Please, support our work with like & comment! ❤️
P-signal

EURUSD Massive Long! BUY!
My dear friends,
Please, find my technical outlook for EURUSD below:
The price is coiling around a solid key level - 1.1516
Bias - Bullish
Technical Indicators: Pivot Points High anticipates a potential price reversal.
Super trend shows a clear buy, giving a perfect indicators' convergence.
Goal - 1.1554
About Used Indicators:
The pivot point itself is simply the average of the high, low and closing prices from the previous trading day.
Disclosure: I am part of Trade Nation's Influencer program and receive a monthly fee for using their TradingView charts in my analysis.
———————————
WISH YOU ALL LUCK

XAUUSD | Gold Signal | Now 21, 2025 SELL TREND TARGET FOR TODAY 📊
Based on the current trend, structure is strong to bearish. But right now, there’s still a chance for price to make a retracement first.
HAYATE is monitor the structure to see which one is safe whether we BUY first or continue SELL trend.
HAYATE target for this setup we should be able to collect around 100–150 pips++.
♾️Gold sell now @ 4046 - 4050
💰TP1 - 4043
💰TP2 - 4039
🚨SL - 4053

XRPUSDT.P - November 21, 2025Price is locked in a well‑defined short‑term downtrend, with a descending trendline capping every rally and the latest breakdown extending from the recent lower high.
The highlighted resistance band around 2.12–2.15 is the key pivot; as long as price remains below this area, momentum favors a continuation lower toward the prior swing‑low support cluster near 1.92, with any bounce into that resistance likely to be sold.

ETHUSDT.P - November 21, 2025The market is in a short‑term downtrend, confirmed by a clear sequence of lower highs capped by a descending trendline and repeated failure at the 3,020–3,040 resistance band.
Price lost momentum after the last test of that resistance, triggered a new selling pressure, and unwound sharply back through intraday support levels, opening room for continuation toward the lower projected support zones.

BTCUSDT.P - November 21, 2025Price is in a short‑term downtrend, with a series of lower highs and lower lows after rejecting the highlighted resistance area near 92,300–92,500 and breaking back below intraday consolidation. Loss of upside momentum and a rotation from a prior minor rally confirming sellers’ control and opening the door for continuation toward the marked support area around 88,800–89,200.

NZDCAD: Short Trade Explained
NZDCAD
- Classic bearish formation
- Our team expects fall
SUGGESTED TRADE:
Swing Trade
Sell NZDCAD
Entry Level - 0.7912
Sl - 0.7921
Tp - 0.7894
Our Risk - 1%
Start protection of your profits from lower levels
Disclosure: I am part of Trade Nation's Influencer program and receive a monthly fee for using their TradingView charts in my analysis.
❤️ Please, support our work with like & comment! ❤️

EURAUD Expected Growth! BUY!
My dear friends,
My technical analysis for EURAUD is below:
The market is trading on 1.7756 pivot level.
Bias - Bullish
Technical Indicators: Both Super Trend & Pivot HL indicate a highly probable Bullish continuation.
Target - 1.7809
About Used Indicators:
A pivot point is a technical analysis indicator, or calculations, used to determine the overall trend of the market over different time frames.
Disclosure: I am part of Trade Nation's Influencer program and receive a monthly fee for using their TradingView charts in my analysis.
———————————
WISH YOU ALL LUCK

NZDJPY Buyers In Panic! SELL!
My dear subscribers,
My technical analysis for NZDJPY is below:
The price is coiling around a solid key level - 88.787
Bias - Bearish
Technical Indicators: Pivot Points Low anticipates a potential price reversal.
Super trend shows a clear sell, giving a perfect indicators' convergence.
Goal - 88.343
My Stop Loss - 89.041
About Used Indicators:
By the very nature of the supertrend indicator, it offers firm support and resistance levels for traders to enter and exit trades. Additionally, it also provides signals for setting stop losses
Disclosure: I am part of Trade Nation's Influencer program and receive a monthly fee for using their TradingView charts in my analysis.
———————————
WISH YOU ALL LUCK

ETHEREUM | THE MATH IS COMPLETE | SHORT SQUEEZE LOADING?Traders,
ETH is setting up for a potential big short squeeze that can rip price up hard. Let me walk you through the math, the order flow and the volume profile that are all pointing in the same direction.
1. The Fib math: 0.5 retrace into 2.0 extension
At point A ETH printed the last impulsive wave up before the dump. After point B the market sold off and then retraced exactly to the 0.5 retracement at point C.
Why 0.5 rotates into 2.0 from a math perspective :
A 0.5 retracement means price has pulled back 50 percent of the prior leg.
-> If AB is 1000 points, a 0.5 retrace gives a 500 point pullback.
In my Fibonacci Rotation table, 0.5 is paired with 2.0 because they are exact reciprocals.
-> 1 divided by 0.5 equals 2.
So when the market respects the 0.5 retrace, the natural projection is the 2.0 extension in the opposite direction.
-> You are effectively rotating the same structure: halve in the pullback, double in the extension.
On this chart that 2.0 extension lands right into the $2880 to $2890 area. From C that 0.5 retrace is not random. It is the anchor that mathematically rotates into the 2.0 target and defines the first major squeeze zone above.
2. HTF Fibonacci extension confluence
From there we step out to the higher timeframe structure.
We take a Fibonacci Extension and draw it:
From the highest point on the chart (X)
Down to the first big swing low (Y)
Then up to the next swing high (Z)
This measures the high to low structure and then projects extensions of that full swing.
On that HTF extension, the 1.618 level sits right in the same area as the 2.0 from the 0.5 rotation.
Why the 1.618 and 2.0 together are strong confluence :
1.618 is the classic golden ratio extension.
-> A lot of systems, harmonics and algos respond around 1.272 and 1.618.
2.0 is the clean reciprocal extension of the 0.5 retrace from the internal leg.
-> These two levels are calculated from two different swings.
One comes from the internal retracement structure.
-> The other comes from the higher timeframe swing.
When independent measurements give almost the same price area, that zone is not made up. It is where different groups of traders and different models will naturally cluster orders, targets and stops.
So $2880 to $2890 is a real Fib confluence, not a guess. It is a logical first destination for a short squeeze and it sits exactly inside the current FVG.
3. Fixed Range Volume Profile and the LVN at $2880
Now we bring in volume.
When we draw a Fixed Range Volume Profile from the swing low of 9 April to the swing high of 24 August, we see a very clean Low Volume Node (LVN) at roughly $2880. That LVN sits inside the same Fair Value Gap that price is currently exactly trading in.
What this actually means :
A Low Volume Node is an area where historically the market did not trade much.
-> Very few contracts changed hands there.
-> The auction basically skipped through that price zone.
In an auction model, high volume areas are where the market is comfortable.
-> Price spends time there, value is accepted, big rotations happen.
Low volume areas are the opposite.
The market rejected that area before.
-> Price moved through it quickly because either buyers or sellers completely dominated and there was no real back and forth.
So when price comes back down into an LVN inside an FVG like this, it tells me:
Price has moved back into an old inefficiency where previously there was no interest in building value.
If buyers are absorbing there (which we see from spot metrics), then the LVN can act as a springboard.
Either price slices straight through the LVN to the next high volume area.
Or price tags it, rejects sharply and uses it as the launch zone for the next leg.
In this case the LVN at $2880 is aligned with:
The 2.0 extension from the 0.5 rotation
The HTF 1.618 extension zone
The current FVG
That is a triple confluence of math, volume and inefficiency. Price did not randomly land here.
4. Spot A/D: hidden bullish accumulation
Now we go under the candles and look at order flow.
First is the A/D (Accumulation / Distribution) indicator, applied on spot and mainly on the 4H and higher.
Why A/D on spot and why on 4H plus :
Spot represents real ETH being bought and sold.
-> No funding games, less synthetic noise.
-> It shows where true demand is stepping in.
Futures can be distorted by hedging, arbing and leverage rotation.
On low timeframes there is a lot of noise from scalpers and short term spoofing.
-> 4H and higher smooth out that noise and reveal the bigger players.
What we see now:
On the spot A/D line both highs and lows have been trending higher.
Price, in the same window, is trending lower.
So price is making lower lows, A/D is making higher lows and higher highs.
This means:
On down moves, there is more volume being absorbed by buyers than being pushed by sellers.
Sellers are getting absorbed.
Smart money is accumulating spot while the chart still looks bearish to the average viewer.
That is textbook hidden bullish accumulation.
5. CVD and OI: shorts are loading into that accumulation
Now it gets even more interesting when we bring in CVD and OI.
5.1 Aggregated Spot CVD vs price
On 13 November:
Aggregated Spot CVD sat around -31.61k.
From that point it started trending up, forming higher highs and higher lows.
Today it is around 100.91k.
Change in Spot CVD:
100.91k minus -31.61k = +132.52k
So net buying on spot increased by about 132.5k units while:
Price moved from roughly $3150 down to about $2988
That is a drop of 162 dollars
162 divided by 3150 is about 5.1 percent
So we have:
A big positive flip in net spot demand
Only a small net drop in price
If bears were truly in control, that amount of spot absorption would not allow price to stay this close. You would see a much heavier breakdown earlier in the move. Instead buyers have quietly soaked up the selling and then pushed net CVD positive while price is only down around 5 percent.
This fits perfectly with the bullish accumulation narrative.
5.2 Futures CVD and OI
On the futures side:
Aggregated Stablecoin Margined Futures CVD dropped from about -408k to about -1.34M.
-> Roughly -932k more net selling.
Aggregated Coin Margined Contracts CVD dropped from about -88M to about -807M.
-> Roughly -719M more net selling.
At the same time:
Stablecoin Margined OI increased from 4.39M to 4.88M.
-> Increase of about 0.49M which is around 11 percent.
Coin Margined OI increased from 1.81B to 1.91B.
-> Increase of about 0.10B which is around 5.5 percent.
So futures traders are:
Aggressively hitting into the bid
Increasing net short pressure (CVD more negative)
Keeping positions open and even adding more (OI going up)
All of this while:
Spot is quietly buying
Spot CVD is strongly positive
Price is sitting in a triple confluence zone around $2880 inside an LVN and FVG
A simple way to think about it:
Spot is the strong hand slowly loading.
Futures is the weak hand aggressively shorting into that demand.
Price is held in a relatively tight range compared to the amount of futures selling.
Once that selling slows or some catalyst hits, all of those shorts are fuel. They will have to cover into a thin LVN zone, through a Fib confluence and into areas where there was previously low participation. That is exactly how you get fast vertical moves.
6. USDT.D confluence
Now, when looking at the USDT.D chart on the HTF, we can see that it has rejected from the 0.886 retracement, broke structure and is now respecting a descending trendline, while RSI is showing heavy bearish divergence. This means that even though USDT.D tried to push higher, each push had less and less momentum behind it, and buyers of dominance are getting weaker. For crypto, that is important, because a topping and rolling over USDT.D often signals capital rotating out of stablecoins back into risk assets. In confluence with everything discussed before, this adds another layer to the thesis. Spot is accumulating, futures are overcrowded on the short side, ETH is sitting in a strong Fib and volume confluence zone, and at the same time USDT.D is showing signs of distribution and potential downside. If USDT.D continues to bleed down from this 0.886 rejection, it structurally supports a scenario where ETH squeezes higher into the targets discussed.
7. Targets and the bigger picture
Based on this structure and the order flow, the upside targets I am watching are:
$3800
$4400
And if crypto gets proper momentum, a final Swing Fail Pattern around $5100
The logic behind these levels:
$3800 and $4400 are not random numbers. They line up with higher timeframe Fib extensions and prior structural pivots and volume distribution levels. Think of them as natural waypoints where bigger players will take profit, hedge or reposition.
$5100 is where I can see a classic SFP scenario:
We push into a new high.
Late buyers chase the breakout.
Existing shorts get squeezed.
Then once liquidity above the prior highs is taken, a sharp reversal becomes very likely.
So my roadmap is:
First we reclaim and rotate out of this $2880 confluence zone. Then $3800 and $4400 become realistic magnets. If the whole crypto complex catches momentum, $5100 as an SFP high is very much on the table.
Invalidation:
Invalidation for this specific bullish accumulation and squeeze thesis comes only if ETH starts trading below $2470. As long as we hold above that level, every dump is still in quiet bullish accumulation territory for me, unless order flow starts telling another story.
7. Conclusion
Fib structure points to $2880 as a key confluence level.
Fixed Range Volume Profile confirms this with a clean LVN inside an FVG.
Spot A/D and Spot CVD are showing bullish accumulation while price grinds down.
Futures CVD and OI show shorts loading into that spot absorption.
Upside roadmap: 3800, then $4400, with a possible SFP (Swing Fail Pattern) around $5100 if the trend extends.
Invalidation only if ETH starts trading below $2470. Until that happens, every dump for me stays in quiet bullish accumulation territory, unless order flow flips.
USDT.D confluence.
Same as always. This is not financial advice. Trade your own plan, size your own risk. I am just laying out the math, volume and order flow that I see behind this potential short squeeze on ETH.
Markets do not whisper without reason. When math, volume and flow all hum the same melody, I prefer to listen before the crowd hears the drop.
-------
If this spoke to the part of you that loves clean math and dirty squeezes, drop a like, leave a comment, and bookmark it. When the candles start to sprint, you will want to remember where the story was already written.
- ThetaNomad

ETHUSDT.P - November 20, 2025ETHUSD is displaying a series of lower highs beneath a well-defined descending trendline, showing persistent bearish momentum and a clear downtrend. Price repeatedly failed to break resistance around 3,100, leading to sharp declines back toward support near 2,900. Recent price action shows a corrective rally met strong resistance as momentum faded. Overall, the trend remains bearish unless price can decisively breach the descending resistance line and establish higher highs.

XRPUSDT.P - November 20, 2025This chart shows a corrective upward move within a broader downtrend, with current resistance at 2.14 and major resistance at 2.17. The price action indicates a possible rejection from these resistance zones, with a projected move down toward the support level around 2.03. Trend structure remains bearish as rallies are failing to break above prior resistance levels. Momentum appears weak, suggesting sellers are likely to regain control near overhead resistance.

EURGBP: Long Trading Opportunity
EURGBP
- Classic bullish formation
- Our team expects pullback
SUGGESTED TRADE:
Swing Trade
Long EURGBP
Entry - 0.8813
Sl - 0.8808
Tp - 0.8824
Our Risk - 1%
Start protection of your profits from lower levels
Disclosure: I am part of Trade Nation's Influencer program and receive a monthly fee for using their TradingView charts in my analysis.
❤️ Please, support our work with like & comment! ❤️

GBPUSD On The Rise! BUY!
My dear subscribers,
GBPUSD looks like it will make a good move, and here are the details:
The market is trading on 1.3077 pivot level.
Bias -Bullish
Technical Indicators: Both Super Trend & Pivot HL indicate a highly probable Bullish continuation.
Target - 1.3124
About Used Indicators:
The average true range (ATR) plays an important role in 'Supertrend' as the indicator uses ATR to calculate its value. The ATR indicator signals the degree of price volatility.
Disclosure: I am part of Trade Nation's Influencer program and receive a monthly fee for using their TradingView charts in my analysis.
———————————
WISH YOU ALL LUCK

GOLD Trading Opportunity! BUY!
My dear followers,
I analysed this chart on GOLD and concluded the following:
The market is trading on 4062.9 pivot level.
Bias - Bullish
Technical Indicators: Both Super Trend & Pivot HL indicate a highly probable Bullish continuation.
Target - 4083.0
Safe Stop Loss - 4050.2
About Used Indicators:
A super-trend indicator is plotted on either above or below the closing price to signal a buy or sell. The indicator changes color, based on whether or not you should be buying. If the super-trend indicator moves below the closing price, the indicator turns green, and it signals an entry point or points to buy.
Disclosure: I am part of Trade Nation's Influencer program and receive a monthly fee for using their TradingView charts in my analysis.
———————————
WISH YOU ALL LUCK

USDCHF - Bulls Preparing to Defend the Zone!⚔️USDCHF is currently trading around a key intersection zone , where the rising trendline meets the major green support area.
This confluence makes it a high-interest zone for potential bullish reactions, as the pair has respected this structure multiple times in the past.
🏹As long as the support area holds, I’ll be looking for long setups, expecting the next impulse to push price back toward the upper bound of the ascending channel.
If the support breaks, however, the bullish outlook would weaken, so patience and confirmation are key here. ⚖️
⚠️ Disclaimer: This is not financial advice. Always do your own research and manage risk properly.
📊All Strategies Are Good; If Managed Properly!
~Richard Nasr

EURUSD - The Bears Are Waiting at the Gate!EURUSD remains overall bearish, trading within a falling red channel and respecting the sequence of lower highs and lower lows.
📈Currently, the pair is approaching a massive structure zone highlighted in blue, an area that has acted as both support and resistance multiple times in the past. This zone also aligns perfectly with the upper trendline of the channel, adding even more confluence.
As long as this resistance holds, I’ll be looking for potential short setups, expecting a rejection that could drive price back toward the lower boundary of the channel.
The bears are watching this level closely, will they step in again? 👀
⚠️ Disclaimer: This is not financial advice. Always do your own research and manage risk properly.
📊All Strategies Are Good; If Managed Properly!
~Richard Nasr

ERAUSDT.P - November 18, 2025Price is pulling back from the resistance area near 0.2657 and continuing a short-term downtrend toward the next major support around 0.2271. The structure shows consistent lower highs, indicating bearish momentum.

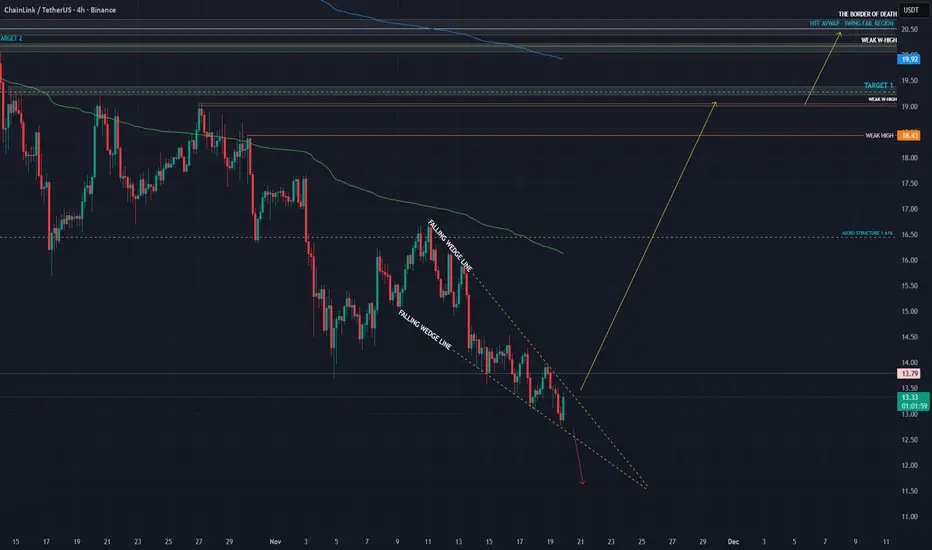
CHAINLINK - LOADING A SUPER SWEEP UP! - Traders,
In my last $CHAINLINK analysis
I wrote out two scenario’s.
Scenario 1 did not play out. Scenario 2 was simple: a dump into the next 1.618 extension, and from there the hunt for a fresh long setup begins. That 1.618 was at 12.90$
And here we are.
Pixel perfect.
So are we wrong? This is why having your levels outlined and being patient matters more than anything. When one path closes, structure reveals another. The chart always speaks.
But only those who wait can hear it.
What we are looking at
$CHAINLINK dumped straight into the 12 to 13 dollar zone.
This zone is not random. It is technically one of the most important pockets on the chart.
Let’s break down why.
Mathematical Levels – The Spot Chart
To avoid distortion caused by the 10 October liquidation wick, we start with clean mathematical levels on the spot chart.
At 12.886 we have the high timeframe 0.886 Fibonacci retracement. This is the deep retrace zone where momentum often shifts. Price tends to exhaust here because 0.886 represents the final Fibonacci rotation before structural invalidation. It is where the last sellers usually throw in everything they have.
At the same time, this level lines up with the 1.618 extension of the first structure after the 10 October crash. The initial high to low is marked with a yellow arrow in your chart.
This means one thing:
The downside auction has mathematically completed.
Both the retracement leg and the extension leg have landed in the same pocket.
This is real confluence.
The HTF AVWAP Confluence
Chart:
On 06 August 2024, LINK printed a new significant low.
This low kicked off a bullish wave with strong volume behind it.
That wave marked the beginning of a long uptrend, which means the AVWAP anchored to this low carries real weight.
Now here is the fascinating part:
The lower band of the anchored AVWAP aligns perfectly with:
The HTF 0.886 retracement
The 1.618 extension
The current price zone
The mathematical exhaustion pocket
This is not normal.
This is precision level confluence.
What this means
When AVWAP, Fibonacci, and wave extensions align, it signals that institutional cost basis, market memory, and auction math are all pointing to the same zone as fair value.
This is where smart money steps in.
Falling Wedge – The Technical Cherry
The final ingredient:
LINK has printed a clean, textbook falling wedge.
A falling wedge is a bullish reversal pattern where momentum compresses and the final sellers run out of strength. It represents exhaustion, not continuation.
Combine that with AVWAP, Fibonacci, and mathematical symmetry, and you have a powerful structural reversal setup.
Order Flow Confirmation
The order flow confirm the technical story:
Spot CVD has been trending down, but price is no longer following with the same intensity.
Stablecoin and coin margined CVDs are still pushing lower, but again, price is resisting the pressure.
Open Interest increased into the lows. New shorts opened into exhaustion.
Funding remains small and neutral.
Price is holding the key zone.
This is absorption. When shorts push and price refuses to break, the market is loading a spring.
Conclusion
The 12 to 13 dollar range is not random noise.
It is a high timeframe confluence zone made of:
The 0.886 Fibonacci retracement
The 1.618 extension completion
The lower AVWAP band from the August trend origin
A falling wedge structure
Order flow absorption
New shorts entering into weakness
LINK is setting up for a powerful sweep if this zone holds.
Targets.
$19.30
$20.50
$38.00 if we move higher.
Breaking out of the wedge pattern invalidates the idea.
--------
The chart is whispering again. Patience turns whispers into signals.
--------
If you like this kind of analysis, drop a like and leave a comment. Everything here is shared for free so more people can cut through the noise and finally see what is actually happening under the surface. No hopium. No fear. Just real data, real structure, and real order flow.
The goal is simple. To help traders stop guessing and start understanding what the market is actually saying.
Stay sharp.
Stay objective.
And remember… the chart whispers long before it speaks.
- ThetaNomad
BITCOIN – THE TIDES ARE TURNING Traders,
On November 5 I mapped out a scenario where Bitcoin would push into 107k to 108k and then decline to 98k first and 89k second.
This entire scenario has now played out perfectly to the pixel. We swept 108k, we dumped to 98k, and then we flushed into 89k. Where I expected price to retrace from exactly this level: $88.912
So the real question now is simple. What now? Do we break lower, or do we go up?
Let’s break Bitcoin down cleanly, without bias, and only by reading structure, levels, and order flow.
Levels, Structure and Order Flow
AVWAP at the core of the structure
Bitcoin is currently trading right near the AVWAP from the 06 August 24 anchor. This is the blue line on your chart and the exact level is 90.881. This anchor began with a large volume impulse.
When heavy volume kicks off a leg, the AVWAP from that point becomes a core reference level for the entire future auction. We are now sitting right on top of it, which is exactly where you would expect absorption or a strong reaction.
The market is basically deciding if this AVWAP will hold or break.
AB=CD completion
The full AB=CD measured move has completed exactly into the AVWAP zone. This is a clean harmonic completion and adds confluence to why price reacted here. AB=CD means the downside leg is symmetrical and usually marks exhaustion inside a trend.
Fixed Range Volume Profile
Using a FRVP from the start of the current HTF auction (07 April until now), we see price wicked directly into the LVN that sits inside the weekly FVG. This area had imbalance and low participation. A wick into an LVN inside an FVG often means that the inefficiency is now cleaned and the auction has reached completion for that side of the range.
Wedge breakout
Bitcoin technically broke out of the falling wedge, but the breakout does not look clean.
We are outside the wedge, but momentum on the breakout is weak. True confirmation would come if price re-enters the wedge from the outside and climbs back through the wedge body.
Re-entering the wedge tells you that the breakdown was liquidity and not a structural continuation. If we reclaim it, upside targets become more likely.
Order Flow – What the data shows
Spot and Futures CVD
Across the 15m, 30m and 1h charts, Spot CVD is forming a bullish divergence. Price keeps making lower lows, but Spot CVD is holding higher. This shows that spot buyers are stepping in at the lows and absorbing sell pressure.
Futures CVD on both stablecoin margined and coin margined contracts continues to push lower.
Price is not following these lower lows. This creates hidden bullish divergence and confirms that aggressive sellers are hitting the market while limit buyers are absorbing the pressure.
This is a classic sign of absorption. Selling continues, but the market is refusing to break lower with the same intensity.
Open Interest – A shift
Earlier in the dump, Open Interest was falling. This means positions were being closed.
Most of this was shorts taking profit or exiting the move. When OI drops during a downtrend, continuation becomes harder because the move loses fuel.
Near the end of the screenshots, there is a shift. Both stablecoin margined and coin margined OI start to rise again.
This rise in OI happens while:
CVD continues to make lower lows
Price stops making new lows
Price begins to stabilize
This tells us that new positions are being opened at the lows. Given the CVD behavior, most of these are new shorts entering the market.
When new shorts enter and price does not break, the probability of those shorts becoming trapped increases. If buyers step in, this setup often leads to a short squeeze.
This is how reversals form in a controlled market.
Funding rate – Binance
Funding is positive but very small. This means there is no extreme long pressure. There is no overcrowding on the long side. The market is not stretched. With fresh shorts entering at the lows and funding staying neutral, the market can turn quickly if support holds.
What this means
The combination of:
Spot CVD divergence
Hidden bullish divergence on futures CVD
Rising Open Interest at the lows
Neutral funding
Price refusing to break down - So price needs to hold.
shows that the market is absorbing aggressive selling at a key level. If buyers defend the current level, this can force newly opened shorts to cover, which would fuel the next move up.
Targets
109k
This is the first upside objective.
There is a CME ETH gap resting at this level and gaps of this type tend to get filled.
109k also aligns with the 1.113 Fibonacci extension of the latest wave.
This makes it the first logical level if price continues to hold the AVWAP and absorb selling pressure.
112k
The next major level is 112k.
This area contains single prints on CME and matches an AVWAP level on the BTC CME chart.
112k also lines up with the 1.272 extension of the wave.
From a Fibonacci rotation perspective, 1.272 is the next stop after 1.113 and often acts as a mid-cycle continuation target.
118.800
The final target sits at 118.800.
This is the full 1.618 extension of the wave and mathematically completes the auction.
If the market rotates from AVWAP support, this level becomes the natural endpoint of the move.
As long as price continues to hold the AVWAP at 90.881 and the market keeps absorbing futures selling, all three upside targets remain in play.
Invalidation
The structure changes only if price breaks below 88k. A clean drop under 88k opens the door for the next major high timeframe support at 85k.
85k carries strong confluence. It aligns with the 0.786 Fibonacci retracement on the HTF move and sits directly on a Point of Control zone within the Fixed Range Volume Profile.
Below that level, the auction shifts into a lower structure entirely.
TLDR
Bitcoin completed the downside scenario perfectly.
Price is now sitting directly on the AVWAP at 90.881.
AB=CD is complete.
LVN inside weekly FVG has been cleaned.
Futures CVD is still pressing lower but price is not. That is absorption.
But the key update is OI. OI was dropping earlier on the LTF, but now OI is rising again, and this is happening while CVD continues down and price holds steady.
That means new shorts are entering the market and getting absorbed.
If AVWAP holds, expect a bounce.
Targets:
109k
112k
118.8k
If 88k breaks, 85k is next.
--------
Abbreviation List
AVWAP
Anchored Volume Weighted Average Price. A dynamic support or resistance level based on volume since a chosen anchor.
AB=CD
A harmonic measured move where AB equals CD.
FRVP
Fixed Range Volume Profile. Shows where volume was traded inside a chosen range.
LVN
Low Volume Node. A low interest level where price often rejects strongly.
FVG
Fair Value Gap. An imbalance left by aggressive price moves.
CVD
Cumulative Volume Delta. Tracks buying vs selling pressure.
OI
Open Interest. The amount of open futures positions.
POC
Point of Control. Level with the highest traded volume.
--------
If you like this kind of analysis, drop a like and leave a comment. Everything here is shared for free so more people can cut through the noise and finally see what is actually happening under the surface. No hopium. No fear. Just real data, real structure, and real order flow.
The goal is simple. To help traders stop guessing and start understanding what the market is actually saying.
Stay sharp.
Stay objective.
And remember… the chart whispers long before it speaks.
- ThetaNomad

NZDCHF: Long Trade Explained
NZDCHF
- Classic bullish pattern
- Our team expects retracement
SUGGESTED TRADE:
Swing Trade
Buy NZDCHF
Entry - 0.4504
Stop - 0.4498
Take - 0.4515
Our Risk - 1%
Start protection of your profits from lower levels
Disclosure: I am part of Trade Nation's Influencer program and receive a monthly fee for using their TradingView charts in my analysis.
❤️ Please, support our work with like & comment! ❤️

AUDJPY Massive Short! SELL!
My dear followers,
This is my opinion on the AUDJPY next move:
The asset is approaching an important pivot point 101.34
Bias - Bearish
Technical Indicators: Supper Trend generates a clear short signal while Pivot Point HL is currently determining the overall Bearish trend of the market.
Goal - 100.96
About Used Indicators:
For more efficient signals, super-trend is used in combination with other indicators like Pivot Points.
Disclosure: I am part of Trade Nation's Influencer program and receive a monthly fee for using their TradingView charts in my analysis.
———————————
WISH YOU ALL LUCK

AUDUSD What Next? BUY!
My dear friends,
AUDUSD looks like it will make a good move, and here are the details:
The market is trading on 0.6461 pivot level.
Bias - Bullish
Technical Indicators: Supper Trend generates a clear long signal while Pivot Point HL is currently determining the overall Bullish trend of the market.
Goal - 0.6485
Recommended Stop Loss - 0.6451
About Used Indicators:
Pivot points are a great way to identify areas of support and resistance, but they work best when combined with other kinds of technical analysis
Disclosure: I am part of Trade Nation's Influencer program and receive a monthly fee for using their TradingView charts in my analysis.
———————————
WISH YOU ALL LUCK
