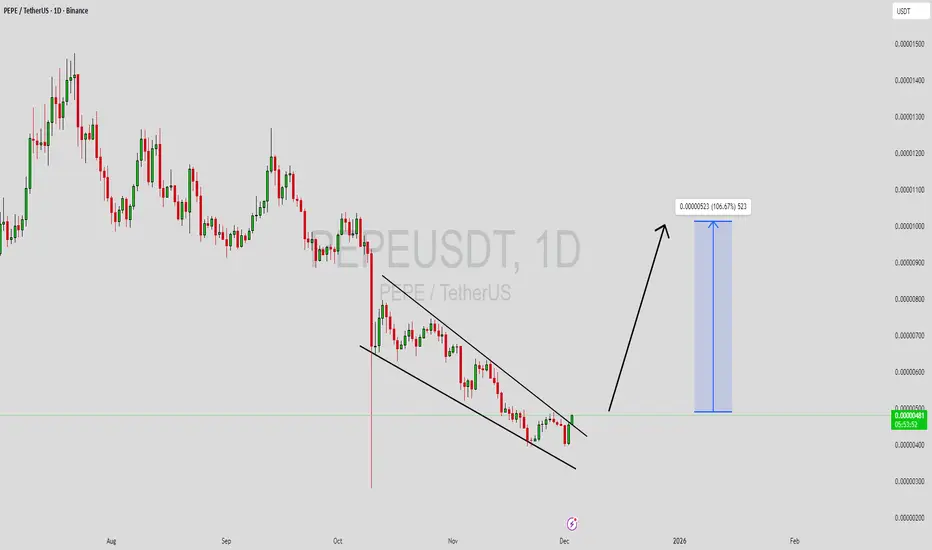
PEPEUSDT Forming Falling WedgePEPEUSDT is forming a clear falling wedge pattern, a classic bullish reversal signal that often indicates an upcoming breakout. The price has been consolidating within a narrowing range, suggesting that selling pressure is weakening while buyers are beginning to regain control. With consistent volume confirming accumulation at lower levels, the setup hints at a potential bullish breakout soon. The projected move could lead to an impressive gain of around 90% to 100% once the price breaks above the wedge resistance.
This falling wedge pattern is typically seen at the end of downtrends or corrective phases, and it represents a potential shift in market sentiment from bearish to bullish. Traders closely watching PEPEUSDT are noting the strengthening momentum as it nears a breakout zone. The good trading volume adds confidence to this pattern, showing that market participants are positioning early in anticipation of a reversal.
Investors’ growing interest in PEPEUSDT reflects rising confidence in the project’s long-term fundamentals and current technical strength. If the breakout confirms with sustained volume, this could mark the start of a fresh bullish leg. Traders might find this a valuable setup for medium-term gains, especially as the wedge pattern completes and buying momentum accelerates.
✅ Show your support by hitting the like button and
✅ Leaving a comment below! (What is your opinion about this Coin?)
Your feedback and engagement keep me inspired to share more insightful market analysis with you!
Pepeusdtperp
PEPE/USDT : LIVE TRDEHello friends
Given the growth we had, the price has now formed lower floors and ceilings, which we have identified as sellers most likely pushing the price down.
Observe risk and capital management and avoid emotional behavior.
*Trade safely with us*

PEPE BUY!Hello friends
Due to the good growth we had, the price has corrected and formed a flag pattern and this pattern has been broken by buyers and now with risk capital management and in a stepwise manner, you can buy and move with it to the specified targets.
*Trade safely with us*

PEPE — Will This Golden Zone Spark the Next Reversal?Overview
The PEPE/USDT 2D chart is now standing at a critical inflection point — right inside the major support zone (yellow area) that has repeatedly acted as the foundation for rallies since 2024.
After a deep liquidity sweep down to 0.00000266, price quickly recovered and is now holding above the same zone.
In short: liquidity has been cleared, and the market is preparing for its next move.
---
Pattern & Market Structure
Golden Zone = Key Demand Area:
This yellow block has absorbed significant buying interest in the past. As long as it holds, the potential for a rebound remains high.
Liquidity sweep (long lower wick):
A classic sign of a fake breakdown — often a precursor to bullish reversals.
Mid-term structure:
Still forming lower highs, but a potential base-building phase seems to be developing.
In other words, this could be the calm before the storm.
---
Bullish Scenario — The Start of a Comeback
If the 2D candle closes decisively above 0.00000913, momentum could flip bullish.
That breakout would signal the beginning of a new re-accumulation phase, opening the path toward the following upside targets:
🎯 Target 1: 0.00001208 → initial resistance and first take-profit zone.
🎯 Target 2: 0.00001418 – 0.00001556 → mid-range resistance area.
🎯 Target 3: 0.00002105 – 0.00002662 → high momentum zone if buyers fully regain control.
📈 Extra confirmation: rising volume + strong-bodied breakout candle = early sign of trend reversal.
---
Bearish Scenario — If the Zone Fails to Hold
However, if PEPE closes below the yellow zone (around 0.0000071 – 0.0000060), the major support will officially break down.
That would open the door for a deeper correction toward:
⚠️ 0.00000266 (previous low) — the last strong demand area.
Below this level, a capitulation wave could emerge.
A bearish setup strengthens if the price retests the broken support and fails to reclaim it.
---
Trading Strategy & Risk Management
Aggressive traders: scale in within the yellow zone with tight stops below the extreme wick.
Conservative traders: wait for a confirmed 2D close above 0.00000913 before entering.
Take profits progressively at each resistance level and move stop-loss to breakeven after TP1.
🎯 Risk-to-reward: minimum 1:2 recommended.
⚙️ Key rule: never fight strong candles with volume confirmation.
---
Conclusion
PEPE is currently at a make-or-break level.
If the golden zone holds, a major reversal could begin from here.
If it breaks, expect a retest of the previous lows near 0.00000266.
Watch for 2D candle closes and volume confirmation — big market shifts often start quietly, just like this.
---
#PEPE #PEPEUSDT #CryptoAnalysis #MarketReversal #SupportZone #CryptoTrading #AltcoinSeason #SwingTrade #TechnicalSetup #SmartMoney

PEPEUSDT - The real market indicator?Did you know that PEPE’s chart gave a very strong early signal of the massive crash that happened on October 10th?
It had formed a huge Head and Shoulders pattern, and the target of that pattern was exactly the lowest point reached on October 10th.
Not only that — there was also a massive Death Cross on the 3-day chart, where the 100 EMA crossed below the 25 EMA — a textbook bearish confirmation.
The result?
The pattern played out perfectly, leading straight to the crash on October 10th.
Now, if we use PEPE as a market indicator, things don’t look good — its main trendline (starting from October 23rd two years ago ) has broken, retested, and is heading lower, signaling more downside pressure.
So what do you think?
— have we officially entered a bear market? , or is PEPE just moving independently from the rest of the market?
Drop your thoughts in the comments 👇
Best Regards:
Ceciliones🎯

BUY AND HOLDHello friends
Given the potential and good support that this currency has, with the growth of Ethereum, it can experience another upward rally. Now that the price has corrected, you can buy in steps with capital and risk management and move with it to the specified goals.
Note that the holding period is at least 3 months, so be patient and observe capital management.
*Trade safely with us*

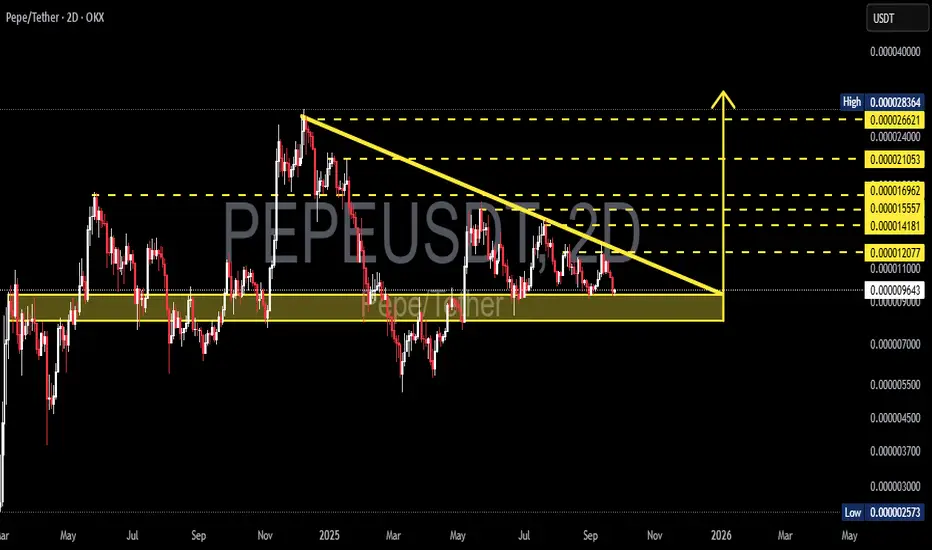
PEPE/USDT — Descending Triangle: Breakout or Breakdown?🟡 Chart Structure
PEPE is currently in a critical phase. The price has been forming a descending triangle (lower highs + horizontal support) for several months.
Current price: 0.000009638
Major Support Zone: 0.000007000 – 0.000011100 (yellow box)
Key Downtrend Resistance: descending yellow trendline from 2025 highs
Upside Levels: 0.000012077 → 0.000014181 → 0.000015557 → 0.000016962 → 0.000021053 → 0.000024000 → 0.000026621
Extreme Low: 0.000002573
---
🟢 Bullish Scenario — The Big Breakout
If PEPE breaks above the downtrend line and closes above 0.000012077 with strong volume, then:
1. The descending triangle breakout will be confirmed.
2. Measured Move Target:
Pattern height = (High 0.000028364 − Support 0.000009638) = 0.000018726
Added to breakout level (0.000012077 + 0.000018726) = 0.000030803
Potential upside: +220% from current levels.
3. Likely progression step by step:
Short-term resistance: 0.000014 – 0.000017
Next milestones: 0.000021 – 0.000024 → 0.000026+ toward the final target.
4. If confirmed, this could be one of the strongest rallies of the year for PEPE.
---
🔴 Bearish Scenario — Breakdown Risk
Statistically, descending triangles tend to lean bearish. If the yellow support zone (0.000007000 – 0.000009000) breaks with volume, then:
1. The structure fails and selling pressure accelerates.
2. Downside targets:
0.000005000 → 0.000003000 → extreme low at 0.000002573.
3. From current price to 0.000002573 = -73% downside risk.
4. Failure to hold support could trigger a sharp continuation of the bearish trend.
---
📐 Technical Pattern — Descending Triangle
Meaning: sellers keep pushing lower highs, while buyers defend one horizontal area.
Bias: bearish continuation by default.
But… if bulls break the trendline, it flips into a powerful bullish reversal signal → often followed by rapid rallies.
---
🧠 Key Notes for Traders
Don’t enter trades just because price touches support or resistance → always wait for a 2D candle close + volume confirmation.
Breakout: avoid FOMO, wait for a retest of the breakout area for a safer entry.
Breakdown: avoid holding longs → prepare for deeper support tests.
Risk management is crucial: use stop-loss and proper position sizing.
---
✨ Conclusion
PEPE is at a major crossroads:
Breakout → upside potential to 0.000030803 (+220%).
Breakdown → downside risk to the historical low around 0.000002573 (−73%).
This is not just sideways consolidation — it’s a decision zone that could define PEPE’s next big move for the months ahead. Traders should be prepared for both scenarios with strict discipline.
---
#PEPE #PEPEUSDT #Crypto #Altcoins #TechnicalAnalysis #Breakout #SupportResistance #DescendingTriangle #CryptoTrading
PEPE; FREE SIGNAL!!!Hello friends
Given the buyers' support for the price and the downtrend breakdown, if the two specified supports are maintained, the price can move to the specified targets.
*Trade safely with us*

PEPEUSDT ( BINANCE:PEPEUSDT ) We have a bullish trend because broke latest trendline and pollback to breakeven.
Please control risk management for buy.
Targets: 0.00001200 - 0.00001280 - 0.00001370 - 0.00001550

PEPEUSDT -the easiest way to get ur capital Tripled!Let me tell you the fastest way to triple your capital at the beginning of 2026.
The CRYPTOCAP:PEPE chart looks extremely tempting right now, and since it’s one of the coins with insane price action, you really don’t want to miss this opportunity.
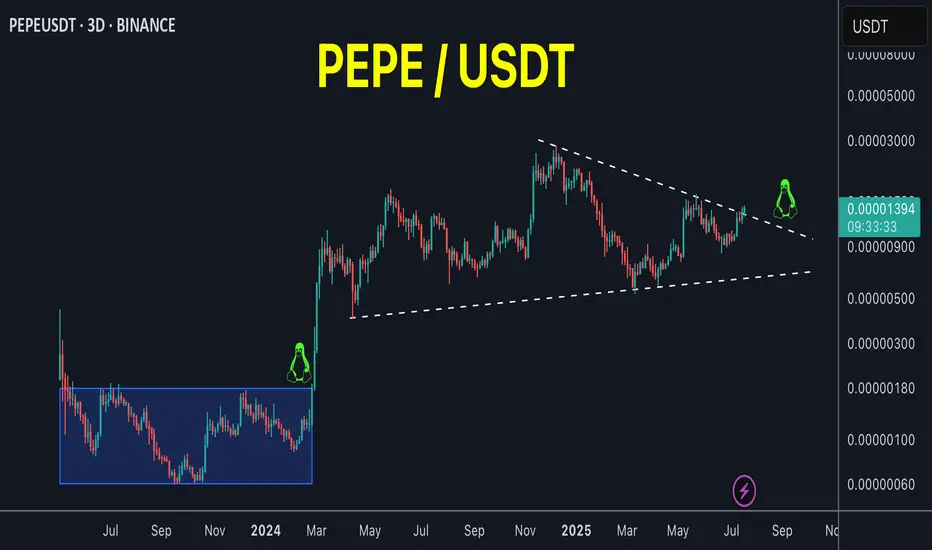
On the 3D timeframe , PEPE has formed a symmetrical triangle three times already—just like the one you see here—and every single time it broke out, it did so with a massive green candle that gave no chance for late entries or deep pullbacks.
Another key point: PEPE is currently in a consolidation range very similar to the one it had in 2024 before its explosive rally. But this time, the accumulation has lasted over 550 days, which makes it even stronger.
Now, here’s the real kicker—the part I’ve highlighted in green for you. If you look closely, you’ll notice that before every major breakout, the EMA 25 and EMA 50 always squeezed tightly together. That exact setup is happening again right now.
PEPE is sitting on strong support, inside a long consolidation range. Don’t miss it. Mark my words: a 3x from here is an easy target by the end of 2025.
Best Regards:
Ceciliones🎯

PEPE UPDATEHello friends
considering the decline we had, we seem to have a buying volume, but it is not yet fully confirmed and we must wait for the support or resistance to break. The targets are specified.
*Trade safely with us*

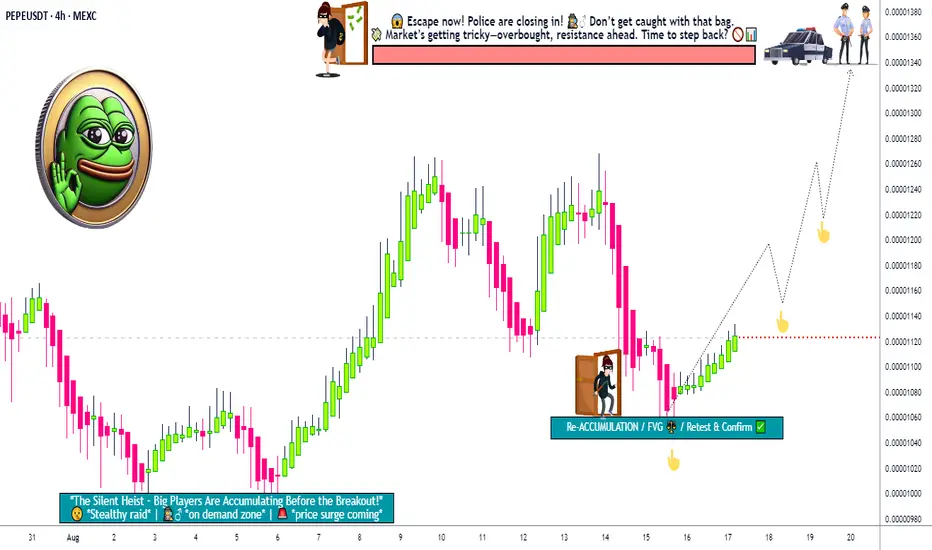
PEPE Bullish Attack Plan – Layer Entry, Escape Before Trap!💚🐸 PEPE/USDT Crypto Market Heist Plan 🕵️♂️💰
🌍 Hello Thief OG’s, Market Robbers & Money Grabbers!
Today we prepare a Bullish Heist on the PEPE/USDT Crypto Market – vault doors are open, the police are distracted, and the layers are waiting! 🚨💸
🏦 Entry Plan (Thief Layer Strategy) 📈
We don’t enter once – we layer like shadows breaking into the vault!
🔹 Layer 1: 0.00001120 (First Dip Grab!)
🔹 Layer 2: 0.00001110 (Double Down!)
🔹 Layer 3: 0.00001100 (Triple the Steal!)
🔹 Layer 4: 0.00001080 (Final Heist Before Escape!)
Add more layers if you’ve got extra bullets in your magazine 🎯🔫
Any price entry allowed if you want to jump in directly – but layering = true thief style! 🕶️
🛑 Stop Loss (Thief Escape Hatch)
📍 SL = 0.00001140 (Default Thief SL)
Adjust based on your personal risk, lot size & money bag capacity 💼💵
Remember: a thief escapes, never gets caught! 🏃💨
🎯 Target (Police Barricade Zone)
🚧 Police waiting at 0.00001400 – DO NOT get greedy!
🎯 Official Thief Exit: 0.00001340 (Escape before they lock the doors)
Grab the loot, disappear into the shadows… 🔐💰
📢 Quick Notes for Robbery Crew
This is a bullish robbery only – no shorting the thief’s plan.
Use multiple limit orders = higher chance of looting success.
Scalpers = small bags, Swing traders = big vaults. Choose your role wisely! ⚔️
💥 Support our Robbery Gang 💥
Smash that BOOST BUTTON so our thief crew grows stronger and wealthier together! 🤑💸🚀
Stay alert thieves, another heist drops soon! 🕵️♂️🐸💎
📌 This is a general market heist plan, not personal financial advice. Adjust your robbery tactics based on your own risk & style.
Critical PEPE/USDT – Bullish Reversal or Bearish Continuation?🔎 Overview
PEPE/USDT is currently trading around 0.000010155, sitting right at a key demand zone (0.00000950 – 0.00001100) that previously acted as a major resistance and is now being retested as support.
This zone is a decision point that will likely define whether the market builds a bullish base for the next leg up or breaks down into deeper lows.
---
🟢 Bullish Scenario
Confirmation: Daily close above 0.000012331 with strong volume.
Upside targets:
1. 0.000014178 (+39%)
2. 0.000015456 (+52%)
3. 0.000016836 (+65%)
Extended targets: 0.000021533 – 0.000026414, with a potential retest of 0.000028364 (+179%).
Supporting structure:
Current zone may act as an accumulation base.
Strong wick rejections with high volume here would signal smart money accumulation.
---
🔴 Bearish Scenario
Confirmation: Daily close below 0.00000950.
Downside targets:
First: 0.00000800 – 0.00000700.
Final target: 0.000005250 (−48% from current level).
Supporting structure:
Failure to form a higher-low will turn this into a descending structure.
Bearish confirmation comes if price retests this zone as resistance after breakdown.
---
📌 Price Action & Pattern
Range-bound: Price has been consolidating between 0.00000950 – 0.00001680, signaling accumulation or distribution before the next major move.
S/R Flip: The yellow zone is a historical level (former resistance, now acting as support). This is the most crucial zone on the chart.
Possible Wyckoff Accumulation: If the zone holds, this could form a spring setup around 0.00000950.
---
🧭 Trading Plan & Risk Management
Conservative Long: Enter after daily close above 0.00001233. SL below 0.00000950. Take profits at resistance levels.
Aggressive Long: Scale in within the current demand zone (0.0000095 – 0.0000101). SL under 0.0000090. Higher risk, higher reward.
Short Setup: Enter on confirmed daily close below 0.00000950. TP at 0.0000070 – 0.00000525. SL above 0.00001100.
Risk Rule: Keep exposure limited (1–2% of capital per trade). Always prepare for fakeouts at decision zones.
---
✨ Conclusion
The 0.00000950 – 0.00001100 zone is the last stronghold for bulls.
If it holds → potential rally up to +170%.
If it breaks → market likely heads back to 0.00000525.
Key: Wait for confirmation, respect stop-loss, and scale out profits at major resistance levels.
---
PEPE/USDT Daily is testing a critical demand zone (0.00000950 – 0.00001100).
➡️ Bullish if it holds, targets up to 0.000014 – 0.0000215 and even 0.0000283.
➡️ Bearish if broken, downside risk toward 0.0000070 – 0.00000525.
📌 This is a decision zone – patience and confirmation are key.
#PEPEUSDT #PEPE #Crypto #Altcoins #PriceAction #SupportResistance #Breakout #Bullish #Bearish #RiskManagement #SwingTrade #CryptoAnalysis

PEPE : GOOD POINTHello friends
Given the good growth we had, the price has now corrected and is in a good support area.
I think if this range is maintained, the price will grow to the specified targets.
*Trade safely with us*

#PEPE/USDT or Breakdown? PEPE Eyes 0.00001166 Target !#PEPE
The price is moving within a descending channel on the 1-hour frame and is expected to break and continue upward.
We have a trend to stabilize above the 100 moving average once again.
We have a downtrend on the RSI indicator that supports the upward break.
We have a support area at the lower boundary of the channel at 0.00000980, acting as a strong support from which the price can rebound.
We have a major support area in green that pushed the price upward at 0.00000990.
Entry price: 0.00001030.
First target: 0.00001075.
Second target: 0.00001120.
Third target: 0.00001166.
To manage risk, don't forget stop loss and capital management.
When you reach the first target, save some profits and then change the stop order to an entry order.
For inquiries, please comment.
Thank you.

PEPEUSDT – Downtrend Breakout & Golden Zone Retest in Play!📊 Chart Analysis:
On this daily timeframe chart of PEPEUSDT, price has successfully broken above the descending trendline that had capped the price since late 2024. This breakout is a strong early signal that bearish momentum is weakening and a potential trend reversal may be underway.
After the breakout, the price is now performing a retest at a key confluence support zone, including:
Fibonacci Retracement levels 0.5 (0.000011580) and 0.618 (0.000010835) — the Golden Zone
Previous horizontal demand zone (highlighted in yellow)
Retest of the broken descending trendline
This retest area will be crucial for determining the next directional move.
---
🐂 Bullish Scenario:
If price holds above the Fibonacci Golden Zone and forms a bullish confirmation candle, we could see a continuation of the uptrend toward:
0.000014191
0.000015000
0.000016836
0.000021533 (medium-term target)
Possibly retesting the High at 0.000028364
This would confirm the start of a major trend reversal and renewed bullish momentum.
---
🐻 Bearish Scenario:
If price fails to hold above the 0.000010835 level and breaks down below the Golden Zone:
Expect a drop toward psychological support around 0.000010000
And potentially further down to the strong support near 0.000007000
Such a move would invalidate the breakout and put PEPE back into a consolidation or extended downtrend phase.
---
🧠 Chart Pattern Notes:
Descending Trendline Breakout
Golden Zone Retest (Fibonacci 0.5 & 0.618)
Potential formation of an Inverted Head & Shoulders pattern (in early stages)
---
🎯 Conclusion:
PEPEUSDT is at a critical turning point after breaking out of a long-term downtrend. If the support at the Golden Zone holds, there is strong potential for a sustained bullish rally. However, traders should remain cautious and apply proper risk management in case of a breakdown below key levels.
#PEPEUSDT #CryptoBreakout #GoldenZoneRetest #TechnicalAnalysis #FibonacciLevels #PEPECoin #AltcoinAnalysis #TrendReversal #BullishSetup #BearishRisk

$PEPEUSDT Breakout: 180% Ahead?CRYPTOCAP:PEPE just broke out of a long-term triangle.
If the move holds, it could pump up to 0.00002313, that’s a potential 180% gain.
Watch for a retest before making a decision.
DYOR, NFA

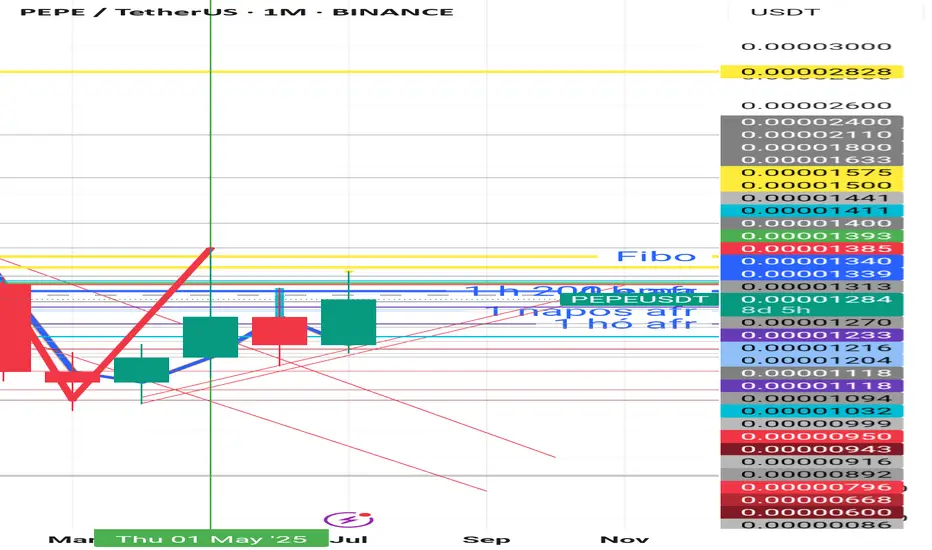
Is the alt season over at Pepe?PEPE
This is not a little suspicious to me. H&S is forming on a 1-month timeframe. I also discovered 4 divergences on a 4-hour timeframe looking back at the past few weeks, which may support my assumption that this is what the off-season was all about and a longer break may be in order.
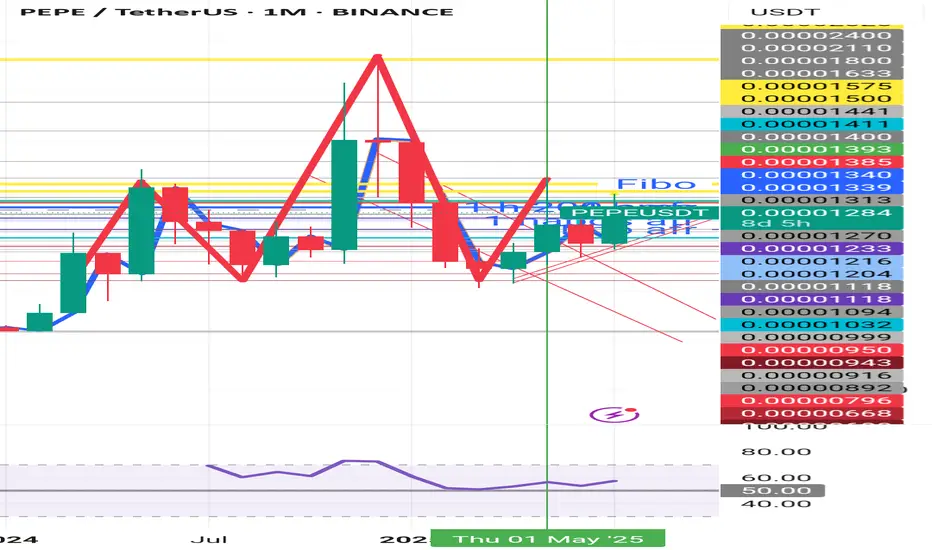
Was that all the offseason was for Pepe?PEPE
This is not a little suspicious to me. H&S is forming on a 1-month timeframe. I also discovered 4 divergences on a 4-hour timeframe looking back at the past few weeks, which may support my assumption that this is what the off-season was all about and a longer break may be in order.
PEPE on the verge of breakout!PEPE / USDT
Price is trying to breakout massive downtrend line since 7 months
Incase of breakout we will see strong bullish momentum
Keep an eye on it
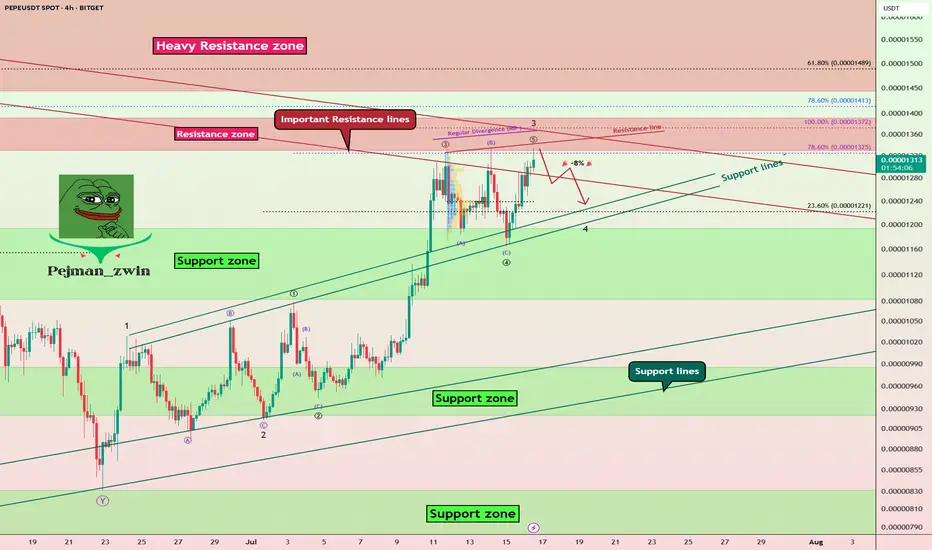
PEPE Faces Key Resistances – Is a -8% Pullback Coming?The PEPE memecoin ( BINANCE:PEPEUSDT ) is currently near the Resistance zone($0.00001392-$0.00001330) and Important Resistance lines . This is the third time that PEPE has attacked the Important Resistance lines .
In terms of Elliott wave theory , it seems that PEPE is completing the microwave 5 of the main wave 3 , so that the main wave 3 is of the extended type .
Also, we can see the Regular Divergence(RD-) between Consecutive Peaks.
I expect a -8% drop for PEPE in the coming hours.
First Target: $0.00001251
Second Target: $0.00001212
Note: Stop Loss(SL)= $0.00001400
Please respect each other's ideas and express them politely if you agree or disagree.
PEPE Analyze (PEPEUSDT), 4-hour time frame.
Be sure to follow the updated ideas.
Do not forget to put a Stop loss for your positions (For every position you want to open).
Please follow your strategy and updates; this is just my Idea, and I will gladly see your ideas in this post.
Please do not forget the ✅' like '✅ button 🙏😊 & Share it with your friends; thanks, and Trade safe.
PEPE/USD Market Heist: Thief Entry Plan for Big Gains🔥🚨 Thieves of Wall Street: PEPE/USD Crypto Robbery Blueprint 🚨🔥
The Ultimate “Thief Style” Trade Setup That Even Wall Street Would Envy
— A High-Risk, High-Reward Playbook for Market Outlaws —
🌍 Hello Global Money Grabbers!
Hola | Ola | Bonjour | Hallo | Marhaba | Namaste 💰🌐
Welcome to the Thief Trading Zone — where smart rebels don’t chase price, they trap it, rob it, and run off with the profits. 🏴☠️
💸 Mission: PEPE/USD Market Infiltration
🎯 Objective:
Infiltrate the PEPE/USD crypto zone where the big bears sleep — and strike long in the danger zone where most traders panic and exit. That’s where we thrive.
🔍 Trade Setup: The Heist Blueprint
Market: PEPE/USD
Play: Long Entry (Thief-Style Reversal Tactic)
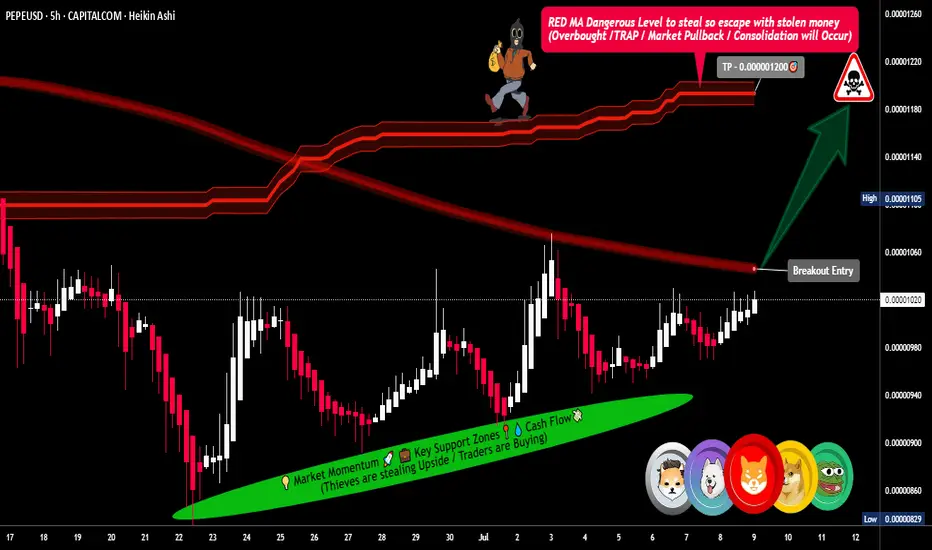
Zone: Red-Hot Resistance Turned Reversal (aka the Profit Trap Zone)
🧨 Entry Strategy:
Wait for the breakout through the Red Moving Average wall at 0.00001060 — that’s your signal the vault is open.
🔑 Execution Plan:
Place Buy Stop Orders just above the breakout level.
Deploy Buy Limit Orders at 15-min/30-min swing lows or consolidation traps.
Use DCA/Layering Entry Style — like a true thief, you never go all in at once.
⚙️ Set Alerts on breakout zones — thieves never sleep on opportunity!
🛑 Stop Loss Tactics (Stealth Exit):
Primary SL: Set just below recent swing low on 5H chart (around 0.00000960).
Wait for the breakout before dropping that SL — don’t get caught too early.
Risk management is your getaway vehicle. Don’t crash it.
🎯 Targets:
Primary Exit: 0.00001200
Optional Early Exit: If the heat’s on, take the bag and disappear. 🏃♂️💨
Always trail your SL to protect your loot.
💡 Scalping & Swing Heist Tips:
Scalpers: Only ride the long waves.
Swing Thieves: Set your traps and be patient — big moves take time.
Big Wallets: Dive in.
Small Wallets: Ride with protection and precision.
🔎 Market Insight (Thief Intel Drop):
PEPE/USD is flashing bullish signals across:
On-chain analytics
COT positioning
Sentiment reversal indicators
Macro economic setups
Intermarket synergy
Get your confirmations before acting — we rob smart, not blind.
⚠️ News & Heat Map Alert:
High-impact news = flashing red lights 🚨
Avoid new positions during major announcements.
Already in the game? Use trailing SL to secure your profits while chaos brews.
🚀 Boost the Robbery!
Smash that Boost Button to join the elite crew of thief traders flipping charts for fun & profit every day. 💎📈
Stay sneaky, stay smart — this ain’t gambling, it’s organized market crimee (the smart kind).
🎭💰 Next Heist Coming Soon — Follow for More Robbery Blueprints! 💣💼
PEPEUSD going to moon according to my analysis. {08/june/2025}Educational Analysis says that PEPEUSD may give trend Trading opportunities from this range, according to my technical analysis.
Broker - binance
So, my analysis is based on a top-down approach from weekly to trend range to internal trend range.
So my analysis comprises of two structures: 1) Break of structure on weekly range and 2) Trading Range to fill the remaining fair value gap
Let's see what this pair brings to the table for us in the future.
Please check the comment section to see how this turned out.
DISCLAIMER:-
This is not an entry signal. THIS IS FOR EDUCATIONAL PURPOSES ONLY.
I HAVE NO CONCERNS WITH YOUR PROFIT OR LOSS,
Happy Trading, Fx Dollars.
