Indicator Divergence and Convergence Reveal Professional TradersDivergence and convergence indicators can help traders identify changes in price momentum and determine which market participants may be controlling price.
For the most responsive analysis, use an exponential moving average (EMA) or another front-weighted moving average. Avoid simple moving averages, which can lag too far behind current price action.
Begin with one primary indicator and one subordinate indicator. Primary indicators analyze price, volume, or both, while subordinate indicators i
Protraders
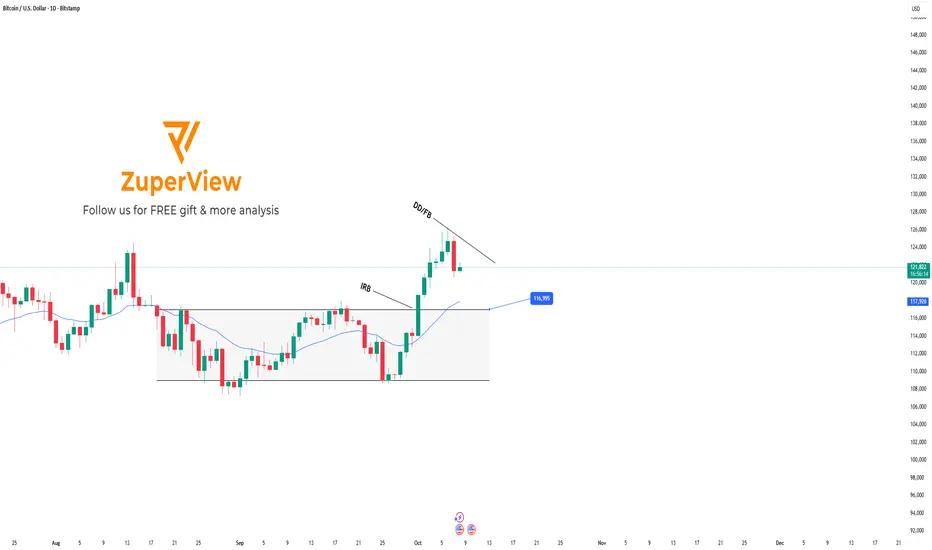
BTCUSD: Short term sell setup - Long term buy opportunity ahead
🔁 Review of Yesterday’s Plan
After BITSTAMP:BTCUSD rallied and set a new high at 126,190, the market entered a corrective phase.
In yesterday’s plan, we expected that:
Once the H1 candle closed below EMA, BTC could continue its decline and retest the lower support zone.
After touching support, price might pause briefly, then break lower to continue the downtrend.
Currently, BITSTAMP:BTCUSD has broken below and is consolidating sideways within a narrow range on H1, aligning perf
How to Trade a Platform: Position-Style Entry and Exit SignalsPlatform Position Style Trading is a trading style that is ideal for those of you who have a career and can only trade once a week to a few times a week. It is also great for retirees who do not want to sit all day monitoring your stocks.
It is a very low-risk trading style with higher profit potential, as the hold time is a week to a few weeks.
The platform is the Buy Zone for Dark Pools who trade OFF the public exchanges on unlit Alternative Trading Venues. There are 50 ATS venues. There are
Ice/UsdtOKX:ICEUSDT
**Ice Coin Overview**
- **Market Cap**: $39.5M 📊
This represents the total market value of all Ice Coin in circulation. It’s a key indicator of the asset's size in the crypto market.
- **24h Volume**: $10M 💵
This is the total trading volume in the last 24 hours. A higher volume usually indicates increased interest and activity in the coin, which could lead to price changes.
- **Fully Diluted Valuation (FDV)**: $126.32M 💎
FDV represents the total value of the coin if all
ILong
Pnut/UsdtBINANCE:PNUTUSDT
"$Pnut is currently priced at 0.7032, but the resistance levels are pretty close—around 0.7545, 0.8433, and 0.9345. 🚧 What that means is that the price is likely to face some strong pushback when it tries to go higher, so don’t expect a massive surge in the short term. ⚠️
If you’re holding $Pnut right now, I’d be careful. 💭 I wouldn't recommend holding it at these levels for too long because it could potentially retrace. Instead, you might want to keep an eye on the support
Why NVDA was not a good candidate for Selling Short last weekBy Friday last week in NASDAQ:NVDA , Support of the Market created an inside day to reversal rebound white candle that engulfed, indicating that the minor drop down out of this trading range was just that: a minor slip of price to below fundamental levels.
Volume was well above average and Volume Oscillators--TSV, TTVA or Chaikin Osc--ticked up along with money inflows. Never assume that a break to the downside from a stable sideways trend is going to continue down. Inside days are no longer a
Beyond Basic Candlestick Pattern AnalysisLearning to Recognize Who Is Controlling the Stock Price
There is a plethora of training on Candlestick Pattern Analysis and interpretation, and yet this remains one of the most problematic areas for Technical Traders who want to trade at the expert level.
Once the basics of Japanese Candlestick Patterns are understood, it is time to move up to the next tier of analysis. That is being able to recognize not only where a pattern is, but also who forms that pattern, why they are capable of creat
REducation
SNPS Breakout Potential to the UpsideNASDAQ:SNPS has been range-bound since 2023 and is finally showing technical patterns that reveal Dark Pool hidden accumulation, pro trader nudges, and the potential for HFTs to gap and run the stock upward.
This stock is setting up to challenge the all-time high. Often in the current Moderately Up-trending Market Condition, HFTs will gap the stock over the resistance level.
So keep the stock on a watchlist to look for pro trader nudges or resting-day candles that indicate the pros are att
Buybacks vs. Dark Pool RotationThis lesson is about understanding the dynamics behind corporate buybacks. Sell-Side Institutions, aka the Banks of Record, have their floor traders do the actual buying of shares on behalf of the corporation. However, the Dark Pools, meaning the Buy-Side Institutions, start selling as the buybacks are going on.
This training will help you enter a buyback sooner and exit with higher profits for swing trading. We'll study the NASDAQ:AAPL chart to identify buyback candlestick patterns and how
HFTs gaps: Learn how to enter a stock before a huge gap up.High Frequency Trading companies are market makers/takers that provide liquidity for the public exchanges, and they now use AI. HFTs have a huge impact on your profitability. You can make higher profits from trading ahead of the HFT gaps and riding the momentum upward or downward.
In this short video, you'll learn some basics on how to identify the patterns that precede HFT gaps, which I call Pro Trader Nudges . Learn what to look for in Volume patterns and pre-gap price action.
Make sure
Dark Pool Buy Zones Explained with Pro Trader Nudge SignalsThis lesson is about how to identify when a hidden quiet accumulation of a stock is underway and how to prepare for the momentum runs that follow. NYSE:DIS is our example for today.
Dark Pool activity is explained in detail. Alternative Transaction System (ATS) Venues are called Dark Pools of Liquidity.
A Buy Zone is an extended period of hidden accumulation of often millions of shares of stock over several weeks to months.
Professional traders use these buy zones to enter on the penny spr
What Is Money Flow In & Out of a Stock? And Why Should You Care?Professionals often speak of money flowing in or out of a stock, but how can that be if there is an equal number of buyers and sellers? It is because “Money Flow” comes from the balance of the lot sizes.
There are four possible positions in any one stock:
Buy
Buy to Cover
Sell
Sell Short
Each investor and trader in the stock has their own separate agenda. Each may come from a different Market Participant Group. There are now 9 Stock Market Participant Groups, starting from those who b
New Technologies Can Push Stocks to New HighsNYSE:CAT easily moved above the resistance highs from March and out of its sideways trading range, making new highs. The white candle on lower volume was interesting: intraday showed pro traders in control toward the end of the day as retail traders and smaller funds started selling prematurely. A resting pattern would be a lower-risk entry to prepare for the breakout.
Caterpillar, Inc. has new technologies coming to market. The company unveiled its new technologies for mining on Sept 24, 2024
$IBM Support Levels HoldingNYSE:IBM did not have a great earnings report for the 1st Quarter 2024, but 2nd quarter improved. The stock has one of the better charts in the Dow 30 components. It has held up better than most of the Dow components, except for those stocks that are in buyback mode. It has been tapering off its buybacks for 2 quarters. So the gains holding above the support lows are not from buybacks. There are accumulation patterns and pro trader activity in the mix. One to watch for swing trading potential
Pro Setups for Swing Trading Ahead of News: TSLANASDAQ:TSLA had a velocity run on the release of its production update for Q2. Velocity runs have gaps between candles which do not overlap. It is a run of enormous speculation to gambling mode and the professionals are taking advantage of it. Notice the pro trader setup candle patterns prior to the retail side getting the news.
Buyback Patterns for Swing TradingNASDAQ:AMGN shows a buyback run followed by a sell day that was instigated by market makers as buyers quickly disappeared. Remember that corporate buybacks are done by bank floor traders to add stock to their inventory so they won't take profits at the peak of the run; those are other market participants, such as market makers.
NYSE:KO is another example of a buyback run and how price moves back down after the professionals conclude their buybacks. The buybacks were announced in May this ye
Swing Trading Setups: TWSTThis is a stock that went on my students' watchlists this week for potential swing trading.
NASDAQ:TWST is coming out of a long-term down-trending correction and has completed the bottom. Accumulation ended and a HFT gap and run up followed on May 3rd. The stock retested the sideways trend highs which are now support for the current price.
Pro traders are swing trading in these patterns. There are fewer wicks and tails and the stock has a very high Percentage of Shares Held by Institution
NVDA Update: How Low Can She Go?NASDAQ:NVDA was over-speculated. It is a component of many ETFs based on all kinds of index funds, from semi-conductor ETFs to Big Blue chip companies, etc.
NVDA was the big loss stock for the NASDAQ on Friday. The huge down day was due to many retail investors and smaller funds running for the door. This has nothing to do with its earnings report. It is a universal panic in the stock market. Pro traders bought the stock in the last few minutes of the trading day. Now the stock is close to be
BA Buy Zone Triggers Short-term ProsNYSE:BA is definitely below its current fundamentals for the 1st quarter of 2024. This was the biggest gain of all the Dow 30 components yesterday.
It was an obvious reversal point at a prior Buy Zone at October's lows. Yesterday was driven by pro traders with a run up at open rather than an HFT gap up at open. We can also see the pro trader nudge pattern in the candlesticks before yesterday's move up.
It may consolidate before running up, but this support level is now established for the ne
NVDA at the CES Ahead of Earnings Next MonthNASDAQ:NVDA moved up on the excitement around AI at the Consumer Electronics Show. We can see that Professional Traders were anticipating a breakout.
The stock should be able to begin some pre-earnings runs soon, as long as revenues and earnings continue to improve.
Volume Oscillators and Money Flow Indicators have been improving as Derivative Developers continued to increase inventory.
Which Robotics Stocks Are You Watching?This stock's pattern is an intermediate-term trend correction to bottom formation that is near completion. It may head sideways for a bit, but when it does breakout of this consolidation, there is potential for swing style runs to develop.
A Dark Pool buy zone triggered at the bottom's lows. And there are Pro Trader footprints in each run out of a new low.
NYSE:ROK is in industrial automation, aka Robotics. There is a huge demand building for manufacturing via robotics in the US as many m
EUR USD Idea Greetings, fellow traders, investors, and enthusiasts! We've been patiently awaiting a short opportunity on EUR/USD for a week, and now we've identified target levels. While we've seen success with bullish trades, we're anticipating a break and downward movement, just as we discussed a month ago regarding this controlled price.
However, the current scenario has EUR/USD and the dollar out of correlation, which isn't our favorite situation. It's the Christmas season, and markets can exhibit natur
Looking Ahead to the 4th Quarter for $DISNYSE:DIS has been working on a bottom for a long time. The stock has moved up recently due to heavy buying of Dow components for the DIA and other ETFs which require Dow components.
Many Families are making Disney Resorts a holiday location this year.
The stock now faces stronger bottom completion resistance from the 2nd quarterly report, which sent the stock moving down further until this October.
The volume is very low recently, which is partly due to the holiday but also warns of weaken