Bearishness to persist on Gold?The Up-move since 28th Sep is basically the corrective rally for the earlier big decline, instead for looking at bullish trades, we should try to figure out the reversal of this corrective rally, it would give better trade with higher accuracy(since the trend is also bearish).
As of the current chart the best setup would be after some more up-move if price retests the bearish trendline and gets rejected like the ones we had seen earlier it would be the ideal situation to take a reversal trade.
Reversalpoint
GIFT NIFTY Testing a Crucial Demand Zone📈GIFT NIFTY at a Critical Support Zone
GIFT NIFTY is currently trading near the lower boundary of a broader falling channel, making this a crucial support area to watch.
Price is approaching a major trendline support.
A short-term corrective structure is also nearing its lower boundary.
The 23,000–23,100 zone may act as a potential reversal area.
Holding above support could trigger a relief rally toward 23,600–23,700 levels.
A decisive breakdown below support may invite further downside
Channel Break & Target Complete ! Now Reversal???SYM Analysis
Closed at 10.43 (01-04-2026)
Completed its Channel Breakdown Target around 10.
Now trading around important Resistance.
Bullish divergence appearing.
Sustaining the current level may lead it towards 12 - 12.50
Breaking 7 - 7.50 may bring more selling pressure.
EURUSD Key Levels: Failure vs Continuation Points Today's focus: Key structural levels that determine EURUSD's next move. No predictions—just price behaviour and structural points.
💡 Trading Philosophy:
"Trade what you SEE, not what you THINK."
This is the foundation of mechanical trading. Stop predicting. Start observing structure and reacting to what price actually does at key levels.
📊 Current EURUSD Structure:
Trading At: 1.17197 (Structural Point)
Key Observation:
We have NOT seen a failure at this level yet. Price is holding structure, w
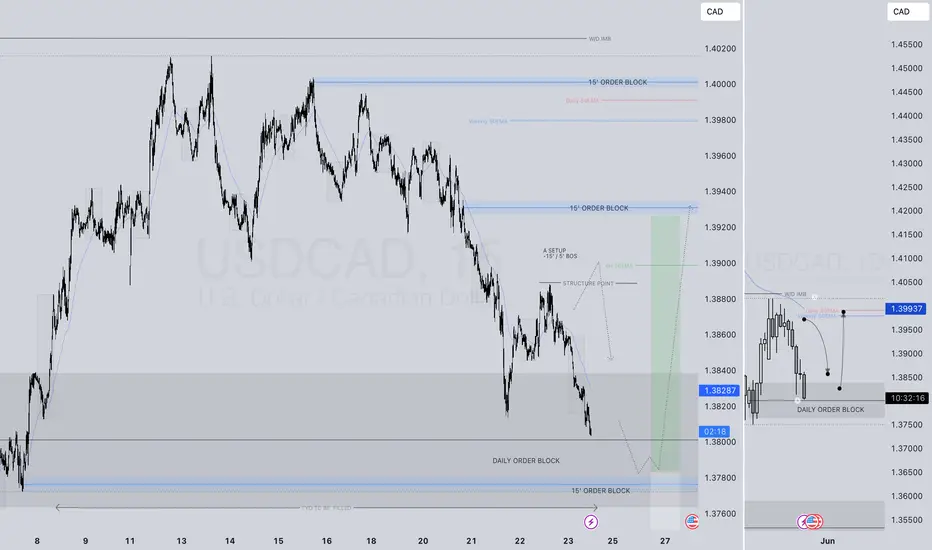
PERHAPS... USDCAD LONG FORECAST Q2 W21 D23 Y25PERHAPS... A REVERSAL BACK TO THE HTF 50EMA's
USDCAD LONG FORECAST Q2 W21 D23 Y25
Professional Risk Managers👋
Welcome back to another FRGNT chart update📈
Diving into some Forex setups using predominantly higher time frame order blocks alongside confirmation breaks of structure.
Let’s see what price action is telling us today!
💡Here are some trade confluences📝
✅Daily Order Block
✅Tokyo ranges to be filled
✅15' order block identified
✅Weekly 50 EMA
✅Daily 50 EMA
🔑 Remember, to participate i
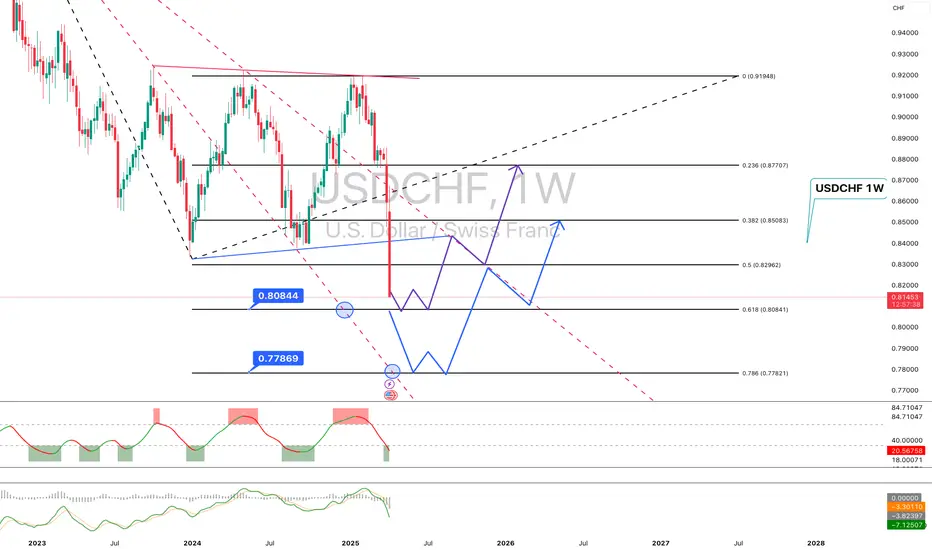
USDCHF (1W) – Preparing for a Potential ReversalThe chart shows strong bearish momentum, but price is approaching a potential demand zone, though it hasn't fully tested it yet. The main focus is on the 0.8080–0.8095 area, aligned with the 0.618 Fibonacci level — a key point where a bounce may occur.
Key Levels:
🔹 Buy Zone #1: 0.8080–0.8095
→ 0.618 Fibonacci, previous consolidation, and a potential reversal point
🔹 Buy Zone #2: 0.7780–0.7800
→ 0.786 Fibonacci, deeper support and lower boundary of the structure
Scenario:
The current st
"Gold Approaching Key Support – Will Bulls Take Control?"🔹 Market Structure:
Gold is currently in a corrective phase after a strong bullish run, facing a pullback from recent highs around $3,160. The price has now approached a key horizontal support zone near $2,980 - $3,020.
🔹 Key Levels:
✅ Resistance: ~$3,160 (previous high)
✅ Horizontal Support: ~$2,980 - $3,020 (marked in blue)
✅ Target Level: ~$3,099 (potential bounce area)
🔹 Potential Scenarios:
1️⃣ Bullish Reversal: If the price finds support in the marked zone and forms bullish confirmation
GBPCAD Analysis - Bearish - Trade 06GBPCAD Analysis Overview
---
1. Seasonality
GBP: Seasonality indicates a **sell** signal for GBP in the first week of December.
CAD: Seasonality suggests a **strong buy** signal for CAD.
Seasonality Bias: Sell GBPCAD
---
2. COT Report
GBP:
COT RSI: 52 weeks at 30%, 26 and 13 weeks at bottom.
COT Index: 3-year at 50%, 1-year at 30%, indicating weak positioning for GBP.
Net Non-Commercial: Decreasing, showing a bearish sentiment.
CAD:
COT RSI: 52, 2
AUDNZD Analysis - Bullish - Trade 07AUDNZD Analysis Overview
---
1. Seasonality
AUD: Strong **buy** signal for the first week of December, suggesting upward momentum.
NZD: Range-bound signal, indicating weaker performance compared to AUD.
Seasonality Bias: Buy AUDNZD.
---
2. COT Report
AUD:
COT RSI : Decreasing from the top but still indicates bullish positioning.
COT Index : Near the top, signaling strong institutional interest in AUD.
Net Non-Commercial : Increasing, aligning with a buy sentiment
Bullish Setup or Bearish Breakdown Ahead?OANDA:GBPUSD - 1Hr Chart
Price: 1.26202
After analyzing the chart, we found RSI in the extreme oversold zone on higher timeframes. Currently, the price is trading above support at 1.25732, which we anticipate as a potential bullish reversal point. However, strong resistance at R1 (1.26953) may cause consolidation and pullbacks around this level. After consolidation, we expect the price to break R1, with the next resistance target at R2 (1.28174). R2 is also a strong resistance, so price may st
NQ Power Range Report with FIB Ext - 9/11/2024 SessionCME_MINI:NQU2024
- PR High: 18847.75
- PR Low: 18826.25
- NZ Spread: 48.0
Key schedule economic events
08:30 | CPI (3x)
10:30 | Crude Oil Inventories
13:00 | 10-Year Note Auction
18400 pivot back towards Keltner average cloud
- Maintaining Friday's 9/6 range
Session Open Stats (As of 12:25 AM 9/11)
- Weekend Gap: N/A
- Session Gap 7/24: -0.32% (open > 19946)
- Gap 10/30/23 +0.47% (open < 14272)
- Session Open ATR: 395.12
- Volume: 30K
- Open Int: 241K
- Trend Grade: Bull
- From BA ATH: -
BTCUSDAfter doing top-down analysis I can see that we've hit the monthly resistance level and was unable to break through it. Although major influencers and government official have spoken about FUSIONMARKETS:BTCUSD going to ATH's as of right now it's not happening. We are in a premium array so i'm looking to short sell for a bit.
Tesla - Fakeout leading to a -50% drop?NASDAQ:TSLA is currently trading at a key inflection level, forming a trend for the next years.
Within a couple of hours, an entire stock can reverse and fundamentally change its trend. Tesla is still retesting a multi-year resistance trendline and is down about -8% today. If this selloff continues and Tesla rejects the resistance trendline with a massive bearish wick, then we will most likely see a correction back to the lower support of the descending triangle pattern.
Levels to watch: $
Gold Hits Record Highs! Skyrocket Further or Sharp Reversal?4-Hour Time Frame Analysis:
Higher Highs (HH) and Higher Lows (HL): The chart displays a clear upward trend with higher highs and higher lows. This indicates a bullish market structure.
Ascending Channel: The price is moving within an ascending channel, showing a steady increase in value.
Key Levels:
1-Hour LQZ / Reversal: 2429.940
4-Hour LQZ / Reversal Point: 2391.394
Potential Take Profit (TP) Levels:
TP 1: 2319.385
TP 2: 2288.085
TP 3: 2267.832
Current Price Action: The price has reached
June seasonality pivot approachingOne of my big technical analysis passions is time analysis and time cycles, and I tend to follow them closely. Some of these are very helpful when in combination with other TA, to find reversal points at any given time frame, even though I don't do intraday trading, so I focus on big swings, though bigger time frames.
Bitcoin's periodicity is remarkable, and we can generally find important pivots points during seasonality shifts. One of these season shifts occur in June and has been occurring f
Shorting USDCNH: Seizing the Opportunity Amidst Long Position...🚨 Shorting USDCNH: Seizing the Opportunity Amidst Long Position Surge 🚨
In this video, I explain why I'm shorting USDCNH due to a significant return of large long positions that we haven't seen in a long time. The 60-day bullish run seems to be over, and we're anticipating a potential drop.
Key points covered:
Analysis of the surge in long positions and its implications
Why the recent 60-day bullish trend is likely ending
Insights into the expected drop and its potential speed
Strategic
Bullish move on reversalPoints of Ethics :-
1) Strong selling at level 441 if price Falls below this level lower level AT 408.30 can be seen and also we have strong buying area at the same level AT price 408.30 so we can see another reversal for the price to move near resistance around 496 to 517
2) If the price does not cross 438.40 then we can see further reversal and we can go long with the target between 75 to 80 points, 496 to 517 considered as retracement zone we also have small resistance near 441 so we can