Will $SAND hit Previous ATH?OMXSTO:SAND Price Prediction 2026: The Sandbox Doubles in 15 Days, Is a 20x Rally Next? 🚀
#SAND price is up ~100% in 15 days after a 99.60% crash from its Nov 2021 ATH of $8.4876 to $0.03251. Here's my full SAND technical analysis, fundamental analysis and funding data.
SAND Technical Analysis:
✅ SAND filled our 2nd Accumulation Zone ($0.049–$0.032)
✅ SAND price is 95% up from the zone
✅ Same 2021 base that triggered a 29,000% SAND rally
✅ SAND/USDT testing the breakout trendline
SAND Macro
SANDUSD
SAND Is Preparing for a Breakout (8H)A trigger line has formed on the chart, and the price below it is showing CP (consolidation pattern). We also have a bullish CH (Change of Character) on the chart, indicating the presence of buyers.
Two entry points have been marked on the chart, and positions should be entered using a DCA (Dollar-Cost Averaging) approach.
Additionally, a liquidity pool is visible above the chart, which may be swept soon.
The targets are marked on the chart, and at the first target, you should move to breakev
SAND Breakout Incoming or Just Another Bull Trap?Yello Paradisers, is this the breakout moment for #SAND we've been patiently waiting for… or just another classic bull trap designed to wreck the impatient ones?
💎After weeks of sustained selling pressure, #SANDUSDT has now formed a clean falling wedge, one of the most reliable bullish reversal patterns in technical analysis. Price action is currently sitting just beneath the descending resistance line, and signs of seller exhaustion are beginning to show.
💎Momentum is starting to shift. The M
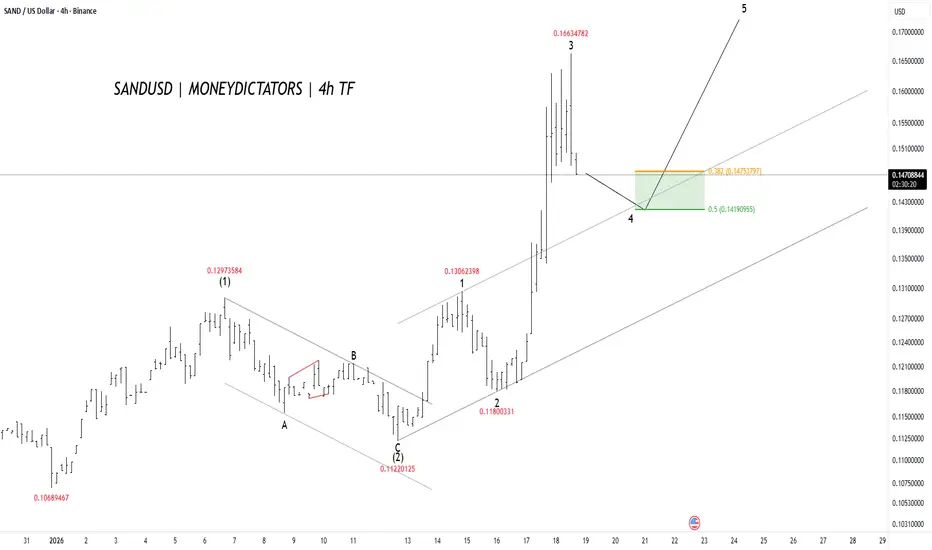
SANDUSD Is Ready for Up MoveSAND is in a strong uptrend on the 4-hour chart. Price has already completed waves 1, 2, and 3, where wave 3 was a sharp and powerful rise. Now the market is doing a small pullback (wave 4), which is normal after a strong move. This pullback is expected to stay in the green support zone around 0.142 – 0.141 (Fibonacci 0.5 area). As long as price holds this zone, the trend stays bullish. After wave 4 finishes, price is expected to move up again into wave 5, targeting higher levels above 0.16. Ove
S
SAND/USDT - Descending Trendline: Breakout or Another Rejection?SAND/USDT on the Daily timeframe remains in a primary downtrend (macro downtrend) after failing to hold previous high levels. Price continues to trade below a well-defined descending trendline, confirmed by multiple rejections, indicating that selling pressure is still dominant.
However, over the past few weeks, price has shown demand reactions at lower levels, suggesting a potential consolidation phase or a technical relief bounce before the next directional move.
---
Pattern Explanation
P
SAND BuyLong Signal (4H)The market maker collected buy orders with a large bearish candle. This was a liquidity grab, as the origin of that bearish move was quickly mitigated.
After taking the low, price quickly reversed to the upside and formed a bullish CH.
We have two entry points and should enter the position using DCA.
There are two targets marked on the chart that we are waiting to be hit.
If you would like us to analyze a coin or altcoin for you, first like this post, then comment the name of your altcoin be
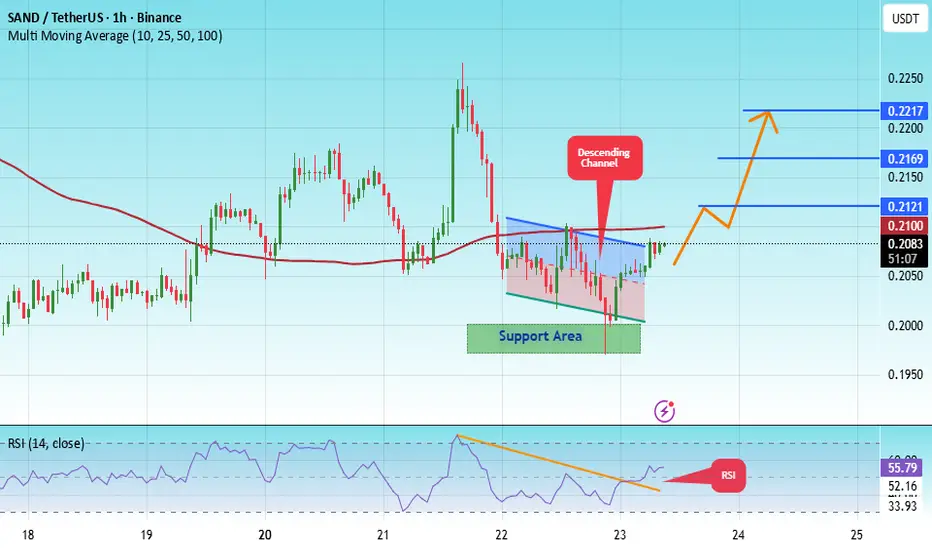
#SAND/USDT PUMP COMING ON SAND! #SAND
The price is moving within a descending channel on the 1-hour frame, adhering well to it, and is heading for a strong breakout and retest.
We have a bearish trend on the RSI indicator that is about to be broken and retested, which supports the upward breakout.
There is a major support area in green at 0.1980, representing a strong support point.
We are heading for consolidation above the 100 moving average.
Entry price: 0.2080
First target: 0.2121
Second target: 0.2170
Third target: 0
#SANDBOX #SAND #SANDUSD #SANDUSDT #Analysis #Eddy#SANDBOX #SAND #SANDUSD #SANDUSDT #Analysis #Eddy
A reversal structure has formed on the weekly and daily time frames, and the necessary confirmations have been given on the weekly time frame. Considering the structure formed on the above time frame, as well as the behavior of this currency in the past chart, it is expected that this currency will perform a good pump.
I have identified the important supply and demand zones of the higher timeframe for you.
This analysis is based on a combinat
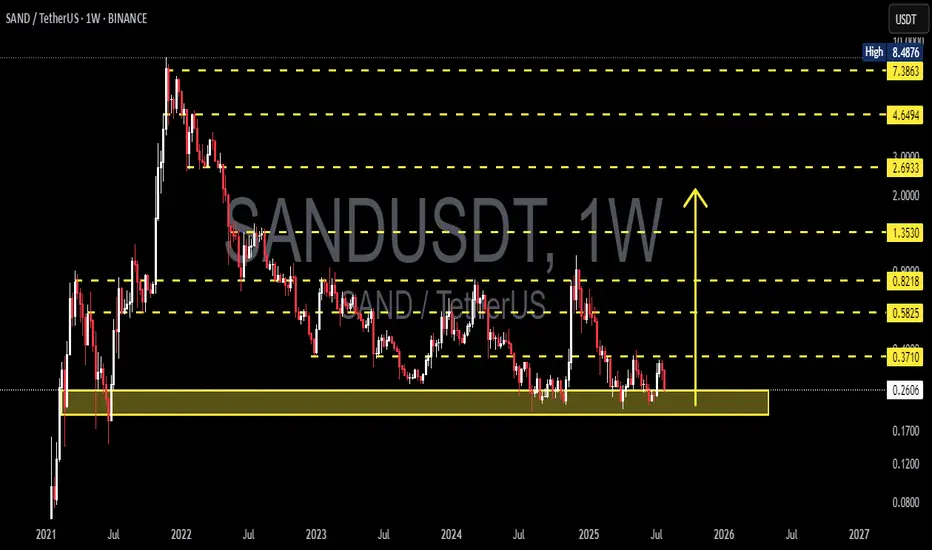
SAND/USDT Analysis – Major Accumulation or Imminent Breakdown?🔍 Overview:
SAND is currently trading at a crucial historical support zone, which has held firm multiple times since mid-2022. The chart shows a prolonged accumulation phase, offering significant potential for a major breakout or a decisive breakdown depending on market reaction.
---
🧠 Price Structure & Price Action:
After reaching an all-time high at $8.4876 in late 2021, SAND has been in a long-term downtrend.
However, over the past year, it has formed a wide base around the $0.26–$0.37 r
SANDUSDT Breaks Major Downtrend – Golden Pocket Retest!
Technical Analysis:
SAND/USDT has successfully broken out of a descending trendline that had been capping the price since late 2024. The breakout occurred with increased volume, signaling strong buyer interest.
Following the breakout, price rallied and is now retesting a key support zone, which includes:
A demand zone (yellow box) between 0.2748 - 0.2885, aligning with the Fibonacci Golden Pocket (0.618 - 0.5)
A solid horizontal support around 0.2913
Fibonacci retracement levels are clear
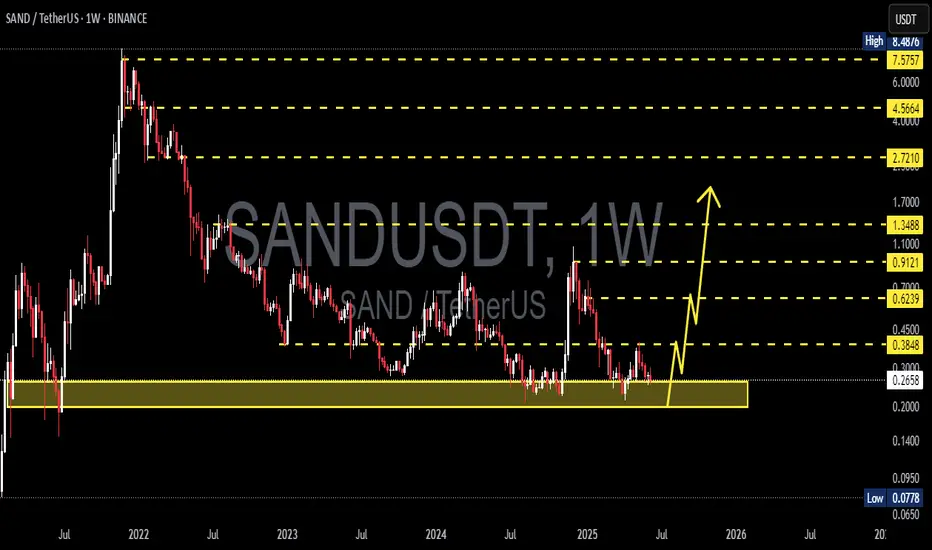
SAND/USDT at Critical Support Zone – Rebound Potential?Detailed Technical Analysis:
The SAND/USDT weekly chart shows the price currently hovering around a historically strong support zone between $0.20 – $0.25. This yellow-marked demand area has been tested multiple times since 2021 and has consistently prevented further downside, making it a crucial decision point for both bulls and bears.
🟢 Bullish Scenario:
If the price manages to hold this key support and prints bullish price action (e.g., a bullish engulfing or hammer candlestick), a revers
SANDUSD targeting the 1day MA200 at 0.42000Sandbox / SANDUSD has entered a Channel Up structure ever since it double bottomed on Support A and crossed above the Falling Resistance.
Now it's supported by the 1day MA50 and is aiming at a new Higher High on the 1day MA200.
Target 0.42000
Follow us, like the idea and leave a comment below!!
#SAND/USDT#SAND
The price is moving within a descending channel on the 1-hour frame and is expected to break and continue upward.
We have a trend to stabilize above the 100 moving average once again.
We have a downtrend on the RSI indicator that supports the upward move with a breakout.
We have a support area at the lower boundary of the channel at 0.2790, which acts as strong support from which the price can rebound.
Entry price: 0.2828
First target: 0.2890
Second target: 0.2971
Third target: 0.3048
SANDUSD: The recovery back to 1.07350 has started.Sandbox (SANDUSD) is marginally bearish on its 1D technical outlook (RSI = 43.227, MACD = -0.001, ADX = 35.488) as it dropped below its 1D MA50 again. However, the breakout over its 5 month LH trendline has already happened and calls for a long term recovery. As you can see the Fibonacci retracement levels form fairly symmetric Resistances with the previous LH levels, so we expect them one by one to get filled (final TP = 1.07350).
## If you like our free content follow our profile to get mor
#SAND #SANDUSDT #SANDBOX #LONG #SWING #AMD #Eddy#SAND #SANDUSDT #SANDBOX #LONG #SWING #AMD #Eddy
SANDUSDT.P SWING Long AMD Setup
Important areas of the upper time frame for scalping are identified and named.
This setup is based on a combination of different styles, including the volume style with the ict style. (( AMD SETUP ))
Based on your strategy and style, get the necessary confirmations for this Swing Setup to enter the trade.
Don't forget risk and capital management.
The entry point, take profit point, and stop loss point are in
$SAND Sandbox Over 70% Retracement... Ready for Higher?NYSE:SAND Sandbox has committed a over 70% retracement after superbuy signal from a height of approximately $1
Current Price: $0.36
Price action is forming a Falling Wedge and Bullish Divergences Spotted also
Expecting a retest of previous supports - now resistances at 0.41, 0.54, 0.7, 0.82, 0.96
#sand Invalidation is at under 0.3
SAND → 𝐁𝐮𝐥𝐥𝐢𝐬𝐡 𝐏𝐫𝐞𝐬𝐬𝐮𝐫𝐞 !!!Buy at 37 cents and sell at 41 and 56 cents . This signal is only valid for 2 days.
Give me some energy !!
✨We spend hours finding potential opportunities and writing useful ideas, we would be happy if you support us.
Best regards CobraVanguard.💚
_ _ _ _ __ _ _ _ _ _ _ _ _ _ _ _ _ _ _ _ _ _ _ _ _ _ _ _ _ _ _ _
✅Thank you, and for more ideas, hit ❤️Like❤️ and 🌟Follow🌟!
❗Disclaimer
⚠️Things can change...
The markets are always changing and even with all these signals, the market changes tend to b
Will SAND Make a Comeback or Sink Lower? Yello, Paradisers! Are you ready for what could be a make-or-break moment for SAND? Let’s dive into the details to ensure you don’t get caught on the wrong side of the market.
💎#SANDUSDT is approaching a key support level at $0.4787, a zone that has historically acted as a springboard for bullish momentum. This level has been tested multiple times, showcasing its strength. However, if this support fails to hold, it could trigger a wave of selling pressure, potentially dragging the price down