Bullish Candlesticks Pattern on EURUSDOANDA:EURUSD
Bullish Candlesticks identified on a short duration of OANDA:EURUSD .
Search in ideas for "CANDLESTICK"

Bullish Candlesticks Pattern on ETHBINANCE:ETHUSDT
Bullish candlesticks identified on #Ethereum weekly chart.

Bullish Candlesticks Pattern on BTCBINANCE:BTCUSDT
Bullish candlesticks identified on BTCUSD chart for reversal highlighted in a short term duration.

APD Candlestick Pattern AnomalyAPD is an S&P 500 index component. APD has a highly unusual inverted candlestick pattern suggesting hidden momentum. Usually candlesticks shrink in size as a stock runs up over an extended period of time. APD candles are much larger at this level than at previous price levels below.

USD/NOK Short . H&S , Trendline & Candlestick.I'm Trading this based on the head & shoulder pattern , candlesticks & trade line pattern .

BTC Bearish 1H CandlesticksBitcoin could not break the previous high and now is forming bearish candlesticks. Bitcoin formed two spinning tops, which shows uncertainty on whether the trend would continue, but it is followed by a evening star, which suggests that the trend may reverse.

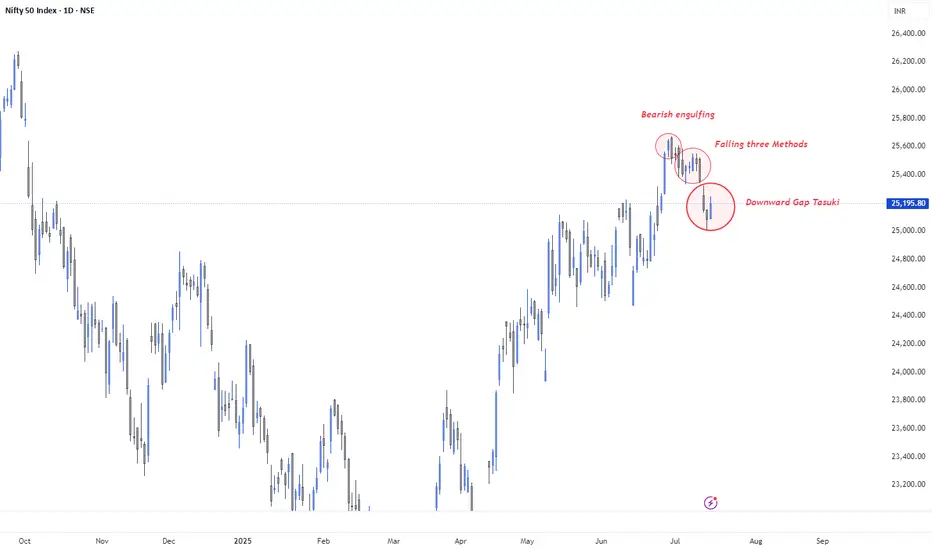
Candlestick Confluence: Bearish Signals in a Bullish Trend🔹 30 June – Bearish Engulfing
A large bearish candle fully engulfed the prior bullish day, forming at new highs (~25,790). Classic sign of distribution after an extended uptrend. This marked the beginning of the current corrective leg.
🔹 3 to 10 July – Falling Three Methods
After the initial drop, price consolidated in a tight range. Three small-bodied candles (4–9 July) signaled indecision. On 10 July, a strong bearish continuation candle confirmed the Falling Three Methods pattern — strengthening the downside move.
🔹 15 July – Downward Gap Tasuki
A bearish gap formed between 12–14 July. On 15 July, a small bullish candle emerged but failed to fill the gap — forming a Downward Gap Tasuki, a bearish continuation pattern. While this is typically a trend-continuation signal, it's forming within a primary uptrend, making follow-through uncertain.
🧠 Trend Context: Bullish Dominance Meets Short-Term Exhaustion
Despite these bearish candlestick formations, the broader trend from April remains structurally bullish. This confluence of reversal + continuation signals indicates:
Controlled profit-booking at highs
Low conviction from bulls near resistance
Possible mid-trend correction, not a trend reversal (yet)
🔎 Key Technical Levels to Watch
📉 Support Zones:
25,050: Immediate swing low (14 July)
24,850: Prior breakout zone
24,600: Horizontal support from mid-June
📈 Resistance Zones:
25,300 – 25,350: Gap resistance from 12–15 July
25,500: Key rejection zone from recent highs
25,650 – 25,700: All-time highs
⚠️ Market Psychology
Bulls are still in control on the higher timeframe, but the emergence of strong bearish patterns suggests hesitation at the top.
With Indian CPI easing and RBI’s neutral stance, macro still supports the bullish narrative — but the technical structure is flashing red flags in the short term.
🧾 Conclusion
"Nifty Spot has printed a sequence of reliable bearish candlestick formations — Bearish Engulfing (30 June), Falling Three Methods (3–10 July), and Downward Gap Tasuki (15 July). While these indicate short-term pressure, the broader uptrend remains intact. A close below 25,050 could trigger a deeper correction to 24,850–24,600. Bulls need to decisively reclaim 25,400+ to nullify the bearish setup and resume the uptrend."
#Nifty50
#NiftyAnalysis
#NiftyTechnicalAnalysis
#NSEIndia
#IndianStockMarket
#BearishEngulfing
#FallingThreeMethods
#TasukiGap
#CandlestickPatterns
#PriceAction
Mastering Candlestick Patterns for better trades!Candlestick patterns are a powerful tool for identifying market sentiment and potential reversals. Let's break down some key single and double candlestick formations seen in this chart:
🕯️Single Candlestick Patterns:
- Doji – Represents indecision in the market, signaling a potential reversal.
- Inverted Hammer – A bullish reversal pattern after a downtrend, indicating buyers are stepping in.
- Long-Legged Doji – Suggests market uncertainty; watch for confirmation before taking a position.
- Bearish Closing Marubozu – A strong bearish signal showing sellers' dominance, with no upper wick.
- Bullish Opening Marubozu – A strong bullish candle with no lower wick, signaling a potential uptrend.
🕯️Double Candlestick Patterns:
- Bullish Engulfing – A strong bullish reversal pattern where the green candle fully engulfs the previous red candle, signaling buying pressure.
- Bullish Harami – A potential trend reversal where a small green candle is "inside" the previous large red candle, indicating a slowdown in selling.
- Cross Doji – Suggests hesitation between buyers and sellers, often appearing before a reversal.
How to Use Them in Trading?
✔️ Combine candlestick patterns with indicators like RSI, MACD, or Moving Averages for stronger confirmations.
✔️ Look for patterns near key support and resistance levels to increase reliability.
✔️ Always wait for confirmation before entering a trade!

LONG - GBPNZD - 1H - (CANDLESTICK with DOW THEORY)Instrument:- GBPNZD
Position:- Long
Timeframe:- 1 Hour
Method:- Dow Theory + Candlesticks
Reason:-
Multiple bullish candlesticks ( Candlestick analysis)
Price in Uptrend with Multiple Higher highs and Higher Lows with no break in the uptrend (Dow theory)
Entry @ CMP (1.952)
Take Profit @ 1.96193
Stop loss @ 1.94880
RR:- 2:1

Price Change:+0.08 + Hammer Candlestick Pattern🔨 Hammer.
That's the name of this candlestick.
I have some sad news sad very sad.i lost a business partner.Now I have no choice but to use forex trading as a source of income.
It's crazy that I mastered forex trading as soon as this partnership has ended 😢 it's crazy how God works.
Just when I thought I am finished just when I thought trading is fake.Then boom 🤯...
I have now mastered forex trading.
My partner is gone because of marriage and pursuing academia studies.
All I have is this trading skill set .
I decided not to pursue academia and decided to invest in trading education honestly I didn't think I would even understand this.
The Brain 🧠 is a unique organ built to not only protect you but help you it's your biggest investment.
This pattern has "touched " support 💪that's the key... make sure it touches support and closes above the 20EMA.
If you do this then you will master the secret to price action.
Trade safe.
Check out the Trading Secrets Series Below 👇 For a Full Break down of this trading strategy.
Disclaimer ⚠️ Trading is risky please learn about risk management and profit taking strategies .
Also feel free to use a simulation trading account before you use real money.

NZDCAD 1 Hour Looking for CandleStick Patterns Three Black CrowsNZDCAD 1 Hour Looking for CandleStick Patterns Three Black Crows
For better entry at Lower High levels

MAHSING - BULLISH HAMMER CANDLESTICK ?MAHSING - CURRENT PRICE : RM1.81
MAHSING is bullish as the share price is above 50 and 200 days EMAs. After declining for two days, today the stock made a bullish hammer candlestick. This scenario may indicate that potential bottom had reached. Aggresive trader may decide to buy on this hammer candle.
ENTRY PRICE : RM1.79 - RM1.81
TARGET PRICE : RM1.92
SUPPORT : RM1.74 (the low of hammer candle)
Notes : MAHSING forged key partnerships with Bridge Data Centres (BDC) to drive the development of state-of-the-art data centre facilities. The Mah Sing DC Hub@Southville City, Bangi currently holds 300 MW of secured power capacity, with an additional 200 MW earmarked for future collaborations, solidifying its role as a major regional data centre hub.

USDCHF CandleStick PatternHad to mark up a candlestick pattern...a huge 4 HR one of a 1 HR chart. It would have been a huge profit for those that would have got into a sell. For FMI (Forex Mastery Institute Studies).

Extremely Rare Candlestick Pattern on the Gold Daily ChartThe Three Stars in the South candlestick pattern is a very uncommon bullish reversal pattern. I've only ever seen it complete on the daily timeframe one other time in my career - when Tesla went on its truly parabolic run from 1300 - 3000+. See related idea.
Seriously, that's the last and only time I have seen this on a daily chart without it being a historical reference in a textbook. The pattern is seldom mentioned due to its infrequency (and thus its inapplicability to beginner-level traders), but the market analyst, Thomas Bulkowski, was able to find a few examples and define the pattern concretely. Some of the statistics mentioned in his candlestick encyclopedia:
Three Stars in the South:
a) has an approximate frequency of 4 candles for every 9 million that print
b) results in a strong bullish reversal 100% of the time it forms on a significant timeframe (believe it is daily and higher)
Anyways, just thought I'd mention since I did say Gold could approach a much higher target in the near future.
-ThreePigsInTheSouth
FOREXCOM:XAUUSD
FX_IDC:XAUUSD
TVC:GOLD
TVC:DXY
TVC:SILVER

MSFT: Candlestick Patterns Reveal BuybacksMSFT shows the classic candlestick patterns of a major buyback underway. The intent of buybacks is to increase the price of the stock and reduce the number of outstanding shares in order to improve the EPS. Corporations generally use the bank of record to do the actual buying of the shares of stock. These are usually done via Price and Volume weighted orders which trigger on both volume and price rising.

Litecoin, and the "Falling Three Methods Candlestick Pattern"On November 27th, 2023 the “Collapse to $30” idea was published (below). The idea was met with some rebuttal, shall we say.
The evidence for a collapse in Litecoin price action has only grown in the past few months.
A new candle prints on the above 2-month chart in 14 days. If it prints as is, it will be a Gravestone DOJI. Such candlesticks on this timeframe represent significant profit taking and selling pressure.
The yellow arrows identify bearish engulfing candles. The last one printed on September 2023, confirming legacy support as resistance.
The print was followed by three green candles. Do you recognise them? And the red one that now follows it?
This candlestick pattern is called the “Falling Three Methods Candlestick Pattern”. It is a continuation pattern. When three Green candles in-between the bearish engulfing and DOJI are unable to close above the bearish engulfing candle, a significant sell off prints. Overall the pattern is informing you of the inherent weakness in price action.
Litecoin bulls, you’ve been warned!
Ww

Candlestick formation contextIn using trading concepts like Candlestick formations it is very important to look at the context and not just blindly go short or long as these get printed on the chart. In this example, I am looking at a weekly candlestick formation spinning top on EUR JPY. Spinning tops or bottoms are labeled as indecision patterns or reversal patterns. In this video I am going through the importance of context when looking at candlestick formations.

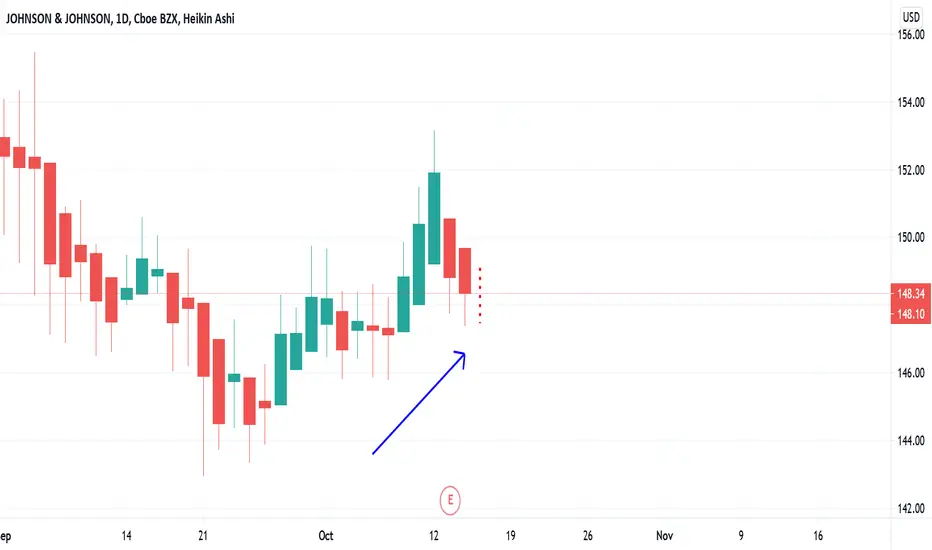
JNJ Daily Candlestick Prediction Here is my Daily Candlestick prediction for Johnson and Johnson. So far I am 1 for 1 on my daily candlestick predictions for this company. Proof is linked below! Feel free to follow to get daily candlestick predictions that are accurate ( most of the time )
UTX Huge Black Candlesticks May Be Precursor to More DownsideWhite candlesticks are small, weak, & irregular in trend pattern. Suspended Buybacks in 2017, reason was too much debt. Shifted into a Trading Range that dropped sharply in Nov.-Dec. 2018. No Dark Pool Quiet Accumulation in the bottom, Small Funds buying caused move up.

BTCUSD - Trend reversal signal just by 3 candlesticks!This short segment is on candlestick and multiple time frame analysis.
As a trader or trader wannabe, this is an important lesson that goes a long way. Trust me, it may sound simple but it actually took me a long time to grasp the full concept and then apply it in my trading.
This is BTC on the weekly time frame, if you are scalping the market or even just day trading, you don't really need to take reference with this time frame. Large time frame such as Weekly and Monthly are mainly used for position trading and intraday movement don't really affect this type of trading. What confuses me at the beginning was the expectation as to when price movement will occur. Has it even happen to you somebody tells you that you are trading on the wrong time frame?
So back to BTC, which enjoy such a good bull run from April to end May, a series of long green bullish candles. On 27 May close, we see a small skinny candle, yes traders should know this is called a Doji candle. What this tells me is the sellers are coming in and buyers are being challenged. One way of intepreting the psychology of those traders that bought BTC at say $5000: "Come on, price is already so high! Shouldnt we be thinking of taking profit already?" Hence, a Doji is an indication of indecision in the market and there is no clear direction.
Let's look at the next candle that closed on 3 June, a convincing Bearish Red Candle. Not only is this candle long, it also has no upper tail and look where it closes, covering the whole Doji candle. This is a clear signal that the Bears won and the "Big Picture" (Weekly Time frame) uptrend has ended. Having said that, do I just go in blindly and short BTC? Of course not, there are much to it in trading and alot depends on your trade portfolio and objectives. I am ready for the next move, have you plan out yours? :)
Do like and share this post. I use a combination of trading strategies such as Supply & Demand ( SND ), Harmonics Patterns, Multiple Time Frame Analysis , Candlestick Analysis to name a few. Follow me if my trading style suits you as I will be posting new trade ideas and analysis regularly.

Candlestick ConfirmationsWe can clearly See the area will work as resistance and there are candlesticks (Bearish Engulfing) which we can see.
Gratify if you appreciate the practice then you can like it, share it and
If you want me to investigate any chart for you then would cherish doing that for you.
Thank you for your time and support.
Stay safe.

CandlestickBibletradingWe still hold a bullish buy for gold after a period of consolidation the price is likely to continue with the uptrend.
The 20 and 50 Ma are offering a strong support for Gold to continue its uptrend
FOREXCOM:XAUUSD

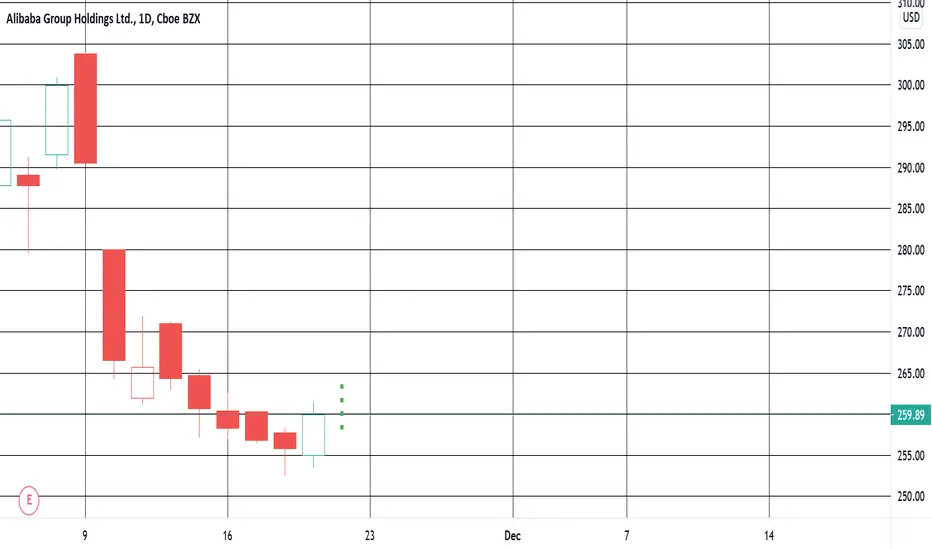
Daily Candlestick Projection For FridayMy favorite analysis is candlesticks, they really help me in a pinch when I don't know if I have bottomed out to buy in or topped out to sell out. For the daily analysis this is to support my thesis on my BABA $270 call by 12/18