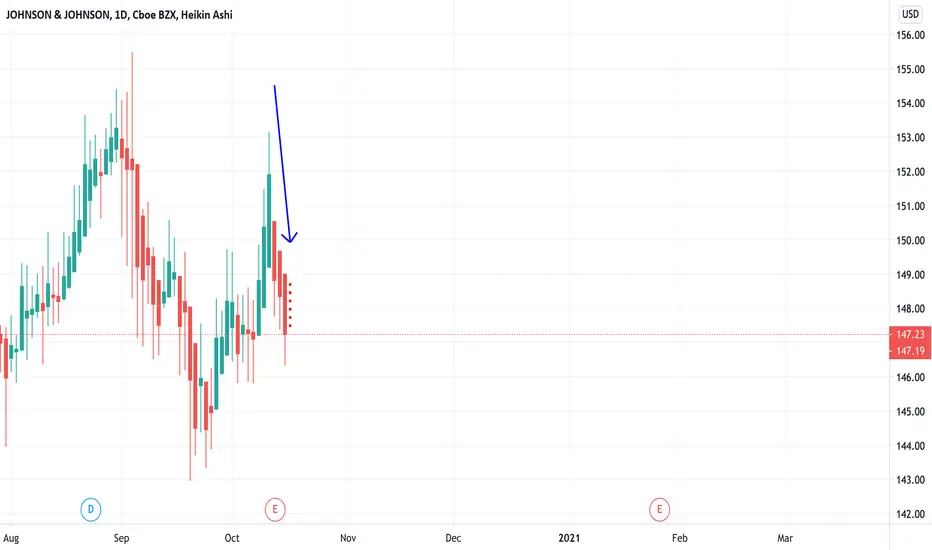
JNJ daily candlestick projection So far I am 2 for 2 in my candlestick analysis for Johnson & Johnson, here is my Friday Prediction. 2 for 2 proof below, stay tuned.
Search in ideas for "CANDLESTICK"
HOW CANDLESTICKS CAN HINT A BOTTOM - ANALYSIS!**NOT A RECOMMENDATION TO BUY**
A single candle by itself is rarely sufficient reason to forecast an immediate reversal. It could, however, be one clue that the prior trend may
be changing. HERE in this chart a Hammer that formed after an extended sell off hinted sth is cooking for the HINDZINC stock as the bears tried to push the stock lower after a large hammer is formed ,bulls defended and came out successfully holding the bottom that was tested by hammer , In Japanese terms hammer implies to market to be testing the depth of the water! Long white candlestick (BULLISH) on a higher timeframe neat the bottom range of the established hammer showed that bulls are coming back in force to absorb all the selling force and successfully defended as shown in the chart of Hindusthan Zinc .
Small body candles denoting high wave,inverted hammer and spinning tops with high volume sessions indicated the accumulation of the stock while the prices went to test the hammer!
all the above factors combined with a trendline break and the prices failing to reach the lower end of the channel showed that a rally is to be expected & on the break of resistance zone 150.2 and it did breakout with a strong white candle showed an BUY oppurtunity!
price's holding with volume and long shadow with smaller bodies after appearance of hammer all signified the bulls are taking charge through accumulation on reaction to the hammer signified a wothwhile watch!
this can provide a meaningful insight for future analysis in a different stock and sector is the essence behind sharing this analysis!though it is past it can repeat in some other scrip so that there shows a valuable signal to BUY!

HG Short: Short-term Candlesticks AnalysisCopper, the base metal that I suggested to long in my previous idea but now I am eating my words back. The reason? Friday's move down. As I pointed out in the chart, there is a reversal candlestick pattern (bearish engulfing) and then there are 3 Dojis with higher upper wicks. Also in my chart, I showed that the previous wave is, in fact, corrective. Thus, I am giving this short idea on Copper. On the short-term at least, I believe there are more downside still.

Candlesticks on AUD Showing Signs of Bulls Stepping inI got stopped out of my long AUDUSD trade recently, unfortunately, but to me the pattern still seems valid. And so I'm going long AUDCAD. I think the recent hammer candlestick is a sign of bulls stepping in and defending 1.0153, and so I've set my order to go long at 0153 with my stop at 0094 and my target profit at 0335.
www.informedtrades.com


Netflix Buy Alert!! The Rising 3 Soldiers Candlestick Patterns I did my first stream about two days ago.I was so sacred and nervous.
"This is a public stream, I better make sure I know what am talking about. I better make sure I show the pips my very best setups for trading."
I tell you I was super depressed because I want to be a good trading leader.
So I have been grinding trying to make sure I perfect my trading strategy and system and skills.
Because I want to show you the best of the best trades I can find.
No more just forex...or stocks I just want to be a great
technical analyst.
So today I did another stream and I had one person watching me trade live.
If you watch me trade analysis live you will really enjoy it 👍😊
It was an awesome stream.This is my business goal to become a streamer.
But am hoping for more viewers tomorrow.
Look at Netflix NASDAQ:NFLX
It's
Above the 50 MA
Above the 20 EMA
Above the 200 EMA
Notice the rising 3 soldiers 🟩🟩🟩Bullish candlestick patterns?
Notice how the last green candle
Gaps up? In green 🟢
The candlestick patterns are your confirmation of entry.
Netflix also has an earnings report coming soon.
This makes it's a perfect candidate for what Tim Sykes calls an earnings winner.. according to his book penny stock guide.
They are rumours that Netflix will partner with Warner Music to make movies based on it's artists such as Bruno Mars.
This report hasn't been confirmed yet.
Do you see how pop culture is linked to the financial markets? Like I told you yesterday?
This is a great stock to trade and ride the 🚀.
Rocket Boost This Content To Learn More.
Disclaimer ⚠️ Trading is risky please learn about risk management and profit taking strategies.Also feel free to use a simulation trading account.

Candlestick dataTarget hit and the doji candlestick is providing us with the impression that the bearish move has lost its momentum, however, this shooting star candlestick is saying otherwise. If the market doesn’t respect this immediate demand zone then the second one shall be the key to go impulsively bullish…
Candlestick Bible Review pin bar candlestick with the trend In this example we are going to go over Trading the pin bar candlestick with the trend this example is trading with restance level and seeing pin bar set up

Candlestick Bible Review Pinbar in downtrend In this video we will be going over The Pin Bar Candlestick Pattern Strategies
If the formation of this candlestick occurs near a resistance level, it
indicates that the bears reject prices, and prevent the bulls from
breaking this level. So, this means that sellers are willing to push the
market downward.

Candlestick Reversal Patterns, Indicators, or Both?This chart demonstrates beautifully how better results might be obtained by using candlestick reversal patterns instead of just blindly following a lagging indicator.
DISCLAIMER: This is not a trading strategy or plan that anyone should use out of the box. This is not investment advice, but please establish your own entry and exit rules for the securities you want to trade. And, ideally, back test, and forward test them.
EXPERIMENT: Here, I am using a triangular moving average (TMA) with standard deviation bands. I thought I was very original with my TMA. But it turned out to be very similar to the popular, Chris Moody's CM Ultimate . But the TMA has been around a long time, so that figures. Not to be outdone so easily, I thought I'd try and see what it looked like by adding bands. But setting up the parameters is very subjective. I chose a length that I think lines up best with the trends that I want to capture. Then I set the bands such that they encompass most of the price action. It's not like Bollinger Bands that pretty much work with default settings every time. If there is enough interest though, I will consider releasing the indicator.
Notice that even with optimum settings, identifying candlestick reversals could identify a change in direction prior to the indicator. Yet using an indicator like this does help me to identify where to look for reversal patterns. I want to see candles with long tails, or candles that reverse the high or low. I also want to look back for areas of previous Support and Resistance, volume, shorter candles, and trend lines to anticipate where a reversal pattern may occur. Consolidations inside the wide bands or near the moving average are other places to look. Multiple points of confirmation could assist in identifying where to look for good trades and stops that best fit the overall position sizing and trading plan.
Note: I am neutral on DOG because the pattern looks incomplete to me. At my level of experience, I like to see a bit more confirmation.
What do you use? Candlestick patterns, indicators, or some other combination? I am just getting started with this. But I hope this helps you in your endeavors. Keep looking through charts in addition to studying patterns to become a master at identifying these reversals. If you have any other ideas to improve, please let me know in the comments.
Here's to your success!

Sell confirmation. The daily candlestick closed, it's entry timeThe is a reversal candlestick on the daily chart ,spinning top ,which confirms the sell on daily chart.double top on daily that confirms the sell.thereversal candlestick on daily chart closed giving us a perfect time to enter a sell.

Anatomy of a Japanese CandlestickIts intriguing that two candles with the exact same body and wick measurements, even with all the indicator values matching, can actually encompass price-momentum towards opposite directions.
I have outlined two possible scenarios per each candle type. Note that regardless of the candle type - bull or bear, the last C wave and the main B wave of price within the candle may well be in the opposite direction.
What do you think? I personally think its important information hidden within a candle.
Source: Anatomy of a Japanese Candlestick

The 3-Step Rocket Booster Strategy + Evening Star Candlestick The number #1 candlestick pattern is the evening star ✴️.
This is the pattern you are looking at on on this screen.
Its a very strong pattern, now notice how the top of this price action looks?
You see when the "dead cross" happened everyone started short selling.
Then pop bomb 💣 to the top.
After that the price just came falling.
Finding this one was a bit of a challenge but I did my due diligence.
"Its a bear market "
there I said it.
The 🐻 Bear market has arrived.
This means it's more favourable to short sell.
Am not short selling this stock am just giving you an idea via technical analysis.
I maybe right or wrong but I just want to share this idea and hopefully you learn from it.
No matter how good your trading system please plan for volatility.
Its like dating no matter how good your dating system there will be always some bad fruit you may have to get rid of.
It hurts but it's part of the game.Thinking of risk management is the key.
Make sure you master the evening star ✴️ pattern.
This is the Rocket Booster Strategy 🚀 in reverse from the short side:
1- The price is below the 50 EMA
2- The price is below the 200 EMA
3- The price gaps down via the evening star ✴️
That's the 🚀 Rocket Booster Strategy in reverse
Rocket boost this content to learn more.
Disclaimer ⚠️ Trading is risky please learn about risk management and profit taking strategies Also feel free to use a simulation trading account before you use real money

3 Things: Fear, Bitcoin, And The Doji Candlestick PatternIt was in the night i was taking a walk and then
i heard a viper. It hissed at me.
It grabbed a frog with one swift.It bothered me
because i am usually used to hearing them vipers.
But this time i was scared.I always
use auto suggestion. From the bible
it says "You shall trample the great lion and the snake"
Fear is real, but confidence is not acting
in the absence of fear its acting in the presence of it.
People will mistreat you so that
you have fear this is the fear that stops
action.
If you can act in the presence of fear
who knows what you will find
at the end of that action
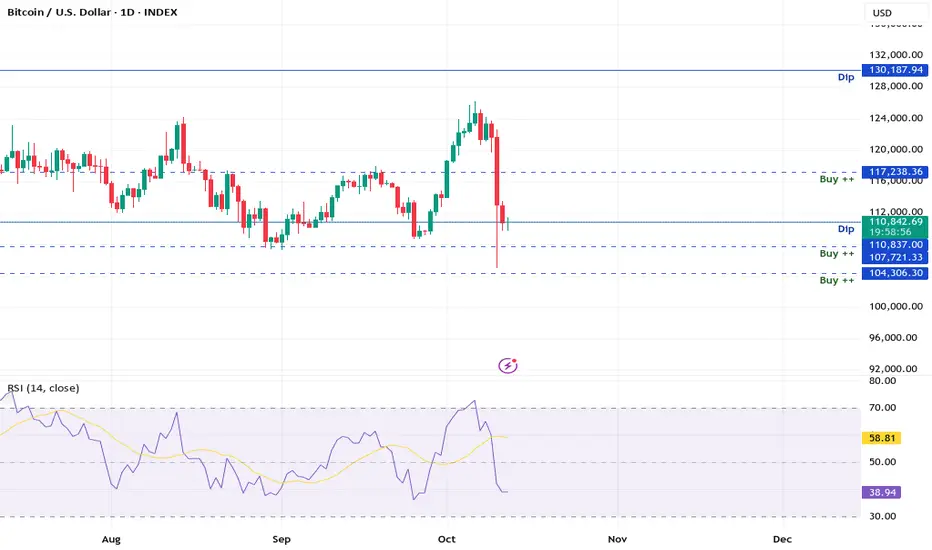
Look at the RSI below its showing you
very good strength on the bitcoin price action
Bitcoin has found its support.This means
people holding bitcoin are not willing to sell anymore
at this price..This is your entry right now.
Remember do not use margin
just buy the actual bitcoin
and stuff it in your hardware
wallet
You can see the fear by the Doji candlestick
pattern.
Remember these 3 things:
Doji - which means indecision or doubt or fear
RSI - which means price strength
Support price - which means buyers are not willing to sell
Be prepared for the next Bitcoin bull market by
December of this year.
Rocket boost this content to learn more
Disclaimer:Trading is risky please risk management
and profit taking strategies.
Also feel free to use a simulation trading account
Before you trade with real money.Do not use margin.
Bitcoin’s Candlestick Pattern- Reversal Signal Confirmed?As I expected in the previous post , Bitcoin ( BINANCE:BTCUSDT ) started to fall with the help of a Symmetrical Triangle Pattern .
Bitcoin is moving near Support lines and the important Potential Reversal Zone(PRZ) .
According to the theory of Elliott waves , Bitcoin seems to have successfully completed its 5 downward impulse waves . One of the signs of the completion of the main wave 5 is the Regular Divergence (RD+) between two consecutive valleys .
Another sign of Bitcoin's reverse can be the Hammer Candlestick Pattern .
Let's take some risks today and swim against the current, but please follow capital management and follow your strategy .
I expect Bitcoin to rise to at least the Heavy Support zone($93,300-$90,500)(broken) after breaking the Resistance zone($88,200-$87,450) .
Do you think Bitcoin can rise to at least $90,000 again?
Note: If Bitcoin goes below $84,500, we can expect more dumps .
Please respect each other's ideas and express them politely if you agree or disagree.
Bitcoin Analyze (BTCUSDT), 1-hour time frame.
Be sure to follow the updated ideas.
Do not forget to put Stop loss for your positions (For every position you want to open).
Please follow your strategy and updates; this is just my Idea, and I will gladly see your ideas in this post.
Please do not forget the ✅' like '✅ button 🙏😊 & Share it with your friends; thanks, and Trade safe.

ORIENTCEM - Bullish Candlestick PatternORIENTCEM - reversal can be seen from a very good support forming bullish candlestick pattern.
If you know the pattern name please share it in comment section for my knowledge. I am still a learner.

Candlestick Bible review-pin bar with the trend In this example Trading the pin bar candlestick with the trend uptrend with 21 moving average

Candlestick Bible Review-pin bar with the trend in this example Trading the pin bar candlestick with the trend downtrend with 21 moving average

GBPCHF-Reversal Candlestick PatternBullish Engulfing Candlestick for GBPCHF. For Forex Mastery Institute (FMI).

Bearish candlestick and fundamentalHanging man candlestick and fundamental factors , The Bank of Japan plans to buy bonds. Use proper money management

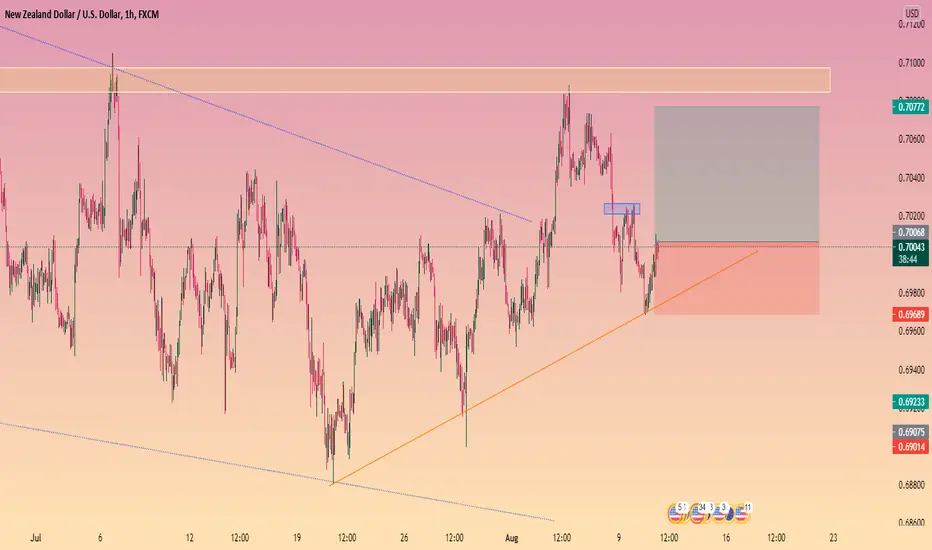
NZDUSD three white soldier candlestickthere is 3 white soldier candlestick bullish when the price touch the trend line, option for buy
candlestick reversal pattern obviously BTT react to trend line with bullish engulfing candlestick pattern

Daily Candlestick PredictionHere is my famous daily candlestick prediction segment for ZM. I will continue posting daily candles until I sell my position or my predictions are wrong more than 50% of the time. Candles are my speciality so if you are watching zoom, make sure to follow!
