ALGO/BTC - Algorand: Resistance_Breakout◳◱ A Resistance Breakout has been identified on the SIX:ALGO / CRYPTOCAP:BTC chart. The price has broken above a key resistance level, indicating a potential bullish trend. The next resistance key levels are located at 0.00000622 | 0.00000639 | 0.00000677, and the major support zones can be found at 0.00000584 | 0.00000563 | 0.00000525. Consider entering at the current price zone of 0.00000623 and targeting higher levels.
◰◲ General info :
▣ Name: Algorand
▣ Rank: 42
▣ Exchanges: Binance, Kucoin, Huobipro, Bittrex, Kraken, Hitbtc
▣ Category/Sector: Infrastructure - Smart Contract Platforms
▣ Overview: Algorand is a scalable, secure, and decentralized digital currency and smart contract platform. Its protocol uses a variation of Proof-of-Stake (PoS) called Pure PoS (PPoS) to secure the network and reach consensus on block production. Unlike other PoS models, PPoS does not reward, nor does it put validator or user funds at risk of being slashed (a loss of funds used to promote honest node and user behavior). Algorand intends to eventually leverage its PPoS design to form the foundation for an on-chain governance system.
◰◲ Technical Metrics :
▣ Mrkt Price: 0.00000623 ₿
▣ 24HVol: 14.526 ₿
▣ 24H Chng: 2.467%
▣ 7-Days Chng: 2.40%
▣ 1-Month Chng: -27.91%
▣ 3-Months Chng: -37.87%
◲◰ Pivot Points - Levels :
◥ Resistance: 0.00000622 | 0.00000639 | 0.00000677
◢ Support: 0.00000584 | 0.00000563 | 0.00000525
◱◳ Indicators recommendation :
▣ Oscillators: NEUTRAL
▣ Moving Averages: STRONG_BUY
◰◲ Technical Indicators Summary : BUY
◲◰ Sharpe Ratios :
▣ Last 30D: -6.44
▣ Last 90D: -1.69
▣ Last 1-Y: -0.75
▣ Last 3-Y: 0.51
◲◰ Volatility :
▣ Last 30D: 0.55
▣ Last 90D: 0.75
▣ Last 1-Y: 0.87
▣ Last 3-Y: 1.20
◳◰ Market Sentiment Index :
▣ News sentiment score is N/A
▣ Twitter sentiment score is 0.60 - Bullish
▣ Reddit sentiment score is 0.59 - Bullish
▣ In-depth ALGOBTC technical analysis on Tradingview TA page
▣ What do you think of this analysis? Share your insights and let's discuss in the comments below. Your like, follow and support would be greatly appreciated!
◲ Disclaimer
Please note that the information and publications provided are for informational purposes only and should not be construed as financial, investment, trading, or any other type of advice or recommendation. We encourage you to conduct your own research and consult with a qualified professional before making any financial decisions. The use of the information provided is solely at your own risk.
▣ Welcome to the home of charting big: TradingView
Benefit from a ton of financial analysis features, instruments and data. Have a look around, and if you do choose to go with an upgraded plan, you'll get up to $30.
Discover it here - affiliate link -
Search in ideas for "CRYPTO"

DASH/BTC - Dash: Super_Trend◳◱ We've detected a Super Trend pattern on the NYSE:DASH / CRYPTOCAP:BTC chart. The Super Trend indicator is showing a bullish trend, indicating a potential trend reversal. The next resistance key levels are at 0.001605 | 0.001679 | 0.001828 and the major support zones are respectively at 0.001456 | 0.001381 | 0.001232. We may consider opening a trade position at the current price zone at 0.001582 and benefit from the trend continuation.
◰◲ General info :
▣ Name: Dash
▣ Rank: 89
▣ Exchanges: Binance, Kucoin, Huobipro, Gateio, Poloniex, Mexc
▣ Category/Sector: Payments - Currencies
▣ Overview: Dash is a fork of Bitcoin that focuses on the payments use case. It has introduced a number of features to the industry including masternodes, LLMQs, ChainLocks, and InstantSend, which target scalability, speed, reliability, cost-effectiveness, and user experience. The Dash network is also the longest-running decentralized autonomous organization, utilizing on-chain governance to allocate network resources toward projects and organizations that support the network.
◰◲ Technical Metrics :
▣ Mrkt Price: 0.001582 ₿
▣ 24HVol: 5.374 ₿
▣ 24H Chng: 2.861%
▣ 7-Days Chng: 1.90%
▣ 1-Month Chng: -29.66%
▣ 3-Months Chng: -41.50%
◲◰ Pivot Points - Levels :
◥ Resistance: 0.001605 | 0.001679 | 0.001828
◢ Support: 0.001456 | 0.001381 | 0.001232
◱◳ Indicators recommendation :
▣ Oscillators: SELL
▣ Moving Averages: STRONG_BUY
◰◲ Technical Indicators Summary : BUY
◲◰ Sharpe Ratios :
▣ Last 30D: -6.03
▣ Last 90D: -1.59
▣ Last 1-Y: -0.05
▣ Last 3-Y: 0.36
◲◰ Volatility :
▣ Last 30D: 0.64
▣ Last 90D: 0.80
▣ Last 1-Y: 0.82
▣ Last 3-Y: 1.10
◳◰ Market Sentiment Index :
▣ News sentiment score is N/A
▣ Twitter sentiment score is 0.59 - Bullish
▣ Reddit sentiment score is 0.45 - Bearish
▣ In-depth DASHBTC technical analysis on Tradingview TA page
▣ What do you think of this analysis? Share your insights and let's discuss in the comments below. Your like, follow and support would be greatly appreciated!
◲ Disclaimer
Please note that the information and publications provided are for informational purposes only and should not be construed as financial, investment, trading, or any other type of advice or recommendation. We encourage you to conduct your own research and consult with a qualified professional before making any financial decisions. The use of the information provided is solely at your own risk.
▣ Welcome to the home of charting big: TradingView
Benefit from a ton of financial analysis features, instruments and data. Have a look around, and if you do choose to go with an upgraded plan, you'll get up to $30.
Discover it here - affiliate link -

PSG/USDT - Paris Saint-Germain Fan Token: Resistance_Breakout◳◱ A Resistance Breakout has been identified on the BME:PSG / CRYPTOCAP:USDT chart. The price has broken above a key resistance level, indicating a potential bullish trend. The next resistance key levels are located at 5.68 | 6.13 | 6.83, and the major support zones can be found at 4.98 | 4.73 | 4.03. Consider entering at the current price zone of 5.5 and targeting higher levels.
◰◲ General info :
▣ Name: Paris Saint-Germain Fan Token
▣ Rank: 402
▣ Exchanges: Binance, Huobipro, Gateio, Poloniex, Mexc
▣ Category/Sector: N/A
▣ Overview: Paris Saint-Germain Fan Token project overview is currently unavailable. I'll try to update this in the upcoming analysis.
◰◲ Technical Metrics :
▣ Mrkt Price: 5.5 ₮
▣ 24HVol: 572,545.473 ₮
▣ 24H Chng: 0.548%
▣ 7-Days Chng: 3.25%
▣ 1-Month Chng: 1.71%
▣ 3-Months Chng: -16.73%
◲◰ Pivot Points - Levels :
◥ Resistance: 5.68 | 6.13 | 6.83
◢ Support: 4.98 | 4.73 | 4.03
◱◳ Indicators recommendation :
▣ Oscillators: BUY
▣ Moving Averages: STRONG_BUY
◰◲ Technical Indicators Summary : STRONG_BUY
◲◰ Sharpe Ratios :
▣ Last 30D: 1.67
▣ Last 90D: -0.31
▣ Last 1-Y: 0.14
▣ Last 3-Y: 0.55
◲◰ Volatility :
▣ Last 30D: 0.47
▣ Last 90D: 0.54
▣ Last 1-Y: 1.14
▣ Last 3-Y: 1.32
◳◰ Market Sentiment Index :
▣ News sentiment score is N/A
▣ Twitter sentiment score is N/A
▣ Reddit sentiment score is N/A
▣ In-depth PSGUSDT technical analysis on Tradingview TA page
▣ What do you think of this analysis? Share your insights and let's discuss in the comments below. Your like, follow and support would be greatly appreciated!
◲ Disclaimer
Please note that the information and publications provided are for informational purposes only and should not be construed as financial, investment, trading, or any other type of advice or recommendation. We encourage you to conduct your own research and consult with a qualified professional before making any financial decisions. The use of the information provided is solely at your own risk.
▣ Welcome to the home of charting big: TradingView
Benefit from a ton of financial analysis features, instruments and data. Have a look around, and if you do choose to go with an upgraded plan, you'll get up to $30.
Discover it here - affiliate link -

NEXO/USDT - Nexo: Resistance_Breakout_Confirmation SuperTrend◳◱ We have identified both a Super Trend pattern and a Resistance Breakout on the $NEXO / CRYPTOCAP:USDT chart. Both indicators are signaling a bullish trend, with the Super Trend showing a bullish trend and the Resistance Breakout confirming this trend by showing the price breaking above a key resistance level. Given the alignment of these signals, it may be a good idea to consider entering a long position and targeting higher levels. Our analysis indicates that the key resistance levels are at 0.715 | 0.763 | 0.847 and the major support zones are at 0.631 | 0.595 | 0.511. However, it is important to also consider other factors such as overall market conditions and other technical indicators before making a trade decision.
◰◲ General info :
▣ Name: Nexo
▣ Rank: 101
▣ Exchanges: Binance, Huobipro, Gateio, Poloniex, Mexc
▣ Category/Sector: Financial - Lending
▣ Overview: Nexo offers crypto backed lines of credit and interest-bearing crypto accounts.
◰◲ Technical Metrics :
▣ Mrkt Price: 0.717 ₮
▣ 24HVol: 773,293.307 ₮
▣ 24H Chng: 1.991%
▣ 7-Days Chng: 7.22%
▣ 1-Month Chng: -4.53%
▣ 3-Months Chng: -14.43%
◲◰ Pivot Points - Levels :
◥ Resistance: 0.715 | 0.763 | 0.847
◢ Support: 0.631 | 0.595 | 0.511
◱◳ Indicators recommendation :
▣ Oscillators: BUY
▣ Moving Averages: STRONG_BUY
◰◲ Technical Indicators Summary : STRONG_BUY
◲◰ Sharpe Ratios :
▣ Last 30D: -0.27
▣ Last 90D: -1.39
▣ Last 1-Y: -0.81
▣ Last 3-Y: 1.23
◲◰ Volatility :
▣ Last 30D: 0.47
▣ Last 90D: 0.52
▣ Last 1-Y: 0.84
▣ Last 3-Y: 1.45
◳◰ Market Sentiment Index :
▣ News sentiment score is N/A
▣ Twitter sentiment score is 0.52 - Bullish
▣ Reddit sentiment score is 0.04 - V. Bearish
▣ In-depth NEXOUSDT technical analysis on Tradingview TA page
▣ What do you think of this analysis? Share your insights and let's discuss in the comments below. Your like, follow and support would be greatly appreciated!
◲ Disclaimer
Please note that the information and publications provided are for informational purposes only and should not be construed as financial, investment, trading, or any other type of advice or recommendation. We encourage you to conduct your own research and consult with a qualified professional before making any financial decisions. The use of the information provided is solely at your own risk.
▣ Welcome to the home of charting big: TradingView
Benefit from a ton of financial analysis features, instruments and data. Have a look around, and if you do choose to go with an upgraded plan, you'll get up to $30.
Discover it here - affiliate link -

SNT/BTC - Status: Super_Trend◳◱ We've detected a Super Trend pattern on the NASDAQ:SNT / CRYPTOCAP:BTC chart. The Super Trend indicator is showing a bullish trend, indicating a potential trend reversal. The next resistance key levels are at 0.00000103 | 0.00000109 | 0.00000121 and the major support zones are respectively at 0.00000091 | 0.00000085 | 0.00000073. We may consider opening a trade position at the current price zone at 0.000001 and benefit from the trend continuation.
◰◲ General info :
▣ Name: Status
▣ Rank: 232
▣ Exchanges: Binance, Huobipro, Gateio, Poloniex, Mexc, Bittrex
▣ Category/Sector: Infrastructure - Application Development
▣ Overview: Status is a mobile operating system that combines a decentralized browser and private messenger for the Ethereum network.
◰◲ Technical Metrics :
▣ Mrkt Price: 0.000001 ₿
▣ 24HVol: 4.219 ₿
▣ 24H Chng: 4.167%
▣ 7-Days Chng: -3.82%
▣ 1-Month Chng: 5.24%
▣ 3-Months Chng: 8.43%
◲◰ Pivot Points - Levels :
◥ Resistance: 0.00000103 | 0.00000109 | 0.00000121
◢ Support: 0.00000091 | 0.00000085 | 0.00000073
◱◳ Indicators recommendation :
▣ Oscillators: SELL
▣ Moving Averages: STRONG_BUY
◰◲ Technical Indicators Summary : BUY
◲◰ Sharpe Ratios :
▣ Last 30D: 1.08
▣ Last 90D: 0.92
▣ Last 1-Y: -0.56
▣ Last 3-Y: 0.75
◲◰ Volatility :
▣ Last 30D: 0.60
▣ Last 90D: 0.83
▣ Last 1-Y: 0.90
▣ Last 3-Y: 1.35
◳◰ Market Sentiment Index :
▣ News sentiment score is 0.78 - V. Bullish
▣ Twitter sentiment score is 0.53 - Bullish
▣ Reddit sentiment score is 0.53 - Bullish
▣ In-depth SNTBTC technical analysis on Tradingview TA page
▣ What do you think of this analysis? Share your insights and let's discuss in the comments below. Your like, follow and support would be greatly appreciated!
◲ Disclaimer
Please note that the information and publications provided are for informational purposes only and should not be construed as financial, investment, trading, or any other type of advice or recommendation. We encourage you to conduct your own research and consult with a qualified professional before making any financial decisions. The use of the information provided is solely at your own risk.
▣ Welcome to the home of charting big: TradingView
Benefit from a ton of financial analysis features, instruments and data. Have a look around, and if you do choose to go with an upgraded plan, you'll get up to $30.
Discover it here - affiliate link -

IOST/USDT - IOST: SuperTrend Resistance_Breakout_Confirmation◳◱ We have identified both a Super Trend pattern and a Resistance Breakout on the $IOST / CRYPTOCAP:USDT chart. Both indicators are signaling a bullish trend, with the Super Trend showing a bullish trend and the Resistance Breakout confirming this trend by showing the price breaking above a key resistance level. Given the alignment of these signals, it may be a good idea to consider entering a long position and targeting higher levels. Our analysis indicates that the key resistance levels are at 0.01282 | 0.01467 | 0.01771 and the major support zones are at 0.00978 | 0.00859 | 0.00555. However, it is important to also consider other factors such as overall market conditions and other technical indicators before making a trade decision.
◰◲ General info :
▣ Name: IOST
▣ Rank: 166
▣ Exchanges: Binance, Kucoin, Bybit, Huobipro, Gateio, Mexc
▣ Category/Sector: Infrastructure - Smart Contract Platforms
▣ Overview: IOSToken (IOST) is building a proprietary blockchain, called Internet of Services (IOS), focused on scalable and high throughput smart contract processing.
◰◲ Technical Metrics :
▣ Mrkt Price: 0.01181 ₮
▣ 24HVol: 2,430,054.548 ₮
▣ 24H Chng: 2.785%
▣ 7-Days Chng: 6.06%
▣ 1-Month Chng: 16.58%
▣ 3-Months Chng: 25.31%
◲◰ Pivot Points - Levels :
◥ Resistance: 0.01282 | 0.01467 | 0.01771
◢ Support: 0.00978 | 0.00859 | 0.00555
◱◳ Indicators recommendation :
▣ Oscillators: BUY
▣ Moving Averages: STRONG_BUY
◰◲ Technical Indicators Summary : STRONG_BUY
◲◰ Sharpe Ratios :
▣ Last 30D: 1.20
▣ Last 90D: 1.41
▣ Last 1-Y: -0.74
▣ Last 3-Y: 0.89
◲◰ Volatility :
▣ Last 30D: 0.76
▣ Last 90D: 0.99
▣ Last 1-Y: 0.86
▣ Last 3-Y: 1.32
◳◰ Market Sentiment Index :
▣ News sentiment score is N/A
▣ Twitter sentiment score is 0.56 - Bullish
▣ Reddit sentiment score is 0.53 - Bullish
▣ In-depth IOSTUSDT technical analysis on Tradingview TA page
▣ What do you think of this analysis? Share your insights and let's discuss in the comments below. Your like, follow and support would be greatly appreciated!
◲ Disclaimer
Please note that the information and publications provided are for informational purposes only and should not be construed as financial, investment, trading, or any other type of advice or recommendation. We encourage you to conduct your own research and consult with a qualified professional before making any financial decisions. The use of the information provided is solely at your own risk.
▣ Welcome to the home of charting big: TradingView
Benefit from a ton of financial analysis features, instruments and data. Have a look around, and if you do choose to go with an upgraded plan, you'll get up to $30.
Discover it here - affiliate link -

ENJ/USDT - Enjin Coin: BBand_Breakout Super-Trend◳◱ A Bollinger Band breakout and a Super Trend pattern have been noticed on the NYSE:ENJ / CRYPTOCAP:USDT chart, indicating a bullish trend. The Bollinger Band shows a probable positive trend as the price has moved outside of the upper band, while the Super Trend confirms the bullish trend. To buy at the current price range and aim for higher levels would be a solid option. The key resistance levels are located at 0.4718 | 0.4931 | 0.5477, and the major support zones can be found at 0.4172 | 0.3839 | 0.3293.
◰◲ General info :
▣ Name: Enjin Coin
▣ Rank: 101
▣ Exchanges: Binance, Kucoin, Bybit, Huobipro, Gateio, Poloniex
▣ Category/Sector: Media and Entertainment - Gaming
▣ Overview: Enjin is a Singapore-based technology company that provides services for building gaming communities as well as services for blockchain game developers. Enjin provides a suite of tools based on a web interface that supports Ethereum digital assets in the form of ERC-1155 tokens. Enjin also operates a virtual goods marketplaces for digital assets on Ethereum.
◰◲ Technical Metrics :
▣ Mrkt Price: 0.4571 ₮
▣ 24HVol: 5,560,477.083 ₮
▣ 24H Chng: 2.673%
▣ 7-Days Chng: 5.78%
▣ 1-Month Chng: 7.52%
▣ 3-Months Chng: 25.76%
◲◰ Pivot Points - Levels :
◥ Resistance: 0.4718 | 0.4931 | 0.5477
◢ Support: 0.4172 | 0.3839 | 0.3293
◱◳ Indicators recommendation :
▣ Oscillators: NEUTRAL
▣ Moving Averages: STRONG_BUY
◰◲ Technical Indicators Summary : BUY
◲◰ Sharpe Ratios :
▣ Last 30D: 0.88
▣ Last 90D: 1.31
▣ Last 1-Y: -0.77
▣ Last 3-Y: 1.01
◲◰ Volatility :
▣ Last 30D: 0.78
▣ Last 90D: 0.99
▣ Last 1-Y: 1.00
▣ Last 3-Y: 1.35
◳◰ Market Sentiment Index :
▣ News sentiment score is N/A
▣ Twitter sentiment score is 0.55 - Bullish
▣ Reddit sentiment score is 0.79 - V. Bullish
▣ In-depth ENJUSDT technical analysis on Tradingview TA page
▣ What do you think of this analysis? Share your insights and let's discuss in the comments below. Your like, follow and support would be greatly appreciated!
◲ Disclaimer
Please note that the information and publications provided are for informational purposes only and should not be construed as financial, investment, trading, or any other type of advice or recommendation. We encourage you to conduct your own research and consult with a qualified professional before making any financial decisions. The use of the information provided is solely at your own risk.
▣ Welcome to the home of charting big: TradingView
Benefit from a ton of financial analysis features, instruments and data. Have a look around, and if you do choose to go with an upgraded plan, you'll get up to $30.
Discover it here - affiliate link -

FLUX/USDT - Flux: BBand_Breakout◳◱ A Bollinger Band breakout has been identified on the NASDAQ:FLUX / CRYPTOCAP:USDT chart. The price has moved outside of the upper Bollinger Band, indicating a potential bullish trend. The next resistance key levels are located at 0.695 | 0.772 | 0.903, and the major support zones can be found at 0.564 | 0.51 | 0.379. Consider buying at the current price zone of 0.716 and targeting higher levels.BBand_Squeeze
◰◲ General info :
▣ Name: Flux
▣ Rank: 169
▣ Exchanges: Binance, Kucoin, Gateio, Mexc, Bittrex
▣ Category/Sector: N/A
▣ Overview: None
◰◲ Technical Metrics :
▣ Mrkt Price: 0.716 ₮
▣ 24HVol: 7,338,396.694 ₮
▣ 24H Chng: -7.134%
▣ 7-Days Chng: 15.70%
▣ 1-Month Chng: 2.31%
▣ 3-Months Chng: 10.40%
◲◰ Pivot Points - Levels :
◥ Resistance: 0.695 | 0.772 | 0.903
◢ Support: 0.564 | 0.51 | 0.379
◱◳ Indicators recommendation :
▣ Oscillators: BUY
▣ Moving Averages: NEUTRAL
◰◲ Technical Indicators Summary : NEUTRAL
◲◰ Sharpe Ratios :
▣ Last 30D: 1.81
▣ Last 90D: 1.17
▣ Last 1-Y: -0.04
▣ Last 3-Y: 1.00
◲◰ Volatility :
▣ Last 30D: 0.74
▣ Last 90D: 1.05
▣ Last 1-Y: 1.19
▣ Last 3-Y: 1.76
◳◰ Market Sentiment Index :
▣ News sentiment score is N/A
▣ Twitter sentiment score is N/A
▣ Reddit sentiment score is 0.33 - Bearish
▣ In-depth FLUXUSDT technical analysis on Tradingview TA page
▣ What do you think of this analysis? Share your insights and let's discuss in the comments below. Your like, follow and support would be greatly appreciated!
◲ Disclaimer
Please note that the information and publications provided are for informational purposes only and should not be construed as financial, investment, trading, or any other type of advice or recommendation. We encourage you to conduct your own research and consult with a qualified professional before making any financial decisions. The use of the information provided is solely at your own risk.
▣ Welcome to the home of charting big: TradingView
Benefit from a ton of financial analysis features, instruments and data. Have a look around, and if you do choose to go with an upgraded plan, you'll get up to $30.
Discover it here - affiliate link -

IOTA/USDT - IOTA: Resistance_Breakout◳◱ A Resistance Breakout has been identified on the FWB:IOTA / CRYPTOCAP:USDT chart. The price has broken above a key resistance level, indicating a potential bullish trend. The next resistance key levels are located at 0.2399 | 0.2563 | 0.2899, and the major support zones can be found at 0.2063 | 0.1891 | 0.1555. Consider entering at the current price zone of 0.2271 and targeting higher levels.
◰◲ General info :
▣ Name: IOTA
▣ Rank: 79
▣ Exchanges: Binance, Kucoin, Bybit, Huobipro, Gateio, Bittrex
▣ Category/Sector: Services - IoT
▣ Overview: IOTA is transaction settlement and data transfer layer for the Internet of Things (IoT). It's distributed ledger, the Tangle, is based on a data structure referred to as a Directed Acyclic Graph (DAG). In the Tangle there are no blocks or miners, and every transaction on the Iota network must validate two previous transactions through a small proof-of-work (PoW). Thus the more transactions occur, the faster the network can process new transactions, theoretically allowing the network to become more efficient as it scales.
◰◲ Technical Metrics :
▣ Mrkt Price: 0.2271 ₮
▣ 24HVol: 3,684,708.745 ₮
▣ 24H Chng: 3.18%
▣ 7-Days Chng: -0.87%
▣ 1-Month Chng: 10.38%
▣ 3-Months Chng: 6.61%
◲◰ Pivot Points - Levels :
◥ Resistance: 0.2399 | 0.2563 | 0.2899
◢ Support: 0.2063 | 0.1891 | 0.1555
◱◳ Indicators recommendation :
▣ Oscillators: BUY
▣ Moving Averages: STRONG_BUY
◰◲ Technical Indicators Summary : STRONG_BUY
◲◰ Sharpe Ratios :
▣ Last 30D: 0.61
▣ Last 90D: 0.99
▣ Last 1-Y: -0.93
▣ Last 3-Y: 0.67
◲◰ Volatility :
▣ Last 30D: 0.67
▣ Last 90D: 0.69
▣ Last 1-Y: 0.83
▣ Last 3-Y: 1.12
◳◰ Market Sentiment Index :
▣ News sentiment score is N/A
▣ Twitter sentiment score is 0.70 - Bullish
▣ Reddit sentiment score is N/A
▣ In-depth IOTAUSDT technical analysis on Tradingview TA page
▣ What do you think of this analysis? Share your insights and let's discuss in the comments below. Your like, follow and support would be greatly appreciated!
◲ Disclaimer
Please note that the information and publications provided are for informational purposes only and should not be construed as financial, investment, trading, or any other type of advice or recommendation. We encourage you to conduct your own research and consult with a qualified professional before making any financial decisions. The use of the information provided is solely at your own risk.
▣ Welcome to the home of charting big: TradingView
Benefit from a ton of financial analysis features, instruments and data. Have a look around, and if you do choose to go with an upgraded plan, you'll get up to $30.
Discover it here - affiliate link -

ALGO/USDT - Algorand: Resistance_Breakout_Confirmation◳◱ A Resistance Breakout and Confirmation has been detected on the SIX:ALGO / CRYPTOCAP:USDT chart. The price has broken above a key resistance level and has been confirmed by a strong candle, indicating a potential bullish trend. The next resistance key levels are located at 0.2247 | 0.2329 | 0.2501, and the major support zones can be found at 0.2075 | 0.1985 | 0.1813. Consider entering a trade at the current price zone of 0.2313 and targeting higher levels.
◰◲ General info :
▣ Name: Algorand
▣ Rank: 40
▣ Exchanges: Binance, Kucoin, Bybit, Huobipro, Gateio, Mexc
▣ Category/Sector: Infrastructure - Smart Contract Platforms
▣ Overview: Algorand is a scalable, secure, and decentralized digital currency and smart contract platform. Its protocol uses a variation of Proof-of-Stake (PoS) called Pure PoS (PPoS) to secure the network and reach consensus on block production. Unlike other PoS models, PPoS does not reward, nor does it put validator or user funds at risk of being slashed (a loss of funds used to promote honest node and user behavior). Algorand intends to eventually leverage its PPoS design to form the foundation for an on-chain governance system.
◰◲ Technical Metrics :
▣ Mrkt Price: 0.2313 ₮
▣ 24HVol: 12,134,262.215 ₮
▣ 24H Chng: 5.858%
▣ 7-Days Chng: 4.60%
▣ 1-Month Chng: 11.99%
▣ 3-Months Chng: 0.01%
◲◰ Pivot Points - Levels :
◥ Resistance: 0.2247 | 0.2329 | 0.2501
◢ Support: 0.2075 | 0.1985 | 0.1813
◱◳ Indicators recommendation :
▣ Oscillators: BUY
▣ Moving Averages: STRONG_BUY
◰◲ Technical Indicators Summary : STRONG_BUY
◲◰ Sharpe Ratios :
▣ Last 30D: 0.76
▣ Last 90D: 0.54
▣ Last 1-Y: -0.78
▣ Last 3-Y: 0.63
◲◰ Volatility :
▣ Last 30D: 0.90
▣ Last 90D: 0.86
▣ Last 1-Y: 0.95
▣ Last 3-Y: 1.20
◳◰ Market Sentiment Index :
▣ News sentiment score is N/A
▣ Twitter sentiment score is 0.60 - Bullish
▣ Reddit sentiment score is 0.46 - Bearish
▣ In-depth ALGOUSDT technical analysis on Tradingview TA page
▣ What do you think of this analysis? Share your insights and let's discuss in the comments below. Your like, follow and support would be greatly appreciated!
◲ Disclaimer
Please note that the information and publications provided are for informational purposes only and should not be construed as financial, investment, trading, or any other type of advice or recommendation. We encourage you to conduct your own research and consult with a qualified professional before making any financial decisions. The use of the information provided is solely at your own risk.
▣ Welcome to the home of charting big: TradingView
Benefit from a ton of financial analysis features, instruments and data. Have a look around, and if you do choose to go with an upgraded plan, you'll get up to $30.
Discover it here - affiliate link -

ETC/USDT - Ethereum Classic: Trend_Reversal◳◱ Hey traders, A Trend Reversal has been identified on the SET:ETC / CRYPTOCAP:USDT chart. The trend of the price has reversed, indicating a potential trend change. The next resistance levels are located at 21.48 | 22.39 | 24.13, while the main support levels can be found at 19.74 | 18.91 | 17.17. Consider buying at the current price of 21.14 and benefiting from the trend continuation.
◰◲ General info :
▣ Name: Ethereum Classic
▣ Rank: 25
▣ Exchanges: Binance, Kucoin, Bybit, Huobipro, Gateio, Poloniex
▣ Category/Sector: Infrastructure - Smart Contract Platforms
▣ Overview: Ethereum Classic is a decentralized computing platform designed to execute smart contracts, which are applications that run as programmed without the possibility of censorship or third-party interference. It is a distributed network consisting of a blockchain ledger, a native cryptocurrency (called ETC), and an ecosystem of on-chain applications and services. Ethereum Classic is the legacy chain that split from Ethereum following a contentious hard fork, known as The DAO fork, in Jul. 2017. Like its sister chain, Ethereum Classic features an execution engine optimized for smart contract processing (known as the Ethereum Virtual Machine or EVM) and a Proof of Work (PoW) consensus system. While it shares some aspects with Ethereum, Ethereum Classic offers a more defined monetary policy and inflation schedule.
◰◲ Technical Metrics :
▣ Mrkt Price: 21.14 ₮
▣ 24HVol: 15,065,869.507 ₮
▣ 24H Chng: 4.241%
▣ 7-Days Chng: 0.07%
▣ 1-Month Chng: 12.12%
▣ 3-Months Chng: 3.06%
◲◰ Pivot Points - Levels :
◥ Resistance: 21.48 | 22.39 | 24.13
◢ Support: 19.74 | 18.91 | 17.17
◱◳ Indicators recommendation :
▣ Oscillators: SELL
▣ Moving Averages: STRONG_BUY
◰◲ Technical Indicators Summary : BUY
◲◰ Sharpe Ratios :
▣ Last 30D: 2.91
▣ Last 90D: 0.49
▣ Last 1-Y: -0.11
▣ Last 3-Y: 0.97
◲◰ Volatility :
▣ Last 30D: 0.74
▣ Last 90D: 0.69
▣ Last 1-Y: 1.11
▣ Last 3-Y: 1.22
◳◰ Market Sentiment Index :
▣ News sentiment score is N/A
▣ Twitter sentiment score is 0.67 - Bullish
▣ Reddit sentiment score is 0.75 - V. Bullish
▣ In-depth ETCUSDT technical analysis on Tradingview TA page
▣ What do you think of this analysis? Share your insights and let's discuss in the comments below. Your like, follow and support would be greatly appreciated!
◲ Disclaimer
Please note that the information and publications provided are for informational purposes only and should not be construed as financial, investment, trading, or any other type of advice or recommendation. We encourage you to conduct your own research and consult with a qualified professional before making any financial decisions. The use of the information provided is solely at your own risk.
▣ Welcome to the home of charting big: TradingView
Benefit from a ton of financial analysis features, instruments and data. Have a look around, and if you do choose to go with an upgraded plan, you'll get up to $30.
Discover it here - affiliate link -

Where Will the Pullback on STX End?Stacks (STX) has been one of the best-performing coins on the market this year. The token soared by nearly 500% from January 1st to its high of $1.31 only 18 days ago. However, like most cryptocurrencies, STX is now experiencing a pullback. In this analysis, we'll take a closer look at what's happening with STX and what investors can expect in the coming weeks.
What is STX? Stacks is a Bitcoin layer for smart contracts, allowing decentralized applications to use Bitcoin as an asset and settle transactions on the Bitcoin blockchain. It unlocks $500B in BTC capital and has knowledge of the full Bitcoin state, with transactions automatically hashed and settled on the Bitcoin L1. Stacks blocks are secured by 100% Bitcoin hashpower, making it difficult for hackers to re-order transactions.
STX managed to break above the $1.00 resistance level that was previously identified in our analysis. However, it was unable to hold the price above this key level, so now it's coming back down. STX’s inability to sustain its price above resistance may indicate that the price level was too high for the market at the moment to sustain.
Where does the pullback end?
While STX is going through a pullback, the 100 Simple Moving Average (SMA) may halt the downturn. The 100 SMA acts as mobile support, preventing the price from falling below it in most cases. If the 100 SMA breaks, the next support level is around $0.50.
It's essential to remember that the current pullback is a normal occurrence in the cryptocurrency market. After massive gains, most cryptocurrencies tend to experience a correction. Typically, coins that start a bull run strongly are the ones that advance the most overall. As such, investors should keep an eye on STX for the potential for another bull run coming in 2024-2025.
Bottom Line: Stacks (STX) has been a high-performing cryptocurrency this year, but like all cryptocurrencies, it's experiencing a pullback. However, this is a normal occurrence in the crypto market, and investors should keep a close eye on the support levels and moving averages.

Bitcoin Exclusive Bull Run Technical Analysis: A Comprehensive GBitcoin Exclusive Bull Run Technical Analysis: A Comprehensive Guide By CryptoPatel
Introduction:
Bitcoin, the world's leading cryptocurrency, has been on a rollercoaster ride for the past few years, experiencing extreme highs and lows. In this comprehensive guide, we will take a closer look at Bitcoin's past bull runs and analyze the current market scenario to predict its future price movements. The analysis is based on the technical expertise of CryptoPatel, a renowned cryptocurrency analyst. So, let's dive into the details and explore Bitcoin's future prospects.
Bitcoin's Past Bull Runs:
As per the weekly chart, Bitcoin's previous bull run occurred in 2017, where it hit an all-time high of $19660. However, after the peak, Bitcoin experienced a dangerous dump and hit a bottom of $3120, which was 84% down from its all-time high. This downturn made many investors panic and assume that Bitcoin's target would be $1000. Still, Bitcoin made a strong bounce from the $3120 level, and many investors who used high leverage got liquidated.
After the 2017 bull run, Bitcoin again rose and reached $13875 in 2019, which was a 0.786 Bearish Fibonacci retracement level. However, it again experienced a 67% dump after being rejected from the 0.786 Bearish fib retracement level. This time, it went down till $3913, which was also a 0.786 Bullish fib retracement of the bull mode from the bottom $3120 level. This 0.786 Bullish fib bounce was insane and hit Bitcoin's new all-time high of $68,991.
Bitcoin's Current Scenario:
Bitcoin's last bull market all-time high was $68,991, but it then experienced a hard dump till $15470, which was approximately 77% down from its all-time high. In the current bear market scenario of 2022, Bitcoin tested a new bottom of $15470, and many investors accumulated Bitcoin at this level, as suggested by CryptoPatel, which was their first entry.
Bitcoin has now surged 75% from the current bear market bottom, and CryptoPatel predicts that Bitcoin will hit $42000-$49000 in October 2023, which will be the first exit point. This exit will be the 0.786 Bearish fib retracement from the year 2021 top to the year 2022 bottom.
After the first exit, investors can wait for the second entry around $20,000-$24,000, which might occur in March 2024, near the Bitcoin halving months. This entry will be the 0.786 bullish fib retracement at this point.
After the second entry, investors can hold their Bitcoin till October 2025, where Bitcoin is predicted to hit $150k-$180k, which might be the top of the next bull run.
Conclusion:
Based on the technical analysis of CryptoPatel, it is suggested that investors never sell their Bitcoin until the year-end of 2025. Bitcoin has been on a rollercoaster ride, experiencing extreme highs and lows, and CryptoPatel's analysis provides an excellent roadmap for investors to navigate through Bitcoin's future prospects. However, it is important to remember that investing in cryptocurrencies involves high risks, and This is not Financial Advice so investors should always conduct their research and invest wisely.
Hey, it's CryptoPatel here!
I'm passionate about providing you with the latest insights and analysis on the world of cryptocurrencies.
If you enjoy my content and want to show your support, please like, share, and follow me for more high-quality updates.
Thank you for your support, and let's continue to stay connected for more exciting content!
LIKE ❤️
Share ⏩
Follow

Chiliz CHZ - please don't do that !! Bearish scenarioChiliz CHZ - please don't do that !! Bearish scenario
To be clear - me personally I love and HODL this Crypto.
But it is a must for every Trader to consider bearish scenarios as well.
And this triangle breakout (unfortunately textbook) might lead Chiliz to $0.0246.
If that happens I know what I do - what about you?
Drop me a nice comment if you'd like me to analyze any other cryptocurrency.
*not financial advice
do your own research before investing

Bitcoin short-term view - bullish divergence and next supportsBitcoin short-term view - bullish divergence and next supports
Tech stocks are under pressure today - so nearly all Cryptos.
But the bullish divergence and some volume & price support level make me confident ATM.
How is your mood?
Drop me a nice comment if you'd like me to analyze any other cryptocurrency.
*not financial advice
do your own research before investing
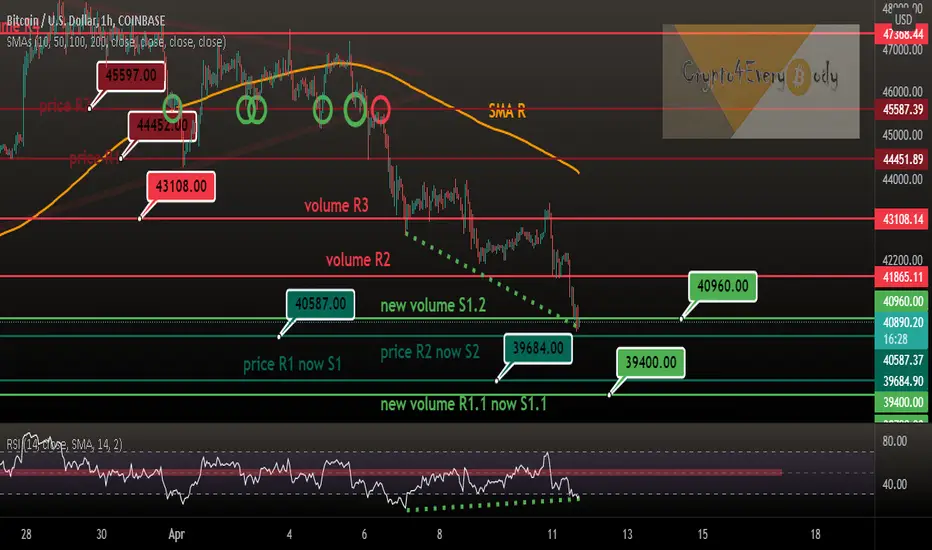
Bitcoin short-term view - BTC back above SMA200 on 1 chartBitcoin short-term view - BTC back above SMA200 on 1 chart
A confirmed break of $47.368 is the next task for the bulls.
Don't see that absolutely necessary for this weekend.
What do you think?
Drop me a nice comment if you'd like me to analyze any other cryptocurrency.
*not financial advice
do your own research before investing

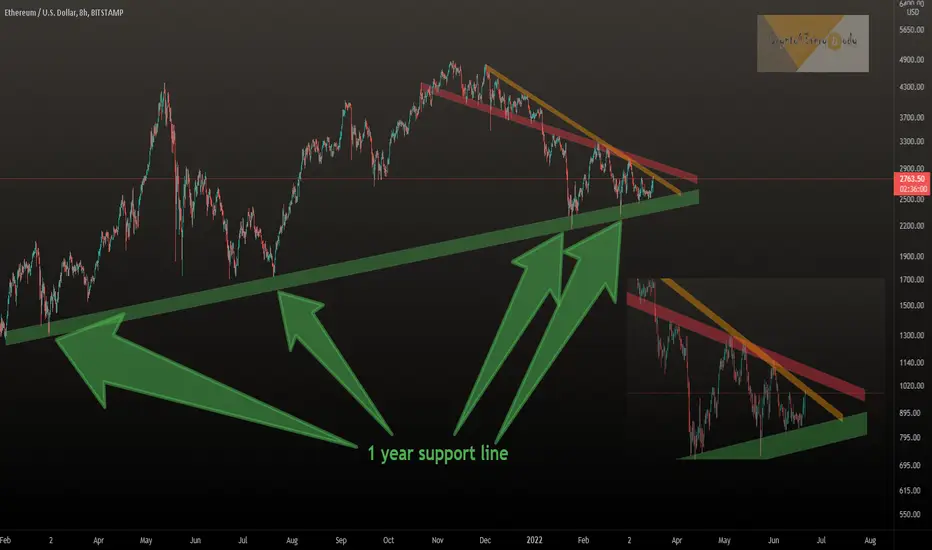
Update: Ethereum 1 year support line - resistance to breakEthereum 1 year support line - resistance to break
ETH right now at the orange resistance - a break would be the first bullish step.
Breaking the red resistance would be the second step with power for new ATHs.
Breaking the green 1 year support line would be unkind.
What do you think?
Drop me a nice comment if you'd like me to analyze any other cryptocurrency.
*not financial advice
do your own research before investing
Can Shiba Inu SHIB confirm breakout?Can Shiba Inu SHIB confirm breakout?
As shown on February 7th the price level $0.000035 - $0.000036 was break even for 47.11k adresses - so price bounced here.
(source @intotheblock)
What do you think? 😎
Drop me a nice comment if you'd like me to analyze any other cryptocurrency.
*not financial advice
do your own research before investing

#ShibaInu (#SHIBUSDT) at an interesting price levelShiba Inu (SHIBUSDT) at an interesting price level.
Seems that this volume support is very strong since Bitcoin, the Crypto market and traditional market had some selling pressure.
What do you think? 😎
Drop me a nice comment if you'd like me to analyze any other cryptocurrency.
*not financial advice
do your own research before investing

Bitcoin's December Box Bitcoin's December Box...
Only just boring sideways action - this will change and the breakout direction will be the basis of 2022 IMO.
What do you think? 😎
Drop me a nice comment if you'd like me to analyze any other cryptocurrency.
*not financial advice
do your own research before investing

Bitcoin Update 14/08/21: New ATH Target @ $77,335 The Bitcoin Bulls are Back! After setting a new ATH @ $64,841 in April, Bitcoin experienced its the first major sell (some may say manipulated) off in this Bull Run Cycle (-50% from the top). We have been closely watching the BTC chart for a strong trend reversal signal. From the ATH @ $64,841, Bitcoin formed a triple bottom in the $28-30k region, the last bottom experienced on the 21st July is confirmed as our bottom here. The Swing Call Script gave further confirmation of the strong trend reversal as a Buy signal was triggered on the 4H Chart on the 22 July and further on the 6th August showing strong signs of bullish momentum back into the market.
From here we expect BTC to retest the current ATH @ $64k which is a 40% Gain from the current price @ $45k. Further to this, we can expect some heavy resistance between the 61.80% - 78.60% fibonacci level. A clear break past the 78.60% fibonacci level see BTC setting a new ATH at the 127.20% fibonacci level. Please see previous analysis below. Happy Trading :)
BTC finally testing the 200 SMA and is showing strong signs of bullish momentum as we see the BTC Bulls coming back into the market 🚀. After 4 failed attempts of trying to break above the key resistance @ $38,595 BTC has finally broken above this key price level. Since the crash BTC found its Bottom tanking down -51% on the 19th May to $28,787 from $57,777 and had previous retraced from the ATH price @ $64,841 to $46,814 (-27%). BTC has been in a whale accumulation zone for the past 27 days from 19th May to 15th June. Our Swing Call Script triggered a strong buy signal for #BTC LONG when the 13 EMA crossed up above the 50 SMA on the 10th June; BTC has since increased over 10% in just over 5 days. From the current price level we have longs positioned and the current TP 1 is at the 127.20% Fibonacci level @ $74,647 (85% gain from current price level) and TP 2 at the 161.80% Fibonacci level @ $87,122 (116% from current price level). Note the price targets are for long term swings, we may be in this accumulation phase a little longer. Happy Trading :). See previous analysis below.
Bitcoin Update 02/04/21 Next Target @ $66,953 13% Gain New ATH in April
I've loved charting BTC last Month, analysis has been quite spot on just waiting on our new ATH now @$66,953 13% Gain from current price level. #Bitcoin has found key support around $58k price level. It looks like the Bitcoin Bulls are back in the market. Worst case scenario from here in the short-term could see the price test the 50SMA, and breaking below this level would see another test of the 200SMA before the anticipated move to the upside and our target of $66.953 at the 127.20% Fibonacci level. See previous analysis below. Happy trading :)
Update 29/03/21 Bitcoin next Target @ $66,953 21% Gain
Nice bounce from the whale accumulation zone at the 78.60% Fibonacci Level. Looks like the BTC Bulls are back in the market.
See previous analysis below.
BTC Monthly Outlook Update (23/03/2021) Approaching Whale Accumulation Zone at the 78.60% Fibonacci level @ $52,371. Interesting next few days from here as a bounce from the 200 SMA at the whale accumulation zone could finally see us break through the key resistance at the current ATH level from 14/03/21 @ $61,690. April is set to be a very interesting and pivotal month for the cryptocurrency space. See previous analysis and monthly outlook below. Happy Trading :) #whaleaccumulationzone
Update 21/03/21: Yesterday the Bulls failed to push the price higher and we had a small retracement down from $59.5k to $55.6 where we found some support of the current price level (-7%). From here the worst case scenario would find us in a key whale accumulation zone @ 78.60% Fibonacci level $52,371. However this scenario is unlikely to play out and as expected from the previous outlook before, we expect the Bulls to come back in the market, pushing as further to higher highs as we have been consolidating around this key price range between $54.5K to the current ATH @ $61.8k. If we fail to break past the previous ATH , the bearish scenario may see a test of the 200 SMA around the 78.60% Fibonacci level, otherwise the Bullish scenario is still in play. Note that from this current trend from 28th January we have only tested the 200 SMA once and a bounce from this level may signal a much stronger bullish move towards our price target $77,335 @ the 161.80% Fibonacci extension and further $107,340 @ the 261.80% Fibonacci level. So far great performance this month from £BTC as March is usually quite a bearish month looking back at the past. April looks ready for us to really fly, testing the 161.80% Fibonacci extension , but note this may not be a straight forward push but all the fundamentals are pointing towards the $70K as our next significant area of interest for the Bulls, currently a 16% gain from the current price level would see BTC reach $66,953 127.20% Fib extension. See previous analysis from 1st March 2021 below. Happy Trading :) $BTC #HODL
*Update 20/03/21
#BTC Monthly Outlook Update from 1st March 2021; 13 EMA crossing up 50 SMA showing strong bullish sentiment as we are about to enter the last week of the month, expect the bulls to come back and to push the price higher. Currently the 127.20% Fibonacci Target ($66,953) has not been tested yet, but we expect some big movement in price over the next few days and further going into the last week of the month (Yes, it has been March Madness), 13% Gain from the current price level @ $59,390 to $66,953 127.20% Fib extension. Our next target after this is $77,335 @ the 161.80% Fibonacci extension . From our analysis at the beginning of the month It looks like scenario 2 has been in play, see below previous analysis from 2nd March 2021.
In addition to previous price analysis, the Cryptocurrency 'Super Cycle' is in play as we are just at the brink of global adoption. 2017/18 was the hype era, we cannot continue to set targets based on the price movements during the cycle mainly fuelled by hyper and euphoria, it is now 4 years later and real development has been happening behind the scenes, a lot of people cannot quite comprehend the growth and the different cycle that we are now in as Moore's Law of exponential growth can only give us a hint at the growth that is about to be experienced over the next 4 year cycle. An increased influx of capital injection into this now trillion dollar market will only continue, as Defi takes its hold on current Global financial infrastructure, and yes history repeats itself, We call this the 'Roaring 20s' just like before at the end of WW1, the pandemic has only accelerated the current adoption rate of blockchain technology. As some are already aware, the best time to grow a million dollar portfolio was from 2009 to 2019 just after the housing market crash. The second best time in our lifetime is Now! from 2021 to 2029 after the pandemic market crash. We are still very much Bullish for BTC to reach our EOY Target of $356,000, See below key fundamentals which support our bullish sentiment.
*(March 02, 2021 Update)
BTC is currently consolidating at 61.80 Fibonacci Level. BTC outlook for the month ahead is still very much bullish . Although the sellers have been in control of the market since soaring to a new ATH on 21/02/21, BTC took a sharp retracement as expected at these new level of resistance as well as a new ATHof$58,792 on the Gemini Exchange. As from historic highs we see a lot of profit taking occurring after 3 weeks of setting new constant highs from the previous low of the last push wave which saw BTC setting a high of $42K and then sharply retracing down to $28,787 where we found the previous resistance and also the beginning of the last phase which saw one of the greatest run of Bitcoin in history, reaching the current ATH of $58,792.
With the current push phase now over we find ourselves asking how low can we go from here and when do we expect to break past a new ATH . This outlook is based on 2 possible scenarios which could both play out. We have seen the 50% Fibonacci retracement level respected on the last 2 Push phases which both set new ATHs, the first being $42K and latter, the recent high of $58K. As we have seen a strong retracement over the past 7 days back down to the 50% Fibonacci, it may be time for the BTC Bulls to regain control of the market as the current fundamentals point to the 50%-38.2% Fibonacci level of key resistance as well as a point of accumulation for the BTC whales, more importantly the $39,000 mark when looking left at the previous key resistance before the parabolic move to the $58k ATH .
With this in mind, from the current levels we could see the price of BTC sink further before the much expected move which could see BTC testing the previous High of $58k and further pushing to the 127.20% Fibonacci extension level setting a new ATH @ $66,953.
Scenario 2 would see the current push towards the ATH continue but may face some resistance, and further consolidation expected around $46k-$49k as they are the key Whale Supports towards the upside, so a further retracement could be in play, possibly testing the 50% Fibonacci level, as well as the 50 SMA , with a bounce confirming an explosive move to the upside which could see BTC easily smash past the 127.20% Fib extension level setting new fresh Highs between $67,000-$78,400+ by mid to late March. Use the buy zone indicated to map out your position as a possible 52% gain is achievable from the Buy zone. Stochastics showing an extremely oversold market condition. Happy Trading :) *
Key Supporting Fundamentals for BTC:
Strong Interest of Institutional Players
A survey of institutional investors and wealth managers who already engage with bitcoin reveals that 85 per cent plan to increase their investment in the cryptocurrency over the next two years.
The survey, which was commissioned by Nickel Digital Asset Management (Nickel), a regulated investment manager connecting traditional finance with the digital assets market, also reveals that between now and 2023, 72 per cent expect professional investors in general to invest in bitcoin for the first time or increase their exposure.
Current Economic Instability
The policy of the US Federal Reserve and the economic instability that has arisen as a result of the unprecedented emission of new dollars may further play a role in the growth of Bitcoin price...10% of the $380 billion stimulus money could be going directly into cryptocurrencies and Bitcoin .
Digital Gold
Crypto currencies certainly look as if they’re here to stay. It makes a lot of sense to have them in an increasingly digitised world. While bitcoin has a strong tendency to polarise opinion, it has now gained acceptance among some of the world’s largest financial institutions and payments companies. MasterCard, for instance, has said it will begin supporting crypto currencies on its network later this year. PayPal already allows eligible users to buy, sell and hold bitcoin in the US and expects to roll out its service in other territories soon.
The Case For Global Adoption and New Reserve Currency
Cryptocurrencies promise to help solve problems that are particularly acute in emerging markets (EM). Their governments are often centralized but relatively unreliable, which destabilizes currencies, opens the door to profiteering middlemen, and erodes public trust. Blockchain, the technology behind Bitcoin’s decentralized network, promises to cut out the grasping hands of governments and middlemen, and speed up transactions with more transparency and lower fees. It is offering what many EM customers are desperate for.
The Development and Extensions of Blockchain Technology
Due to the nature of blockchain technology’s ability to benefit all parties involved in different business operations. Since it was introduced in 2009 through the application of Bitcoin , blockchain technology continues to attract not just the financial institutions of the world, but also other fields and industries in insurance , law, entertainment and the Internet of Things ( IOT ) applications. Several scholars and advocates have also strongly suggested the use of the technology in voting systems globally, medical records and vehicle registrations by the state to further increase efficiency, simultaneously eradicating fraud in many areas. This technology does not only aim to improve conventional business operations but can also empower the greater society out of poverty as 1.7 billion adults in the world remain unbanked. The widespread adoption of a cryptocurrency like bitcoin running on the blockchain would mean that anyone with access to the internet can send and receive value from point A to B without the need of a third party.
Although many Banks were very hesitant and in fact spread fear in the markets due to cryptocurrencies being linked to nefarious activities on the dark web. A recent study by Goldman Sachs suggested that the adoption of blockchain technology in facilitating seamless cross border transactions without the worry of fraudulent transactions could save up to $6 billion a year; as the new models currently being developed by the bank would mean inefficient payment and accounting networks would be eradicated.

BTC Monthly Outlook Update 13 EMA crossing up 50 SMA Buy SignalUpdate 21/03/21: Yesterday the Bulls failed to push the price higher and we had a small retracement down from $59.5k to $55.6 where we found some support of the current price level (-7%). From here the worst case scenario would find us in a key whale accumulation zone @ 78.60% Fibonacci level $52,371. However this scenario is unlikely to play out and as expected from the previous outlook before, we expect the Bulls to come back in the market, pushing as further to higher highs as we have been consolidating around this key price range between $54.5K to the current ATH @ $61.8k. If we fail to break past the previous ATH, the bearish scenario may see a test of the 200 SMA around the 78.60% Fibonacci level, otherwise the Bullish scenario is still in play. Note that from this current trend from 28th January we have only tested the 200 SMA once and a bounce from this level may signal a much stronger bullish move towards our price target $77,335 @ the 161.80% Fibonacci extension and further $107,340 @ the 261.80% Fibonacci level. So far great performance this month from BTC as March is usually quite a bearish month looking back at the past. April looks ready for us to really fly, testing the 161.80% Fibonacci extension, but note this may not be a straight forward push but all the fundamentals are pointing towards the $70K as our next significant area of interest for the Bulls, currently a 16% gain from the current price level would see BTC reach $66,953 127.20% Fib extension. See previous analysis from 1st March 2021 below. Happy Trading :) $BTC #HODL
*Update 20/03/21
BTC Monthly Outlook Update from 1st March 2021; 13 EMA crossing up 50 SMA showing strong bullish sentiment as we are about to enter the last week of the month, expect the bulls to come back and to push the price higher. Currently the 127.20% Fibonacci Target ($66,953) has not been tested yet, but we expect some big movement in price over the next few days and further going into the last week of the month (Yes, it has been March Madness), 13% Gain from the current price level @ $59,390 to $66,953 127.20% Fib extension. Our next target after this is $77,335 @ the 161.80% Fibonacci extension . From our analysis at the beginning of the month It looks like scenario 2 has been in play, see below previous analysis from 2nd March 2021.
In addition to previous price analysis, the Cryptocurrency 'Super Cycle' is in play as we are just at the brink of global adoption. 2017/18 was the hype era, we cannot continue to set targets based on the price movements during the cycle mainly fuelled by hyper and euphoria, it is now 4 years later and real development has been happening behind the scenes, a lot of people cannot quite comprehend the growth and the different cycle that we are now in as Moore's Law of exponential growth can only give us a hint at the growth that is about to be experienced over the next 4 year cycle. An increased influx of capital injection into this now trillion dollar market will only continue, as Defi takes its hold on current Global financial infrastructure, and yes history repeats itself, We call this the 'Roaring 20s' just like before at the end of WW1, the pandemic has only accelerated the current adoption rate of blockchain technology. As some are already aware, the best time to grow a million dollar portfolio was from 2009 to 2019 just after the housing market crash. The second best time in our lifetime is Now! from 2021 to 2029 after the pandemic market crash. We are still very much Bullish for BTC to reach our EOY Target of $356,000, See below key fundamentals which support our bullish sentiment.
*(March 02, 2021 Update)
BTC is currently consolidating at 61.80 Fibonacci Level. BTC outlook for the month ahead is still very much bullish . Although the sellers have been in control of the market since soaring to a new ATH on 21/02/21, BTC took a sharp retracement as expected at these new level of resistance as well as a new ATHof$58,792 on the Gemini Exchange. As from historic highs we see a lot of profit taking occurring after 3 weeks of setting new constant highs from the previous low of the last push wave which saw BTC setting a high of $42K and then sharply retracing down to $28,787 where we found the previous resistance and also the beginning of the last phase which saw one of the greatest run of Bitcoin in history, reaching the current ATH of $58,792.
With the current push phase now over we find ourselves asking how low can we go from here and when do we expect to break past a new ATH . This outlook is based on 2 possible scenarios which could both play out. We have seen the 50% Fibonacci retracement level respected on the last 2 Push phases which both set new ATHs, the first being $42K and latter, the recent high of $58K. As we have seen a strong retracement over the past 7 days back down to the 50% Fibonacci, it may be time for the BTC Bulls to regain control of the market as the current fundamentals point to the 50%-38.2% Fibonacci level of key resistance as well as a point of accumulation for the BTC whales, more importantly the $39,000 mark when looking left at the previous key resistance before the parabolic move to the $58k ATH .
With this in mind, from the current levels we could see the price of BTC sink further before the much expected move which could see BTC testing the previous High of $58k and further pushing to the 127.20% Fibonacci extension level setting a new ATH @ $66,953.
Scenario 2 would see the current push towards the ATH continue but may face some resistance, and further consolidation expected around $46k-$49k as they are the key Whale Supports towards the upside, so a further retracement could be in play, possibly testing the 50% Fibonacci level, as well as the 50 SMA , with a bounce confirming an explosive move to the upside which could see BTC easily smash past the 127.20% Fib extension level setting new fresh Highs between $67,000-$78,400+ by mid to late March. Use the buy zone indicated to map out your position as a possible 52% gain is achievable from the Buy zone. Stochastics showing an extremely oversold market condition. Happy Trading :) *
Key Supporting Fundamentals for BTC:
Strong Interest of Institutional Players
A survey of institutional investors and wealth managers who already engage with bitcoin reveals that 85 per cent plan to increase their investment in the cryptocurrency over the next two years.
The survey, which was commissioned by Nickel Digital Asset Management (Nickel), a regulated investment manager connecting traditional finance with the digital assets market, also reveals that between now and 2023, 72 per cent expect professional investors in general to invest in bitcoin for the first time or increase their exposure.
Current Economic Instability
The policy of the US Federal Reserve and the economic instability that has arisen as a result of the unprecedented emission of new dollars may further play a role in the growth of Bitcoin price...10% of the $380 billion stimulus money could be going directly into cryptocurrencies and Bitcoin .
Digital Gold
Crypto currencies certainly look as if they’re here to stay. It makes a lot of sense to have them in an increasingly digitised world. While bitcoin has a strong tendency to polarise opinion, it has now gained acceptance among some of the world’s largest financial institutions and payments companies. MasterCard, for instance, has said it will begin supporting crypto currencies on its network later this year. PayPal already allows eligible users to buy, sell and hold bitcoin in the US and expects to roll out its service in other territories soon.
The Case For Global Adoption and New Reserve Currency
Cryptocurrencies promise to help solve problems that are particularly acute in emerging markets (EM). Their governments are often centralized but relatively unreliable, which destabilizes currencies, opens the door to profiteering middlemen, and erodes public trust. Blockchain, the technology behind Bitcoin’s decentralized network, promises to cut out the grasping hands of governments and middlemen, and speed up transactions with more transparency and lower fees. It is offering what many EM customers are desperate for.
The Development and Extensions of Blockchain Technology
Due to the nature of blockchain technology’s ability to benefit all parties involved in different business operations. Since it was introduced in 2009 through the application of Bitcoin , blockchain technology continues to attract not just the financial institutions of the world, but also other fields and industries in insurance, law, entertainment and the Internet of Things ( IOT ) applications. Several scholars and advocates have also strongly suggested the use of the technology in voting systems globally, medical records and vehicle registrations by the state to further increase efficiency, simultaneously eradicating fraud in many areas. This technology does not only aim to improve conventional business operations but can also empower the greater society out of poverty as 1.7 billion adults in the world remain unbanked. The widespread adoption of a cryptocurrency like bitcoin running on the blockchain would mean that anyone with access to the internet can send and receive value from point A to B without the need of a third party.
Although many Banks were very hesitant and in fact spread fear in the markets due to cryptocurrencies being linked to nefarious activities on the dark web. A recent study by Goldman Sachs suggested that the adoption of blockchain technology in facilitating seamless cross border transactions without the worry of fraudulent transactions could save up to $6 billion a year; as the new models currently being developed by the bank would mean inefficient payment and accounting networks would be eradicated.

