Microsoft - This bullrun will end soon!💊Microsoft ( NASDAQ:MSFT ) might reverse soon:
🔎Analysis summary:
Microsoft created a textbook bullish break and retest back in the beginning of 2025. After this retest, we then witnessed a major rally of about +50% over the past couple of months. But considering the recent weakneses and resistance, this rally might be over very soon.
📝Levels to watch:
$550
SwingTraderPhil
SwingTrading.Simplified. | Investing.Simplified. | #LONGTERMVISION
Search in ideas for "MICROSOFT"

Microsoft - A very profitable repetition!💰Microsoft ( NASDAQ:MSFT ) just repeats the cycle:
🔎Analysis summary:
At this exact moment, Microsoft is once again retesting the upper channel resistance trendline. Following all previous cycles, there is a 100% chance that we will see a short term retracement. Since the trend remains bullish, the all time high break and retest will follow.
📝Levels to watch:
$450, $700
SwingTraderPhil
SwingTrading.Simplified. | Investing.Simplified. | #LONGTERMVISION

Microsoft's Acquisition of Activision: Is It a Wise Investment?Microsoft's Acquisition of Activision: Is It a Wise Investment?
Microsoft's recent acquisition of Activision Blizzard for a whopping $68.7 billion marks a significant move in the tech and gaming industry. After overcoming regulatory hurdles, the deal is now sealed, and Activision Blizzard is officially a part of the Microsoft family. But what does this mean for Microsoft's investors, and is the tech giant still an attractive investment option? Let's delve into the details.
Before the acquisition, Microsoft was already a formidable presence in the stock market. However, its valuation had climbed to relatively high levels, leading some to wonder about its investment potential. By committing a substantial portion of its cash reserves to the acquisition of Activision, Microsoft has entered a new phase that merits closer examination.
As of the fourth quarter of fiscal year 2023, Microsoft held over $111 billion in cash and equivalents on its balance sheet. The acquisition of Activision represents a significant allocation of these cash reserves, and at first glance, it appears to offer compelling value.
Activision, prior to the merger, boasted an impressive profit margin of 25%. The merger allows for the consolidation of various roles within the newly integrated entity, potentially leading to improved profit margins. Microsoft, with its vast resources, can contribute to enhanced product development, creating a mutually beneficial synergy.
But does this make Microsoft's stock a must-buy? To gauge its attractiveness, let's examine some key financials. In the past year, Activision generated $8.7 billion in revenue and $2.2 billion in profits. This valuation places the stock at 7.9 times sales and 31 times earnings. In comparison, Microsoft is trading at 12 times sales and 34 times earnings. Essentially, Microsoft's acquisition of Activision appears to be a cost-effective endeavor, as it paid less for Activision than it typically spends on share repurchases.
However, it's essential to keep things in perspective. Microsoft's annual revenue stands at a staggering $212 billion, with profits of $72 billion. Integrating Activision Blizzard's numbers from the past year would lead to modest increases of 4% in revenue and 3% in earnings for Microsoft. As a result, the valuations for both revenue and earnings would only experience marginal decreases. While Microsoft's stock might become slightly more affordable, the change is not substantial.
So, should investors avoid Microsoft altogether? Not necessarily. It's crucial to acknowledge that Microsoft's stock is relatively expensive compared to its tech sector peers, and the near-term outlook isn't significantly brighter. Currently trading at 30 times forward earnings, it carries a 50% premium compared to the S&P 500's forward price-to-earnings (P/E) ratio of 20. Such a premium is substantial, especially for a stock expected to achieve an 11% revenue growth during fiscal year 2024.
Furthermore, with high interest rates, companies can easily generate a 4% return on idle cash reserves. In this context, 4% of the $68.7 billion spent on the Activision acquisition amounts to $2.7 billion, surpassing Activision's profits over the past year. This raises questions about whether the investment in Activision was the most prudent use of Microsoft's funds, especially considering that the deal was initiated during a different interest rate environment in early 2022.
While Microsoft boasts substantial investments in artificial intelligence, a thriving cloud computing division, and a formidable gaming arm, some investors might find the stock overvalued. There are other stocks in the market exhibiting faster growth and more attractive valuations, making them worthy alternatives to consider before committing to Microsoft.
In conclusion, Microsoft's acquisition of Activision Blizzard is a significant move, but it doesn't drastically alter the company's financial landscape. Microsoft's stock remains relatively expensive, and the investment in Activision, while strategic, may not be the sole determinant of its future success. Investors should carefully weigh their options and consider the broader market context before making investment decisions.

Microsoft - This chart is too obvious!💡Microsoft ( NASDAQ:MSFT ) perfectly respects structure:
🔎Analysis summary:
Back in April of 2025, Microsoft created a textbook all time high bullish break and retest. After this move, Microsoft started a rally of +50%, perfectly in conformity with the rising channel pattern. The trend remains bullish for now, but a shorter term correction will follow quite soon.
📝Levels to watch:
$650
SwingTraderPhil
SwingTrading.Simplified. | Investing.Simplified. | #LONGTERMVISION

Microsoft (MSFT): What’s Next? Will It Break $455.34 Morning, Trading Family! Let’s Talk About Microsoft (MSFT): Will It Break $455.34 or Head Lower?
Microsoft’s stock is at a key level, and the next move could set the tone for what’s ahead. The magic number right now is $455.34. Will we see a breakout to new highs, or could the price dip lower before bouncing back? Let’s break it down step by step so everyone’s ready!
If Microsoft Breaks Above $455.34
If the stock moves above $455.34 and holds steady, it could signal that buyers are in control.
What could happen?
The price might head up toward $460 or even $465. These levels could be the next spots where the stock takes a breather.
What should we watch?
Look for strong movement above $455.34 with good trading volume (lots of action). If the price quickly dips back below, it could mean the breakout isn’t real yet.
How can we trade it?
If the price holds above $455.34, it might be a good time to think about buying with a target around $460. Just make sure to use a stop-loss in case the trade doesn’t go as planned.
If Microsoft Drops Below $455.34
If the stock struggles to stay above $455.34, we could see a pullback.
The first key level:
Watch $449. This is the next area where buyers might step in to stop the price from falling.
If $449 doesn’t hold:
The price could drop further, landing somewhere in the $443–$438 range, where stronger support is likely.
How can we trade it?
Be patient! If the price dips, wait for signs that it’s stabilizing at a support level before making any moves.
What If the Price Drops Below $438?
If MSFT falls below $438, it could mean the stock is turning more bearish. At that point, we’ll need to step back and reassess the trend.
Tips for Today’s Trading
If you’re bullish: Wait for the price to break and hold above $455.34 before jumping in.
If you’re bearish: Watch for a clean break below $449 for potential short opportunities.
Always: Use stop-losses to protect yourself and trade with a plan!
Bottom Line:
The $455.34 level is the line in the sand. If we break above, it’s good news for the bulls. If not, we could see a dip to $449 or lower.
Kris/ Mindbloome Exchange
Trade What You See

Microsoft -> It's Now Or NeverHello Traders,
welcome to this free and educational multi-timeframe technical analysis .
On the weekly timeframe Microsoft stock just recently created an awesome double bottom and also already broke above the neckline confirming the weekly pattern.
As we are speaking the market is retesting the neckline of the double bottom which is now turned support so from a weekly perspective I just do expect the continuation towards the upside from here.
On the daily timeframe however the market is currently massively bearish and I definitely don't want to catch a falling knife so I am now just waiting for some bullish structure on the daily timeframe before I will look to enter longs to capitalize on the continuation towards the upside.
Thank you for watching and I will see you tomorrow!
You can also check out my previous analysis of this asset:

Microsoft -> All Timeframes Are BullishHello Traders,
welcome to this free and educational multi-timeframe technical analysis .
Microsoft is looking extremely juicy right now. From a weekly perspective we just created a long term double bottom and we also broke above a long term downtrend line.
There is definitely the possibility that after a short term pullback, we will start the next bullrun from here, creating new all-time-highs in the process.
From a daily perspective I am just waiting for a short term retest of the weekly neckline of the double bottom and then there is a very high chance that we will also see the daily continuation to the upside from here.
Thank you for watching and I will see you tomorrow!
You can also check out my previous analysis of this asset:

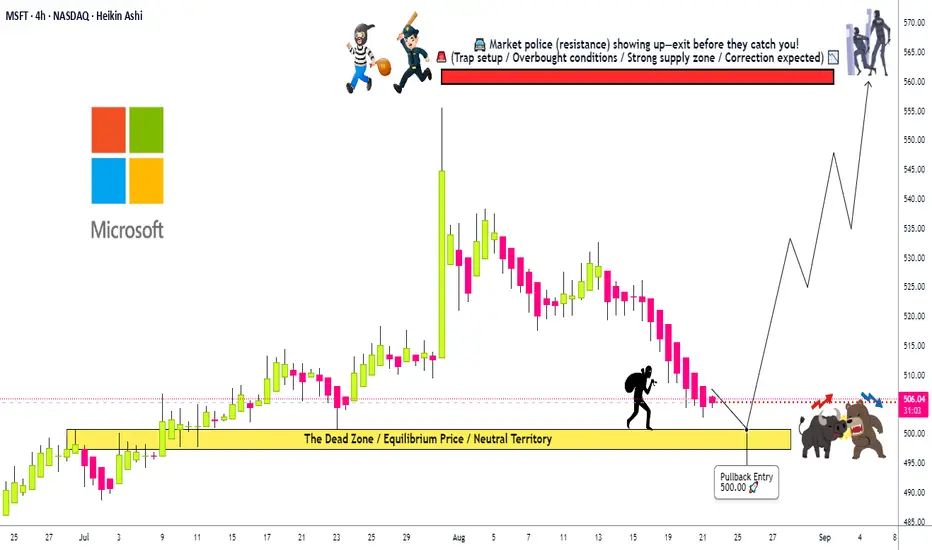
Microsoft: The Perfect Pullback Is Coming. Are You Ready?🌟 MSFT HEIST ALERT! 🌟 Steal from the Cops, Not from the Citizens! 🚔➡️🤑
Dear Ladies & Gentleman of the Thief Trading Guild, 🎩👒
Based on the 🔥Thief Trading Style Analysis🔥, here is our master plan to heist the Microsoft Corporation (MSFT) fortress. Our intel confirms a BULLISH ambush is setting up! It's time to loot! 💰💸✈️
🦹♂️ THE HEIST PLAN (SWING TRADE) 🦹♂️
Entry Point: The Perfect Pullback Loot Zone! 🎯
We're waiting for the asset to pull back to our LAYERED LIMIT ORDER TRAP! 🪤 Thief OG's use multiple entries to maximize the steal!
LAYER 1: 510.00 (First dibs!)
LAYER 2: 505.00 (Loading the bag!)
LAYER 3: 500.00 (MAIN HEIST - Perfect Pullback!)
LAYER 4: 498.00 (Bonus loot! Add more layers based on your own risk, thieves!)
Stop Loss: The Getaway Car Location! 🛑🏎️
This is Thief SL @ 485.00. This is where the trade idea is invalidated. Dear Thieves, adjust your final SL based on your own risk, strategy, and how many layers you used. Don't get caught! 👮♂️🚔
Target: The Police Barricade! 🚧🚨
Intel shows a major resistance wall (Police Barricade) at 565.00. Our mission is to escape with the stolen money BEFORE we get there! Escape Target: 560.00! Count your profits and live to trade another day! 💵🎉🤝
📢 THIEF'S BROADCAST 📢
Yo! Listen up, crew! 🗣️ If you're placing limit orders on this pullback, your stop loss should be set ONLY AFTER your order is filled! You feel me? Now, if you're smart, you'll place that stop loss where I told you 📍, but if you're a rebel, you can put it wherever you like 🤪 - just remember, you're playing with fire 🔥, and it's your risk, not mine! 👊
⚠️ TRADING ALERT : EARNINGS & NEWS ⚠️
MSFT is a big cap stock, and news/earnings can cause extreme volatility! To protect your stolen loot:
Avoid entering new layers before major news.
Consider taking some profit before earnings.
Use trailing stop-loss orders to protect running positions!
💖 Supporting our robbery plan = 💥Hitting the Boost Button💥 It fuels our getaway car and helps us find the next big heist! Let's make stealing money look easy! 🏆💪❤️🎉
I'll see you at the next heist, so stay tuned! 🤑🐱👤🤗🤩
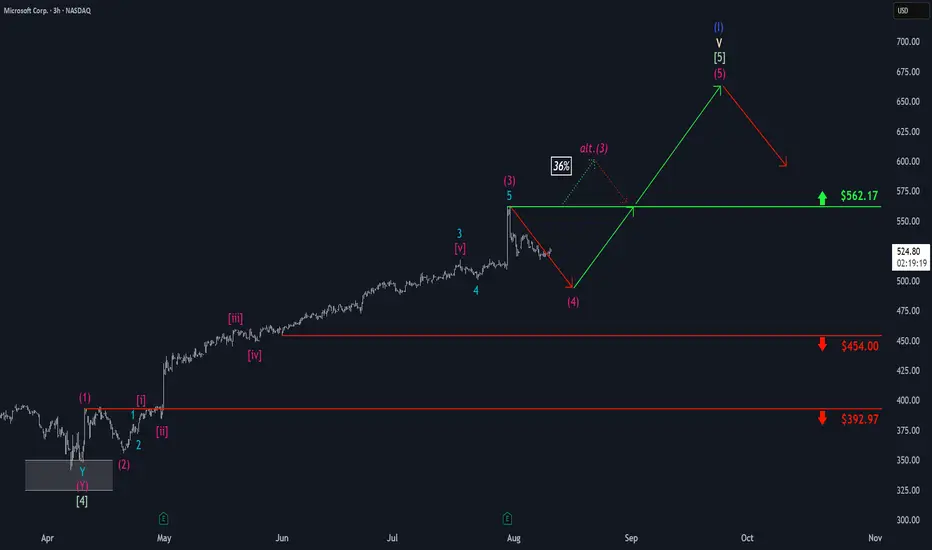
Microsoft: Wave (3) Complete – Wave (4) Pullback in ProgressAs Microsoft has reached a pronounced peak, followed by a notable move to the downside, er now consider wave (3) finished. Thus, we see price currently in the corrective phase of wave (4), which still has some immediate downside potential but should hold above support at $454. The subsequent wave (5) is expected to mark the high of the broader blue wave (I). At this point, we assign a 36% probability to the scenario where wave alt.(3) makes a higher high above the new resistance at $562.17.
Microsoft: You can do it 💻Despite the recent outage, Microsoft is fighting its way back to the top and should exceed the resistance line at $265.00 soon to continue its upwards slope. Our alternative scenario with a probability of 40% implies that the stock could tire and drop below the support line at $212.25, instead of rising to the top. In this case, the course would sink into the grey target zone to fulfill the superior grey wave alt. IV before heading back North in the longterm.

MICROSOFT LONGHi there,
As you can see it is following the channel well. Back in 2020 it dropped then over the next 6 months, it went up 50% more than the previous peak. Since it is at the lower end of the channel and the BULLISH uptrend since 2007, we can expect MICROSOFT to bounce back.
HOWEVER, we shall WAIT for the CLOSURE of the candle when MARKET opens and we SHALL wait further to let it BREATH then enter the trade and let it ROLL for a nice LONG SWING.
Kind regards

Microsoft: It ain’t over! 🙌🙌🙌In our current analysis of the Microsoft stock, we have identified a turnaround area around $272.26. After reaching a low there, the stock should soar to new heights around $330.
Happy weekend!

Microsoft -> Very Bullish Inverted Head And ShouldersHello Traders,
welcome to this free and educational multi-timeframe technical analysis.
Microsoft just recently perfectly tested and rejected a quite strong and obvious previous support/resistance zone towards the upside. It also seems like Microsoft is about to create a double bottom from a weekly perspective, which is generally speaking a very bullish pattern, leading to more upside potential.
On the daily timeframe we actually have a quite interesting situation. You can see that the market is currently crating an inverted head and shoulders and just yesterday and today broke above and retested the neckline, which again is simply previous resistance which is now turned support.
Now from here I do expect further continuation towards the upside, confirming the bullish inverted head and shoulders pattern.
Thank you for watching and I will see you tomorrow!

Microsoft (MSFT) Share Price Jumps Nearly 9% – What’s Next?Microsoft (MSFT) Share Price Jumps Nearly 9% – What’s Next?
As the chart shows, Microsoft (MSFT) shares surged sharply, forming a large bullish gap: while trading closed around $391 on 30 April, yesterday’s candlestick closed just below the $425 mark.
What Drove the Rally in Microsoft Shares?
Microsoft released its financial results for the first quarter of 2025, exceeding Wall Street expectations on both revenue (actual = $70.1 billion, 2.4% above forecasts) and earnings per share (actual = $3.46, 7.4% above forecasts).
Particular attention was drawn to the strong performance of Azure – revenue from Azure and other cloud services soared by 33% year-on-year. A significant part of this growth was fuelled by robust demand for artificial intelligence services, which helps ease concerns about the return on large-scale infrastructure investments related to AI.
In addition, Microsoft issued an upbeat outlook for the next quarter, which ultimately triggered the sharp rise in its share price.
Technical Analysis of MSFT Chart
Yesterday’s candlestick closed near its low (highlighted by the arrow), indicating that bears were active during the trading session. From a technical analysis perspective, this can be explained by the proximity of the price to two key resistance lines:
1 → The upper boundary of a descending channel drawn from significant price action patterns (marked in red). The relevance of this channel is confirmed by the price’s behaviour near its median line (dashed).
2 → A former trendline that served as support throughout 2024.
Therefore, a short-term correction cannot be ruled out following the sharp rally in MSFT shares, potentially tempering some of the enthusiasm generated by Microsoft’s strong quarterly report.
This article represents the opinion of the Companies operating under the FXOpen brand only. It is not to be construed as an offer, solicitation, or recommendation with respect to products and services provided by the Companies operating under the FXOpen brand, nor is it to be considered financial advice.

Microsoft, Meta, Nvidia — Lifting Off in the AI MarketThe “Big Three” are breaking new records: #Facebook (Meta) surged to $784.39 as AI-powered targeting tools pushed ad revenues higher, #Microsoft hit $551.10 by combining rapid Azure growth with new monetization from Copilot across its ecosystem, and # Nvidia climbed to a record $183.21, driven by unwavering demand for AI computing.
Key growth drivers:
#Facebook (Meta): Markets welcomed strong ad revenue projections, outweighing concerns about capex. AI tools for ad targeting significantly improved performance.
#Microsoft: Azure’s YoY growth reached ~39%, Copilot crossed 100M monthly users, and the company committed up to $30B in upcoming AI infrastructure.
#Nvidia: Persistent demand for AI GPUs and networking gear from hyperscalers, plus a $4T valuation milestone, keeps momentum strong.
What’s fueling continued upside:
#Facebook (Meta): AI tools like Advantage+ improve audience targeting and ad creatives, while Reels and recommendation feeds increase impressions and eCPM. Large-scale investment in data centers and in-house AI models open new monetization paths. Stable rate expectations also favor growth stocks like META.
#Microsoft: Growth is driven by Azure’s ongoing expansion (~39% YoY), the second wave of cloud migration, and strong monetization via Microsoft 365 and GitHub Copilot. A $30B capex plan will expand data center capacity. A broad portfolio — Windows, Office, Gaming — supports steady margins.
#Nvidia: The AI compute supercycle is in full swing. Demand for H-series GPUs and InfiniBand networks exceeds supply. The clear upgrade roadmap (H200/Blackwell) extends through 2026, while CUDA ecosystem expansion strengthens customer lock-in. Strong cash flow and record valuation support M&A, buybacks, and accelerated development.
According to FreshForex , current price levels make #Meta and #Microsoft attractive for long positions. #Nvidia offers room for both upside and pullbacks, depending on news flow.
Microsoft - We still have to be patient...NASDAQ:MSFT dropped after reporting earnings and can now create a short term correction!
Simplicity is key, also when it comes to trading the higher timeframes on stocks. All you need are three lines in order to fully understand the trading history and also future of Microsoft. If we get a retest of the triangle breakout level, which is perfectly lining up with the rising trendline, a bullish continuation will be quite expected. Just wait for confirmation first though!
Levels to watch: $350
Keep your long term vision,
Philip - BasicTrading

Microsoft: New Target Zone in PlaySince our last update, Microsoft shares have continued to decline, but there is still potential for an upside move. We do not yet consider the turquoise wave X to be complete. Once its high is established below the resistance at $562.17, we expect price to head lower toward the wave Y low. Our revised magenta long Target Zone is set between $477.87 and $451.84. The formation of this low should also mark the completion of magenta wave (4). Afterward, we anticipate the start of a new upward impulse within wave (5), which should push the stock above the $562.17 resistance and complete the larger blue wave (I). Alternatively, we assign a 36% probability to a scenario in which the recent high at $562.17 marked the end of beige wave alt.III . In this case, a decline below the support at $392.97 would be expected, forming the low of wave alt.IV .

Microsoft - We Will See A Correction!Microsoft ( NASDAQ:MSFT ) can actually create a correction:
Click chart above to see the detailed analysis👆🏻
Microsoft is one of the strongest stocks over the past decade and also over the past couple of months, there was no clear sign of weakness. Therefore, it is actually not extremely likely that a correction will happen, but if it does, this will offer a long term texbook trading opportunity.
Levels to watch: $420, $350
Keep your long term vision,
Philip (BasicTrading)

MICROSOFT: Channel Down bottomed. Bullish wave starting to 540.MSFT is neutral on its 1D technical outlook (RSI = 48.171, MACD = -0.910, ADX = 23.585) as since the September 6th Low it has been ranging sideways. Despite the lack of trend, this price action still hit the bottom of the long term Channel Up and technically the new bullish wave should start. The conditions for that are perfect as the 1D MACD just formed a Bullish Cross. The last bullish wave touched the HH trendline of the Channel Up after surpassing the 1.786 Fibonacci extension. That is our current target (TP = 540).
See how our prior idea has worked out:
## If you like our free content follow our profile to get more daily ideas. ##
## Comments and likes are greatly appreciated. ##

MICROSOFT: Bearish breakout under the 1D MA50.MSFT has turned neutral on its 1D technical outlook (RSI = 46.496, MACD = 1.200, ADX = 24.141) as the price reached the 1D MA50 for the first time since late October on a sideways price action. Since the 1 year pattern is a Channel Up, we expect its bottom to get tested (TP = 345.00) if the 1D MA50 is crossed. Consider it a bearish breakout signal.
See how our prior idea has worked:
## If you like our free content follow our profile to get more daily ideas. ##
## Comments and likes are greatly appreciated. ##

Microsoft's Remarkable 33% YTD Growth: A Deep Dive into Its ProsMicrosoft's Remarkable 33% YTD Growth: A Deep Dive into Its Prospects
Microsoft Corporation has been on a remarkable journey in 2023, with its shares showcasing an impressive year-to-date growth of 33%. This ascent has caught the attention of investors for several compelling reasons. As a tech giant, Microsoft has not only solidified its presence in the rapidly evolving realm of artificial intelligence (AI) but has also demonstrated remarkable resilience to economic challenges, setting it apart from many industry peers. In addition to these strengths, Microsoft's standing as a dominant player in the software sector, with a portfolio that includes iconic brands such as Windows, Office, Azure, and LinkedIn, further enhances its appeal.
Despite its strong performance earlier in the year, the tech market has experienced a modest downturn over the past three months. This market correction has led to a 7% dip in Microsoft's stock value since July, aligning it with declines witnessed by competitors like Apple and Amazon. This adjustment in stock price presents an opportune moment for investors to delve deeper into the growth potential of a high-performing company like Microsoft and consider it as a prospective investment.
Here are three crucial insights that savvy investors should be aware of regarding Microsoft:
Enormous Earnings Potential in AI:
Microsoft's strategic investments in the AI domain have been nothing short of visionary. In 2019, the company committed $1 billion to OpenAI, the developer behind ChatGPT, and later increased its stake to 49%. This partnership has given Microsoft access to cutting-edge AI technology, allowing the integration of AI-powered features throughout its software portfolio.
In July, Microsoft indicated that investors should expect "gradual" revenue growth from its AI offerings in fiscal 2024. However, considering the sheer dominance of Microsoft's brand portfolio and the advanced capabilities of OpenAI, this projection may underestimate the actual impact and potential of AI-driven revenue growth.
Wedbush analyst Dan Ives has observed a significant surge in activity on Microsoft's cloud service, Azure, following the introduction of AI tools. This uptick could potentially lead to a remarkable 25% revenue growth for Azure in the first quarter of 2024. Given that Azure already experienced substantial 19% year-over-year growth in fiscal 2023, this projection seems reasonable. Furthermore, Microsoft 365 is set to introduce an AI assistant called CoPilot, available for $30 per month as an add-on to existing subscriptions. Microsoft's strong foothold in cloud computing and productivity software positions it favorably to diversify its AI offerings and capitalize on this thriving industry.
Attractive Valuation Relative to Other AI Stocks:
While chipmakers like Nvidia and Advanced Micro Devices (AMD) have garnered significant attention in the context of AI growth, their stocks have witnessed substantial increases of approximately 198% and 59%, respectively, since the start of the year. These companies play pivotal roles in AI hardware development, but their recent surges have led to elevated stock prices. In comparison, Microsoft appears to offer better long-term value.
A key metric for evaluating stock value is the forward price-to-earnings (P/E) ratio. A P/E ratio below 20 is typically considered undervalued, and Microsoft is the closest to this figure among prominent AI players. Moreover, Microsoft's substantial investment in OpenAI and its dominance in various market segments suggest similar or even greater earnings potential within the lucrative AI industry. Microsoft's steady stock growth and consistent earnings growth make it an attractive choice, especially as expected earnings growth may already be reflected in the valuations of its peers.
Reliable Dividend Growth:
Microsoft stands out for its consistent dividend growth, boasting an impressive streak of 19 consecutive years of increases. Over the years, the company's dividend has grown from a modest $0.08 in 2003 to a substantial $0.68 in 2022. Recently, Microsoft announced another dividend hike, exceeding 10% to reach $0.75. While Microsoft's dividend yield of 0.87% may appear modest compared to leading dividend stocks like Verizon, it surpasses the yields of its tech competitors. Amazon and Alphabet offer no dividends, while Apple's dividend yield stands at 0.56%.
Microsoft's sustained commitment to dividend growth underscores management's unwavering confidence in its financial outlook. This, combined with its consistent stock appreciation, positions Microsoft as an appealing choice for long-term investors seeking both stability and growth potential.
In conclusion, Microsoft's journey in 2023 has been marked by significant achievements and a noteworthy stock performance. Its strategic investments in AI, attractive valuation relative to AI peers, and reliable dividend growth make it a compelling choice for investors looking to capitalize on the company's strong position in the tech industry and its promising prospects in the field of artificial intelligence. As the tech landscape continues to evolve, Microsoft remains a key player to watch for both its resilience and innovation.
Our preference
The upside prevails as long as 285.85 is support.

Microsoft pulling back?Microsoft
Short Term
We look to Buy at 273.34 (stop at 266.24)
Previous resistance at 275.00 now becomes support. Choppy price action seen. We can see no technical reason for a change of trend. We therefore, prefer to fade into the dip with a tight stop in anticipation of a move back higher.
Our profit targets will be 292.57 and 303.00
Resistance: 293.00 / 315.00 / 320.00
Support: 275.00 / 250.00 / 200.00
Disclaimer – Saxo Bank Group. Please be reminded – you alone are responsible for your trading – both gains and losses. There is a very high degree of risk involved in trading. The technical analysis, like any and all indicators, strategies, columns, articles and other features accessible on/though this site (including those from Signal Centre) are for informational purposes only and should not be construed as investment advice by you. Such technical analysis are believed to be obtained from sources believed to be reliable, but not warrant their respective completeness or accuracy, or warrant any results from the use of the information. Your use of the technical analysis, as would also your use of any and all mentioned indicators, strategies, columns, articles and all other features, is entirely at your own risk and it is your sole responsibility to evaluate the accuracy, completeness and usefulness (including suitability) of the information. You should assess the risk of any trade with your financial adviser and make your own independent decision(s) regarding any tradable products which may be the subject matter of the technical analysis or any of the said indicators, strategies, columns, articles and all other features.
Please also be reminded that if despite the above, any of the said technical analysis (or any of the said indicators, strategies, columns, articles and other features accessible on/through this site) is found to be advisory or a recommendation; and not merely informational in nature, the same is in any event provided with the intention of being for general circulation and availability only. As such it is not intended to and does not form part of any offer or recommendation directed at you specifically, or have any regard to the investment objectives, financial situation or needs of yourself or any other specific person. Before committing to a trade or investment therefore, please seek advice from a financial or other professional adviser regarding the suitability of the product for you and (where available) read the relevant product offer/description documents, including the risk disclosures. If you do not wish to seek such financial advice, please still exercise your mind and consider carefully whether the product is suitable for you because you alone remain responsible for your trading – both gains and losses.

Microsoft at Key SupportMicrosoft
Short Term - We look to Buy at 273.03 (stop at 269.68)
Preferred trade is to buy on dips. A higher correction is expected. Previous support located at 280.00. 280.00 continues to hold back the bears. The bias is still for higher levels and we look for any dips to be limited.
Our profit targets will be 302.57 and 309.50
Resistance: 300.00 / 315.00 / 350.00
Support: 280.00 / 260.00 / 250.00
Disclaimer – Saxo Bank Group. Please be reminded – you alone are responsible for your trading – both gains and losses. There is a very high degree of risk involved in trading. The technical analysis, like any and all indicators, strategies, columns, articles and other features accessible on/though this site (including those from Signal Centre) are for informational purposes only and should not be construed as investment advice by you. Such technical analysis are believed to be obtained from sources believed to be reliable, but not warrant their respective completeness or accuracy, or warrant any results from the use of the information. Your use of the technical analysis, as would also your use of any and all mentioned indicators, strategies, columns, articles and all other features, is entirely at your own risk and it is your sole responsibility to evaluate the accuracy, completeness and usefulness (including suitability) of the information. You should assess the risk of any trade with your financial adviser and make your own independent decision(s) regarding any tradable products which may be the subject matter of the technical analysis or any of the said indicators, strategies, columns, articles and all other features.
Please also be reminded that if despite the above, any of the said technical analysis (or any of the said indicators, strategies, columns, articles and other features accessible on/through this site) is found to be advisory or a recommendation; and not merely informational in nature, the same is in any event provided with the intention of being for general circulation and availability only. As such it is not intended to and does not form part of any offer or recommendation directed at you specifically, or have any regard to the investment objectives, financial situation or needs of yourself or any other specific person. Before committing to a trade or investment therefore, please seek advice from a financial or other professional adviser regarding the suitability of the product for you and (where available) read the relevant product offer/description documents, including the risk disclosures. If you do not wish to seek such financial advice, please still exercise your mind and consider carefully whether the product is suitable for you because you alone remain responsible for your trading – both gains and losses.
