Could A Mean-Reversion For EURSEK Be In Play?Technicals:
EURSEK seems to be a bit overstretched. A reversion to the mean could ensue.
Oversold oscillators
Daily uSd
Weekly d3
Search in ideas for "oscillator"

Low MFI on weekly, correlated with Bear marketsimple enough, MFI (or RSI or other oscillators) low on weekly, we're likely in a bearish market. Waiting for 27k for reversal based on Elliot Waves and Fibonacci retracement.

Basic Attention Token (BAT) / BTC - Regular Bullish divergenceFollowing a near 80% correction since August and oversold condition (orange / dark orange column); an ‘incredible buy’ opportunity now exists.
The above 2-day chart has now printed Regular bullish divergence between price action and all oscillators (RSI, Stochastic RSI, & Money Flow Index). Divergence with all three is powerful.
Is it possible price action falls further? Absolutely.
Is it probable? Very unlikely.
Target? 5000 sats or 500%+ from here.
Good luck & be patient.

short sellHi friends
A triangle is formed in one hour
Which has raised the trend
Reaching the resistance zone, this trend changes and declines
So we have to wait to get closer to this area and get a good profit in the downward trend in terms of divergences in oscillators in the monthly and weekly time.
Please do not suffice with this analysis and be sure to check the chart. Thank you for being successful and rich


BTC trendingI probably rely too much on oscillators, but this has proven true in the past so I think the next 10 days will continue upward.

bottom fishing"George Lane identified another form of divergence to predict bottoms or tops, dubbed “set-ups.”
A bull set-up is basically the inverse of a bullish divergence. The underlying security forms a lower high, but the Stochastic Oscillator forms a higher high. Even though the stock could not exceed its prior high, the higher high in the Stochastic Oscillator shows strengthening upside momentum. The next decline is then expected to result in a tradable bottom."
A bear set-up occurs when the security forms a higher low, but the Stochastic Oscillator forms a lower low. Even though the stock held above its prior low, the lower low in the Stochastic Oscillator shows increasing downside momentum. The next advance is expected to result in an important peak.

A fool's buy order.Hi.
I've had a lot of burns with choosing the right entry points in different assets,
so I've formed a strong cynicism towards the 2024 market.
CHZ is a great asset, exploding in the good old days.
Yes, I see a lot of people waiting for his shot right now.
However, using a large timeframe (10D) and the latest Linear Regression Oscillator ,
you can see that things could be potentially volatile over the next few months
and a squeeze to the lows is possible.
Oversold conditions may develop for some more time.
In addition, my favourite SQZMOM warns of an imminent start
of a downward expansion (grey cross).
What did I do?
I placed a buy order.
At $0.015 . :)
If I turn out to be right, I will enter more than successfully.
If it turns out that the Daily timeframe has already confirmed
support and a move is only forming upwards,
I will consider buying from current levels.

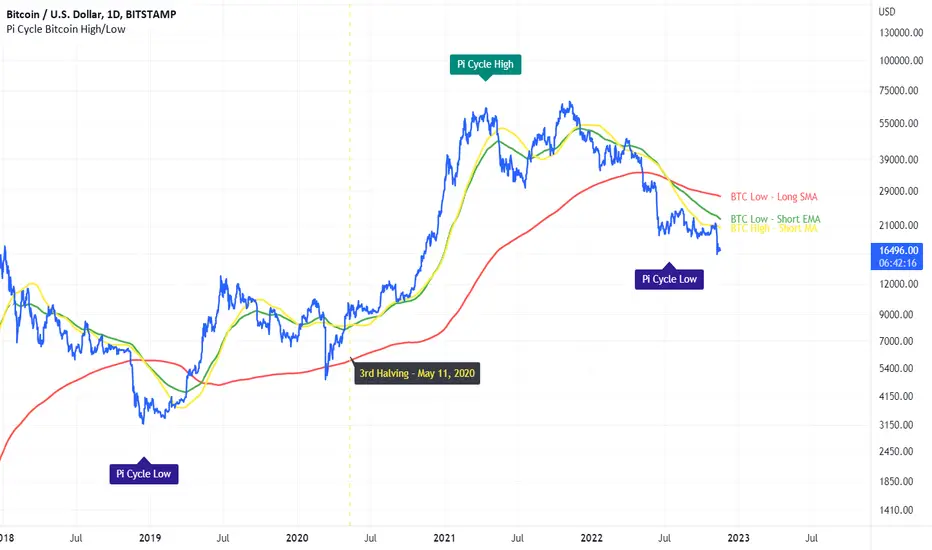
Improper performance of Pi-Cycle BottomThe Pi-Cycle Bottom Oscillator issued a bottom signal about three months ago when the price of Bitcoin was above $20,000. But today we see that this signal was not correct. This issue can question the performance of this oscillator
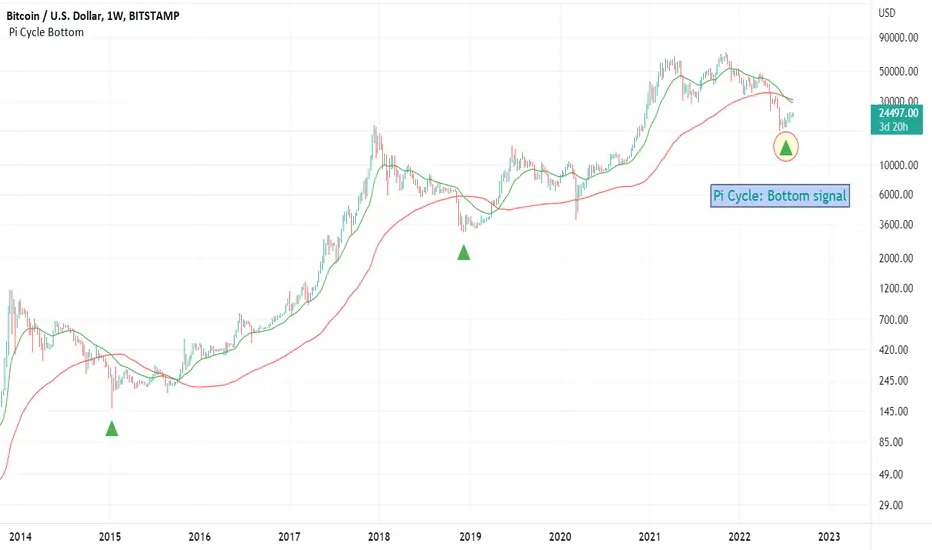
BTC Pi Cycle bottom: Bottom signalThe Pi-cycle oscillator signals the bottom of the market. In the previous three cycles, this oscillator has worked properly.
a bull set-up from Stochastic Full indicator.According to the Chart School from Stockcharts.com, a bull set-up from stochastic full is basically the inverse of a bullish divergence . The underlying security forms a lower high, but the Stochastic Oscillator forms a higher high. Even though the stock could not exceed its prior high, the higher high in the Stochastic Oscillator shows strengthening upside momentum. The next decline is then expected to result in a tradable bottom.
Horizontal lines and zones are supports (entry for bulls and exit for bears) and resistances (exits for bulls and entries for bears).
Diagonal lines from Fib fan/channel are for trend-determination and additional levels for active trading.
The market is actively moving so the entries and exits constantly change. Trade small if you want to practice!

126k was the topAs you can see, on the monthly chart we had a peak every time the Ultimate Oscillator reached a value of 53. simple.

MAGA / TETHER Update ( coinEx )According to the oscillator that I use, the exit signal from the sell transaction has been issued.


Stochastic Divergence - Identifying DivergenceStochastic Divergence is one of the most powerful leading indicators of price. Convergence will show price and stochastic oscillator moving towards each other. Divergence show the price and stochastic moving away from each other.

FirstRand - Area of interest- Price has pulled back from its recent swing high of R74.75
- Currently in a support zone where i will look to open a starter position and add to as the price action develops.
- RSI deeply oversold with a relief bounce likely.
- Only below R60 do i turn bearish on the overall picture.
The Relative Strength Index (RSI) is a popular momentum indicator used by traders to evaluate overvalued or undervalued conditions in the price of a security. It measures the speed and magnitude of a security’s recent price changes and is displayed as an oscillator on a scale of zero to 100. The RSI can provide insights into bullish and bearish price momentum, and it is often plotted beneath the graph of an asset’s price.
Traders use the RSI in various ways to support their trading decisions. Here are some common applications:
Overbought and Oversold Conditions: An RSI reading of 70 or above indicates an overbought situation, suggesting that the security may be due for a price correction1. Conversely, an RSI reading of 30 or below indicates an oversold condition, suggesting that the security may be undervalued and due for a potential rebound.
Trend Reversals: The RSI can help identify potential trend reversals or corrective pullbacks in price1. Traders look for divergences between the RSI and the price chart to spot potential shifts in market sentiment.
Buy and Sell Signals: Traders often use the RSI line crossing below the overbought line or above the oversold line as a signal to buy or sell1. However, it’s important to note that the RSI works best in trading ranges rather than trending markets.
It’s worth mentioning that the RSI is just one tool among many used by traders. It is often used in conjunction with other technical indicators to develop comprehensive trading strategies.

Bullish since DecemberMcClellan Oscillator using the NYA. Multiple confirmations on multiple timeframes.

BTC USDTWe can clearly see the bullish divergence on Klinger Oscillator on1H timeframe. Can expect a good rally on the resistances.

BTC Bearish Divergence on Daily3-period bearish divergence is discussed in Chapter 4 of Haydens Book, The Complete RSI. This is looking like a decent opportunity to short to $28k, the fast RSI 9 SMA. For additional confluence, the bearish trendline is looking strong as well, and the slope of the slow RSI 45 WMA is still negative.
I have made this oscillator available open-source and free to use in the true spirit of TradingView. Enjoy!

BTCUSD Weekly Doji - DMI/VI/DPO/Stoch AnalysisThis chart is shareable.
Possible Bullish buy zone here. Average in over the next few days = best option
Always set stop loss.
This chart shows the Directional Movement Index indicator
the Vortex Indicator
the Detrended Price Oscillator
and the Stoch indicator
All in fast lookback format on the weekly chart
Hope this helps!

EURUSD Short Setup - DPO & Stoch AnalysisBear divergence is present on the detrended price oscillator indicator
Stochastic is over bought and trending downward.
See chart for take profit and stop loss zone.
