coinbase 2026 buycreated 3/10/26
Longterm charts 1W/1D indicate market is at a historical low where breakouts are significant, even though bears still hold the majority of market on MACD for longterm charts bulls are gaining momentum, 1w macd seems to be turning a tied and want to incline from its bearish position and 1d macd hovering below the 50/50 wishes to cross the border 9 may see rejection just because macd notes this situation but, that does not change the underlying situation). note the bulls candle s
Seiiv4l
Devon Energy corp: energy stratLongterm charts 1W/1D indicate market sustainable at minimal effort and express desire to trend in a bullish manner.
Shortterm charts 4h/1h/15m suggests market is waiting on momentum to give it that push to significantly drive, these timeframes all indicate good coordination longterm as well. expect market to rally easily with ecn. note there is one other tp other than the weekly high(white line) Tp 1 would be at $65
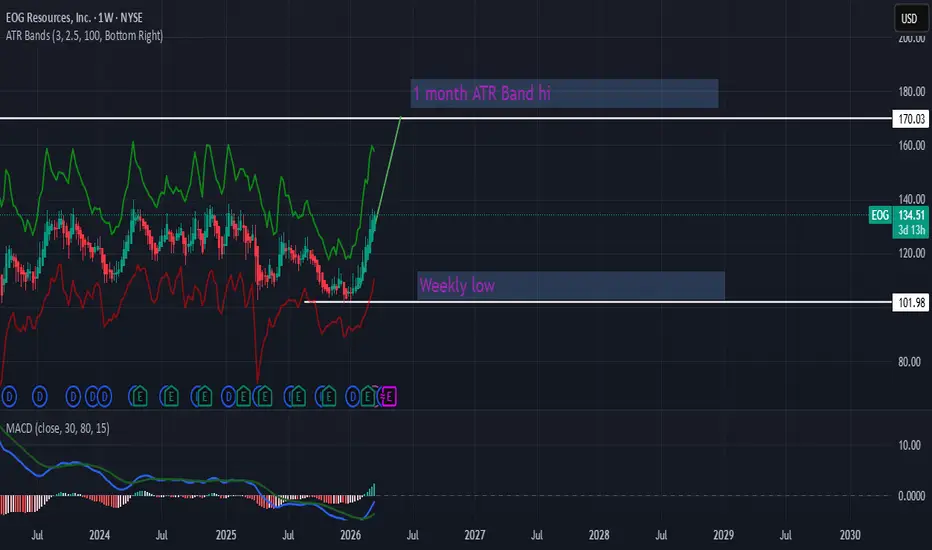
EOG Resources: Energy stratLongterm charts 1W/1D suggests market is transitioning into a trending phase as indicated by candle situation and MACD indicator, bulls momentum need to strengthen for longterm security but the foundation is there.
Shortterm charts 4h/1h/15m indicate bullish energy is sustainable but needs more momentum, positive side is trend time for bears is getting shorter and shorter which allow bulls to strengthen. Market express ability to sustain at minimum effort, may see some pullback but would not w
Clorox 2026 trackerLongterm charts 1W/1D express market has been bearish for some time although bearish market has good momentum. MACD charts are basically in sync hovering 1W chart (just below 50/50 median) 1D chart (just above 50/50 median), candle situation suggests bears momentum high but bulls are trying to steal market but momentum not on their side yet.
Shorter timeframes 4h/1h/15M suggests slowing in price movements market may see stagflation, uncertainty & instability of bulls main cause driving the patt
AI 2026 Trackerlong-term charts 1W/1D, Macd for both charts, momentum is bearish but bearish momentum trend is shortening and getting weaker bulls momentum indicated more activity on bulls side.
candle situation on bears side confirm slowed momentum and less activity creating a weak bearish trend.
Short-term charts 4h/1h/15m, suggests the markets longterm charts 1w/1d are playing catch up so expect to see lower timeframes take dips to transcend higher from lower positions . shorter timeframes macd all suggest
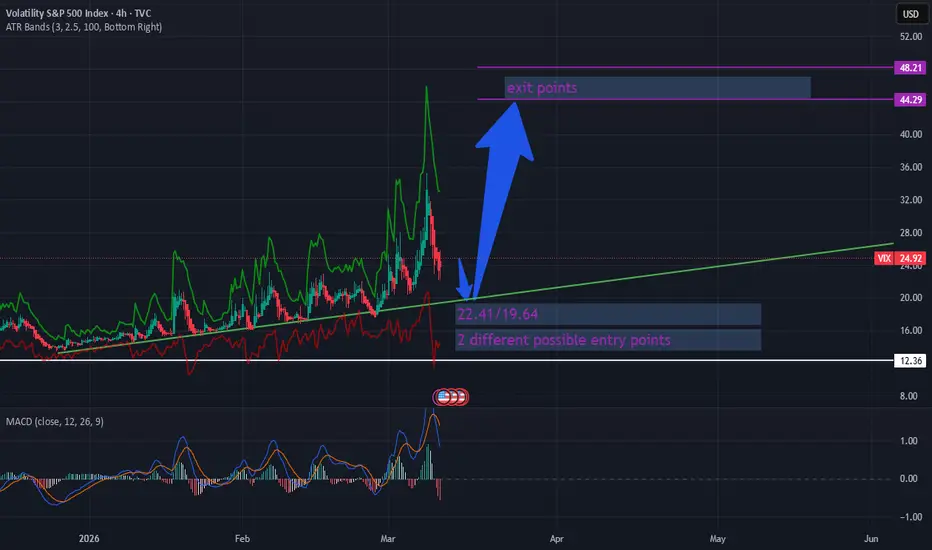
Vix 2026 created 3/10/26
higher timeframes 1W/1D, are in good position to push higher speaking candle situation, longterm charts macd weekly crossing 50/50 median with good momentum that was built from the following prior weeks, 1D macd suggests momentum need to be stronger to push for the bulls rally also indicates a short term pullback(bearish).
Shorter timeframes 4H/1H/15M suggets pullback temporary due to the nature of pullback not gaining momentum, trend time is shortening, and instability to tren
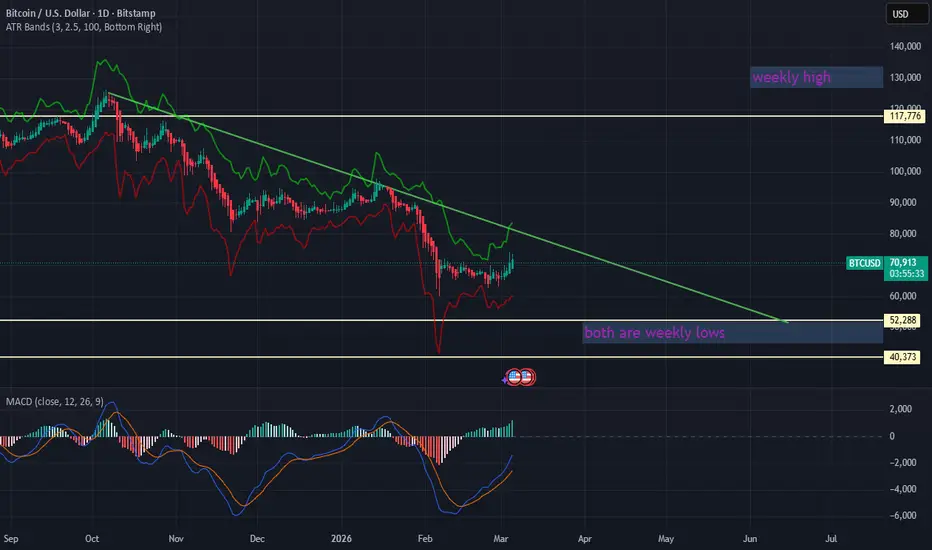
Bitcoin analysis 2026created 3/5/26
weekly/1d timeframes, are in a low momentum area may see false bullish breakouts due to 1D timeframe recently creating lower lows and macd momentum being bearish headed towards the 50/50 area which which could turn the tide for the weekly chart but that is out of the picture for now until a real confirmation comes along
DXY 2026 Tracker Created:3/3/2026
Longterm Targets 6M/12M:
current price of 99.101, historical prices suggest sustainable entry point on the bulls side, with mild volatility toward the bulls side. indicators confirm idea or slumped market signals suggest hype is curios at the switch zone to bulls side positive momentum is there as well. Longterm targets suggest market is looking for that bond move that could send it on its way up.
Shortterm Targets 1M/1W:
1M chart trading just below recent high, hist
1st Empathy Strat Revised 12/12/24Last strategy for GBP/CAD:
CAD looks like a stable market to invest in due to the momentum gaining around the currency, the oversold levels and currently low declined volatility makes it perfect for significant inclines due to unstable bearish buying power. with a economic counter to GBP's interest rate decisions week of DEC 8, and the volatility gaining around the coin, plus the bearish sustaining momentum sell GBP buy Cad.
Strategy:
Final Tp = 2.5% Round 1.75745
SMA = 1.3% Avg SMA = 0.60% re
AUD/USD BULLSEYE STRAT 11/11/24- USD expected to withstand selling pressure; oil rally, president trump re-elected + pres trump stock rally, cpi expected to hold according to economic data matches SEIIV4L Strategic Cpi signal,
(*) buy lows @ significant decline after full decline
(*) Dxy will have fake selling pressure due to uninformed investors, this will allow market to hit Tp1 currently 1.7% away from target (0.64478)
(*) Expect AUSSIE employment securities to rally AU dollar after decline total of 7.4% chopped down to
($EIIV Studio's) Move - 1-28 Mar 24 TA/TCDO I even need to say much More?
Total Trend Length (TTL) 1-28 March
15.22% =1H
8.41% = 15M
4.64% = 5M
Bearish market strong push on the bulls side, keep bullish mentality
Standard deviation method = (.4%)
Momentum DTCC
27.3% - 1H
9.12% - 15M
27.4% - 5M
Volatility DTCC
79.92% - 1H
20% - 15M
59.04% - 5M
Devation DTCC
8.52% - 1H
34.1% - 15M
2.24% - 5M
EOM = End Of Month
Red Line=Potential buy/Sell Low/high EOM / resistance
TO Be continued:
SEIIV Studio's