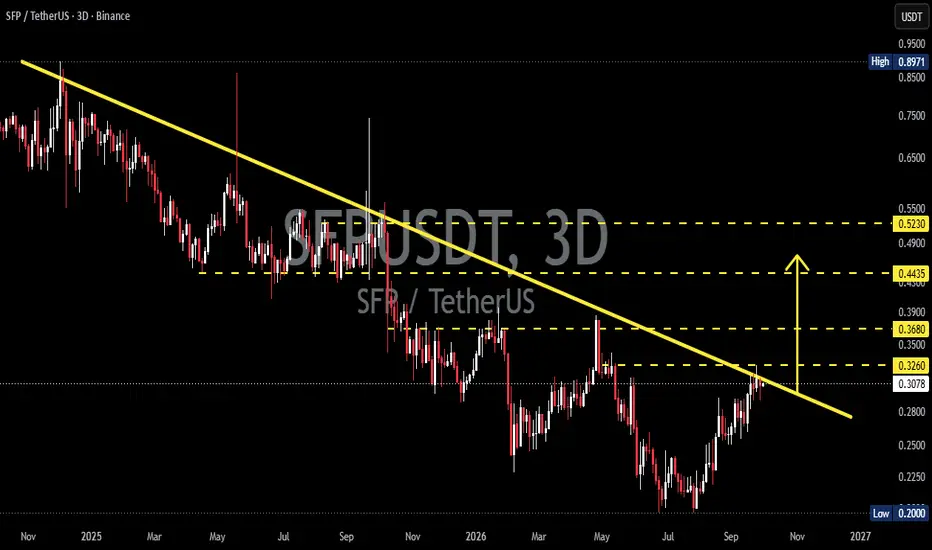
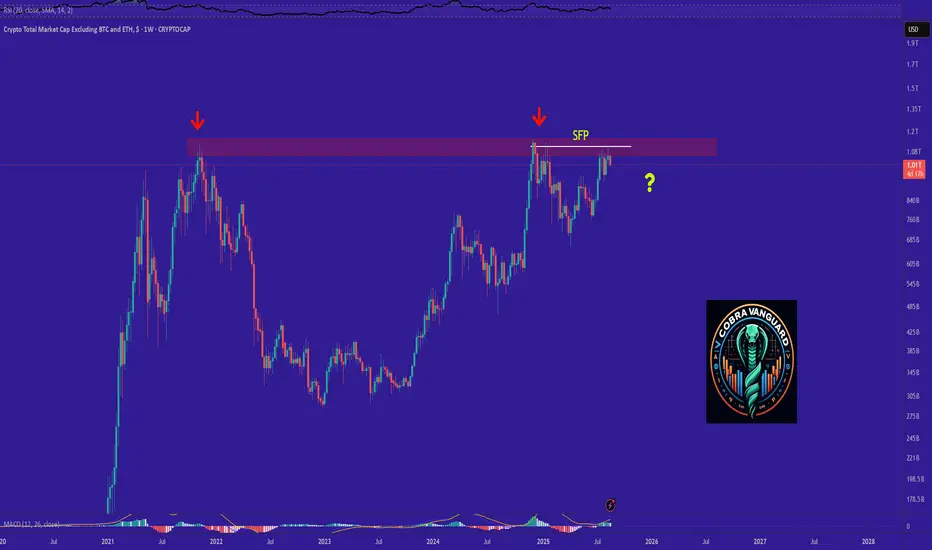
SFP at a Critical Point — Breakout or Rejection?📌 Pair: CRYPTOCAP:SFP
⏳ Time Frame: 3D
📍 Current Price: around 0.3077 USDT
📐 Pattern: Descending Trendline / Downtrend Resistance
---
🔻 Descending Trendline Structure
📉 The chart shows that SFP has been moving within a long-term downtrend, forming a series of Lower Highs (LH) connected by the descending yellow trendline.
🔎 The Descending Trendline acts as dynamic resistance. As long as price remains below this trendline, bearish pressure remains dominant.
However, price has now returned t
Sfp
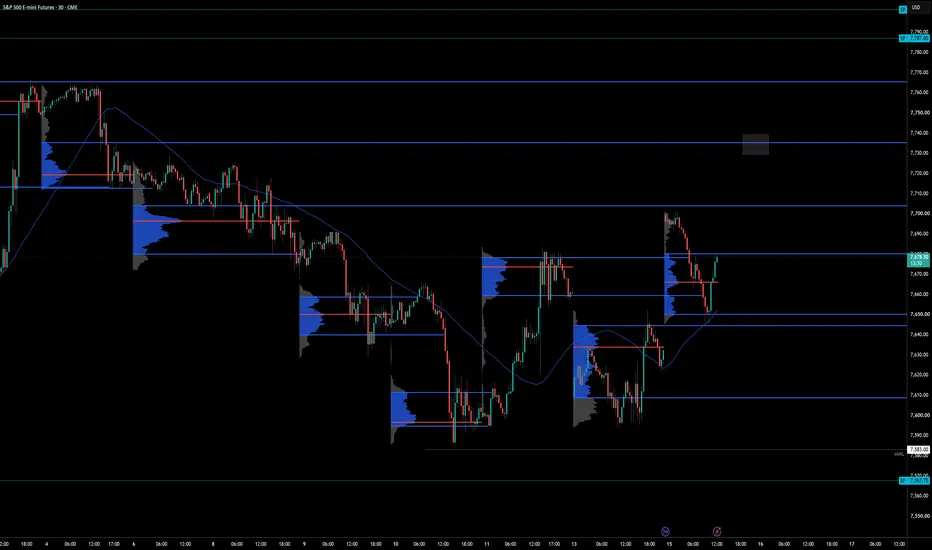
ES Short Opportunity – Untested VAH & Local Highs LiquidityToday’s level of interest comes in around 7735 on ES, where we have an untested Value Area High.
What makes this area particularly interesting is the series of local highs formed around Monday 7th and Tuesday 8th September. If price trades higher into this zone, we could potentially see those highs swept for liquidity before price reaches the untested VAH.
This gives us a nice area to monitor for a potential short scalp opportunity.
As always, 7735 is a rough zone of interest rather than a bl
BTCUSDT: Monthly Close Above the Line Would Confirm an SFPWorth flagging what this month's close actually does structurally, since it's not just a big green candle, it's sitting right at a level with real implications either way.
Price tagged 81,499.90 intramonth, comfortably above the orange line, then pulled back to close at 79,612.80, currently just below it. If the month finishes above that line rather than fading back under, that's a monthly SFP pointing up: a sweep of the level followed by a close that holds above it rather than rejecting back t
Market Concepts · Lesson 13 — SFP + Liquidity ComboLesson 13 - Swing Failures at Liquidity Pools: Two Reversal Signals Combined
Difficulty: Advanced
A swing failure on its own is powerful. A swing failure right at a known liquidity pool is one of the cleanest reversal signals the market gives you — because two independent tools are pointing at the same trap at the same time.
🔵 WHY THIS COMBO MATTERS
You already know how each signal works on its own. An SFP shows you where the market wicked past a swing point and closed back inside
USDT.D: Volume Divergence, SFP, CHoCH, Rotation UnderwayGate one, volume tells the story before price does. The volume MA was already declining into the most recent high near 8.5 to 8.6%, fewer people committing capital to stablecoins even as dominance kept pushing up. That's the first crack, participation fading while the metric itself was still rising, the same divergence pattern this feed has flagged on price charts, just applied to dominance instead.
Gate two, price swept the prior high with a clean SFP, tagging above the red resistance line bef
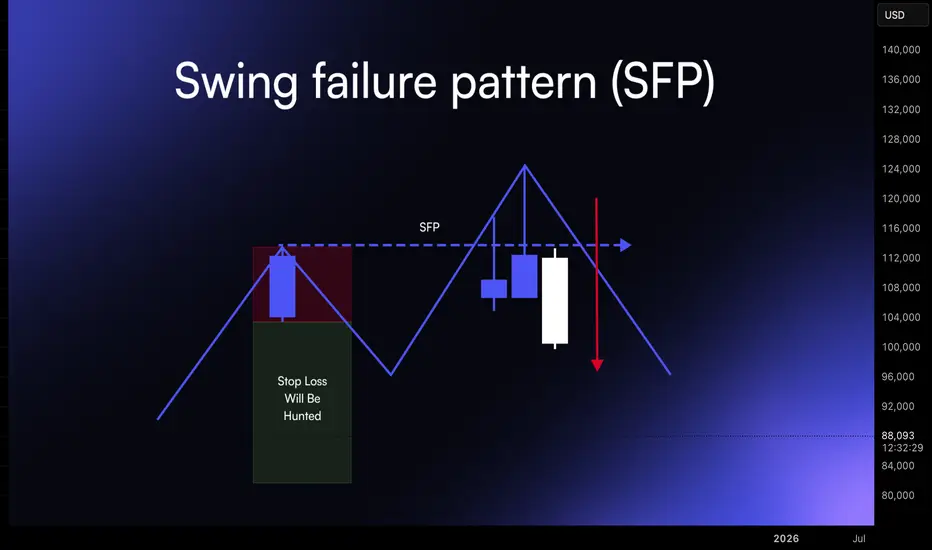
Market Concepts · Lesson 11 — Swing Failure Patterns (SFP)Lesson 11 - Spotting Swing Failure Patterns and Confirming the Trap Before You Trust It
Difficulty: Advanced
Not every breakout is a real breakout. Some are traps — designed to trigger stops just past a key level before reversing hard in the opposite direction. Learning to spot these traps in real time is one of the highest-leverage skills a trader can build.
🔵 WHAT IS A SWING FAILURE PATTERN
A Swing Failure Pattern (SFP) happens when price briefly breaks past a previous swing hig
NQ at Key Support – pwVAL Reclaim or Lower Single Prints?NQ is currently trading from a key support area, with price reacting around a naked weekly Value Area Low while also working on reclaiming the previous week's Value Area Low.
As long as this area continues to hold, I'll be watching the local lows closely. Another swing failure pattern / liquidity sweep of those lows could provide a nice scalp opportunity if the confirmation is there.
If this support is lost, my attention shifts lower towards the unfilled Single Prints around 29,171, which also
SFP / SFPUSDT Long Setup | Breaker Block ReclaimMARKET ANALYSIS
SFP is currently reacting from a key technical area highlighted on the chart.
As long as the protected support zone remains intact, the bullish market structure remains valid and higher liquidity targets may continue to attract price action.
A breakdown below the invalidation level would weaken the current bullish scenario and require a reassessment of market conditions.
📍 Entry, Stop Loss and Take Profit levels are marked directly on the chart.
━━━━━━━━━━━━━━
⚠️ DISCLA
BTC Short SFP 8 hr- All time Fav SetupThe Swing Failure Pattern (SFP) has endless characterizations, and this one here is one of our favorite, which is why it's a short trigger in the strategy shown here. Not only do we have a solid 9 bar OBV down with slope, it's a bearish engulfing 10 previous bars, with a follow through immediately after the signal. ROC 200 is below the zero line and in white territory which means the consolidation has been lengthy and fully exhausted; it’s in the zone for the real move to present.
This is a si
SOLUSDT: SFP CHoCH Short From the OB, Both Targets FilledGate one, BOS confirmed bearish structure had already shifted before the retrace back up into the OB even began.
Gate two, price ran back up into the order block near 78.60 to 79.00, sweeping above the recent high in the process before failing to hold it. That's the SFP component: taking out a swing high to grab the resting liquidity above it, then reversing rather than continuing.
Gate three, CHoCH confirmed once price rejected off the OB and closed back below the 0.382 to 0.295 band, the con
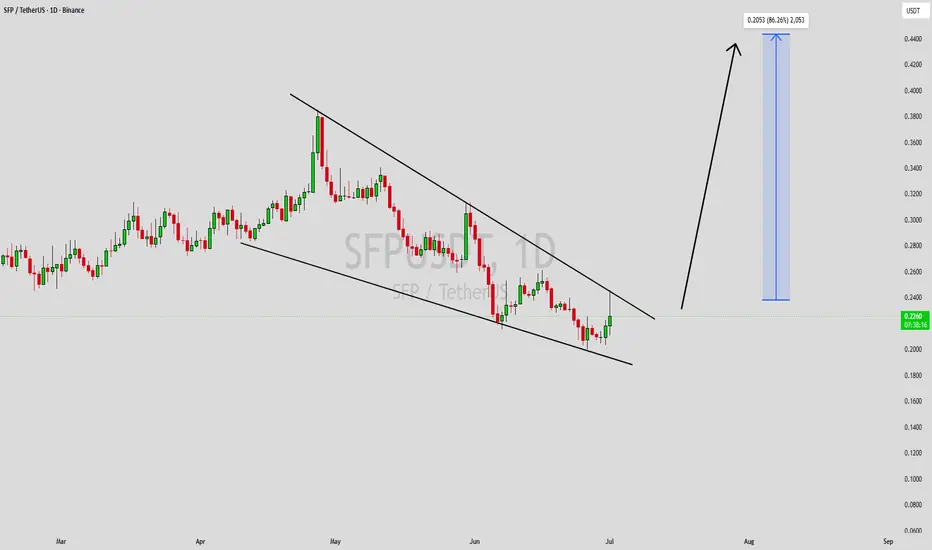
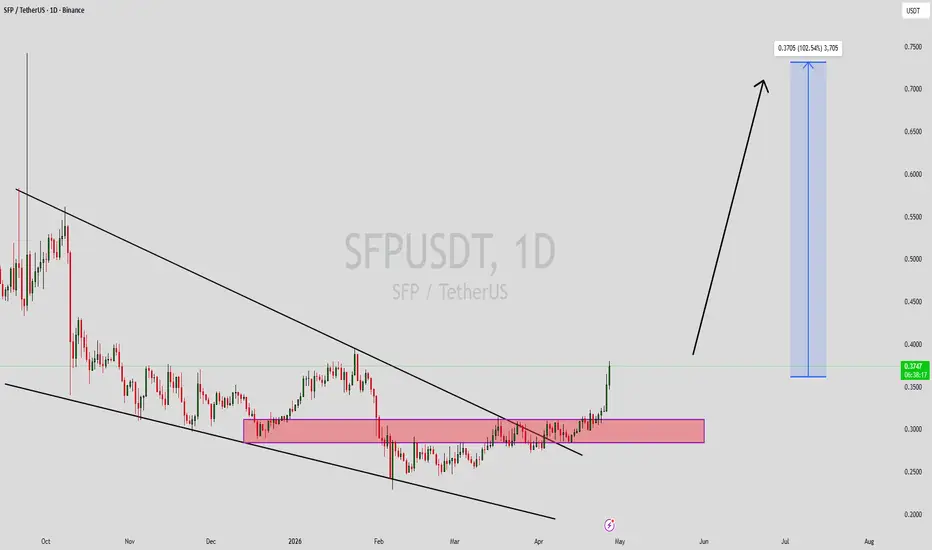
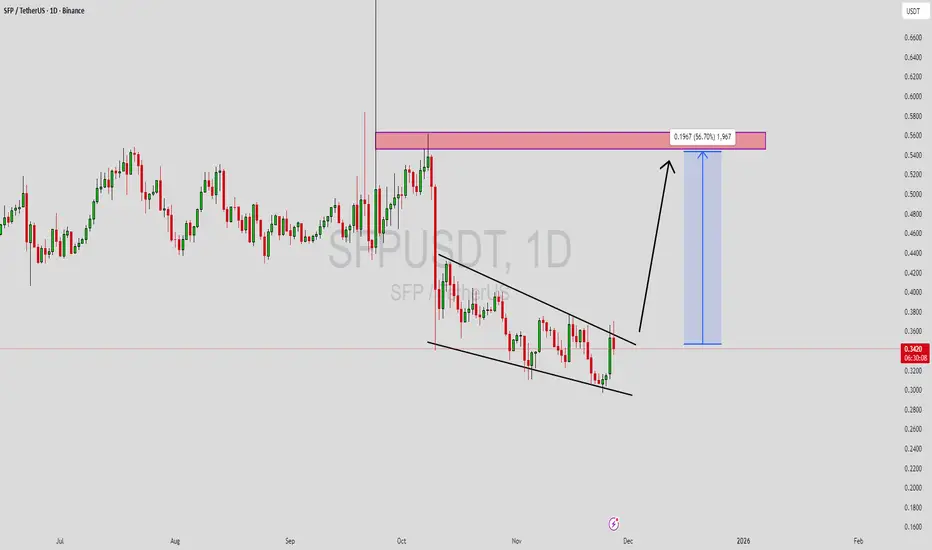
SFPUSDT Forming Falling WedgeSFPUSDT is forming a clear falling wedge pattern, a classic bullish wave signal that often indicates an upcoming breakout. The price has been consolidating within a narrowing range, suggesting that selling pressure is weakening while buyers are beginning to regain control. With consistent volume confirming accumulation at lower levels, the setup hints at a potential bullish breakout soon. The projected move could lead to an impressive gain of around 70% to 80% once the price breaks above the wed
SFPUSDT Forming Bullish MomentumSFPUSDT is currently forming a clear bullish momentum pattern, a classic wave structure that often signals an upcoming breakout. The price has been consolidating within a narrowing range, indicating that selling pressure is gradually weakening while buyers are beginning to regain control. With consistent volume supporting accumulation at lower levels, the setup suggests a strong potential for a bullish breakout in the near term.
If the price breaks above the wedge resistance, the projected move
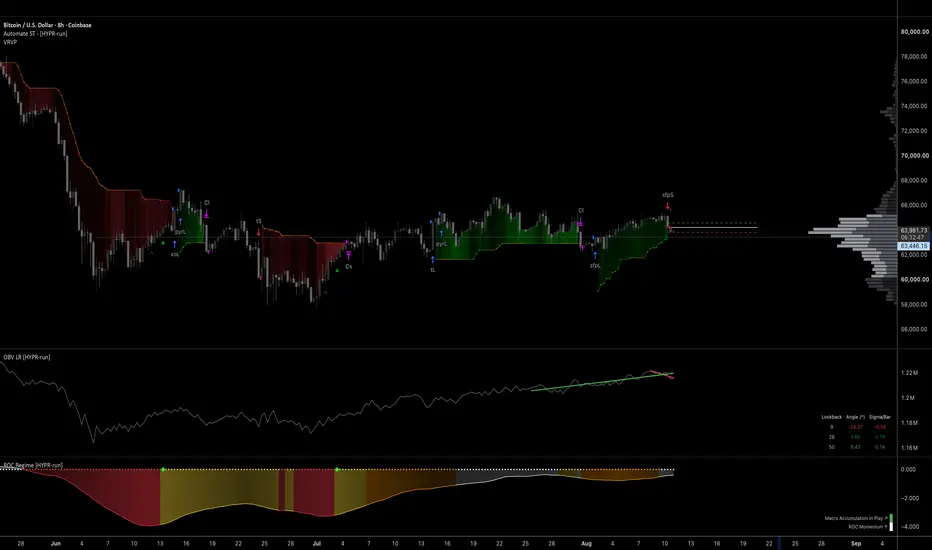
Top of Range SFP Short - Size to risk, not to conviction.The sfpL from the last Idea (Automate ST Strategy) played out for an 8% move despite the filters suggesting otherwise. Now the mirror signal fires from the top of the range.
OBV 50 is positive but 9/26 are both negative slope which is genuine confirmation for SFP short signals. ROC Regime shows momentum to the upside, but the 8hr is laggy and still below zero. Regime Factor at 0.40 coming off a strong XU through the upper boundary to the neutral zone which is the sweet-spot to take a trade t
Swing Failure Pattern (SFP): When Price ReversesThe swing failure pattern is a liquidity event, not a candle pattern. It marks the moment when the market reaches for obvious stops, absorbs them, and reveals true intent.
An SFP forms when price trades beyond a well-defined swing high or low and then fails to hold acceptance outside that level. The extension triggers breakout entries and stop losses. The immediate rejection back inside the range confirms that the move was used to collect liquidity rather than to continue.
What the structure t
BEducation
EASY SHORT TO $1000Failed auction of the all time highs. local range support also lost.
$1000 or even $950 next.
Calculate Your Risk/Reward so you don't lose more than 1% of your account per trade.
Every day the charts provide new information. You have to adjust or get REKT.
Love it or hate it, hit that thumbs up and share your thoughts below!
This is not financial advice. This is for educational purposes only.
SFPUSDT Forming Falling WedgeSFPUSDT is forming a clear falling wedge pattern, a classic bullish reversal signal that often indicates an upcoming breakout. The price has been consolidating within a narrowing range, suggesting that selling pressure is weakening while buyers are beginning to regain control. With consistent volume confirming accumulation at lower levels, the setup hints at a potential bullish breakout soon. The projected move could lead to an impressive gain of around 40% to 50% once the price breaks above the
BTC — Is This the End of Bitcoin’s Bull Market?First of all, I’ve been quite busy the past few weeks working on some exciting projects and developing new indicators that’s why I haven’t posted much here lately. But now I’m back with a fresh Bitcoin analysis, and there’s a lot to unpack.
Macro Context
BTC’s recent structure has played out exactly like a classic Wyckoff Distribution schematic.
Back in mid-July (14th July 2025), we printed a Buying Climax (BC), followed by an Upthrust (UT) → SFP / liquidity grab. Later, price formed a UTAD
SEPT 23: Swing Failure Pattern Done Correctly?SEPT 23: Swing Failure Pattern Done Correctly?
I guess this is it. I got stopped out once though, but I had conviction in the trading idea so I re-entered with a stop limit.
It went well.
What I did right on this trade though?
I followed my trading plan:
1. Top Down Analysis
2. Price didn't break through the HTF swing point, just went close to it. Swing Failure Pattern.
3. Divergence + Overbought conditions ongoing
4. Volume profiles indicating POC is below price, means sooner or later it'll
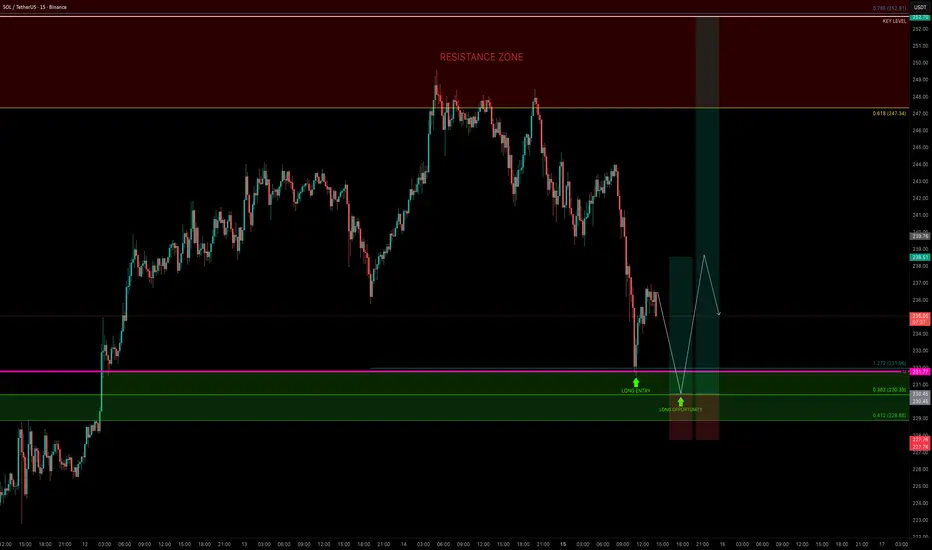
SOL — Bulls Need to Defend $230 for ContinuationSOL had a strong bullish week, almost tapping the $250 psychological level before rejecting down into the monthly level at $231.77, where price found support and bounced. This level also aligned with the 1.272 Fib extension ($231.96), making it a valid long opportunity.
🟢 Next Long Opportunity
The 0.382 Fib retracement ($230.39) of the move from the $199.32 low is the next key level to watch.
A retest here would:
Sweep liquidity from the current low
Offer a low-risk entry
Help fill som
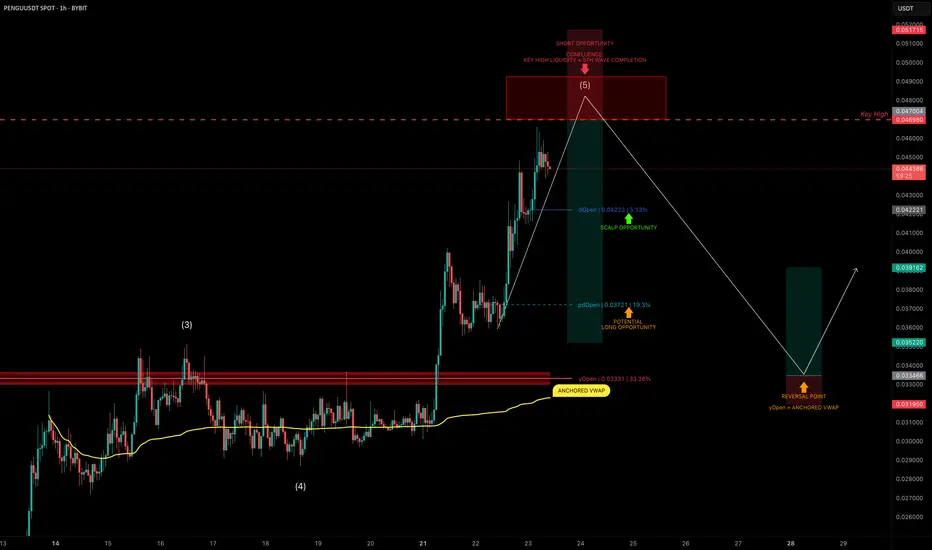
PENGU Topping Out? Targeting 30% Downside After Liquidity SweepPENGU has had an explosive run, but it now looks to be nearing completion of wave 5 of its current Elliott impulse.
We’re approaching a key high at $0.04698, a likely liquidity grab zone — and potentially a great area to position for a short trade.
🧩 Short Setup Overview
➡️ Wave 5 Completion Incoming:
Price is showing signs of exhaustion as it approaches $0.04698, where liquidity is likely stacked above the previous high.
➡️ SFP Trigger Zone:
Watch for a swing failure pattern (SFP) at $0
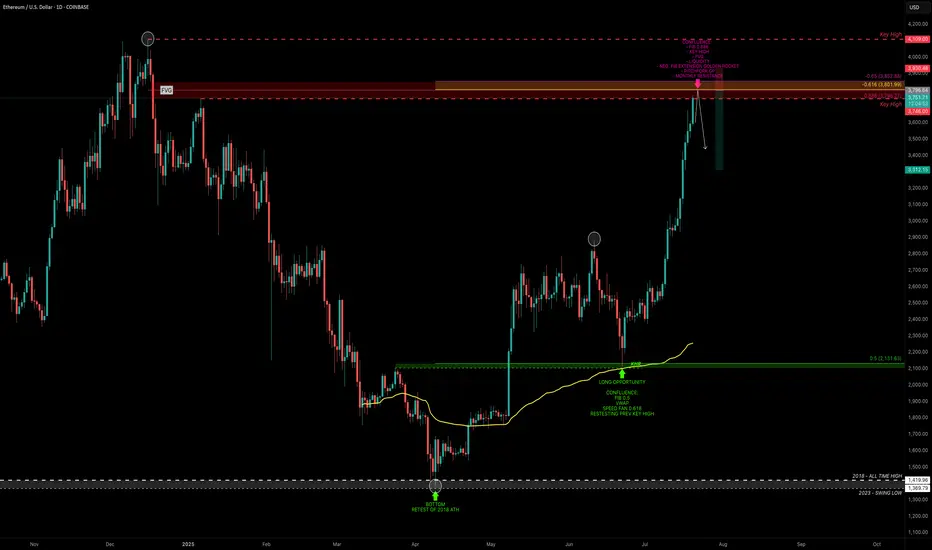
ETH — Rally Exhaustion or More Upside?ETH has been on an absolute tear. After retesting its old 2018 all-time high, it marked a bottom at $1383 — a brutal -66% correction over 114 days from the $4109 top.
From there, ETH ripped +100% in just one month, followed by 40 days of consolidation, and now, over the past 28 days, it’s surged another +76%, currently trading around $3715 — all without any major correction.
So the big question:
What’s next? Are we near a short setup, or is it time to long?
Let’s break it down.
🧩 Key Tec